. 2021 Dec 1;29(12):3383-3397.
doi: 10.1016/j.ymthe.2021.06.017. Epub 2021 Jun 24.

Predicting genotoxicity of viral vectors for stem cell gene therapy using gene expression-based machine learning

Affiliations

Predicting genotoxicity of viral vectors for stem cell gene therapy using gene expression-based machine learning

Adrian Schwarzer et al. Mol Ther. .

Abstract

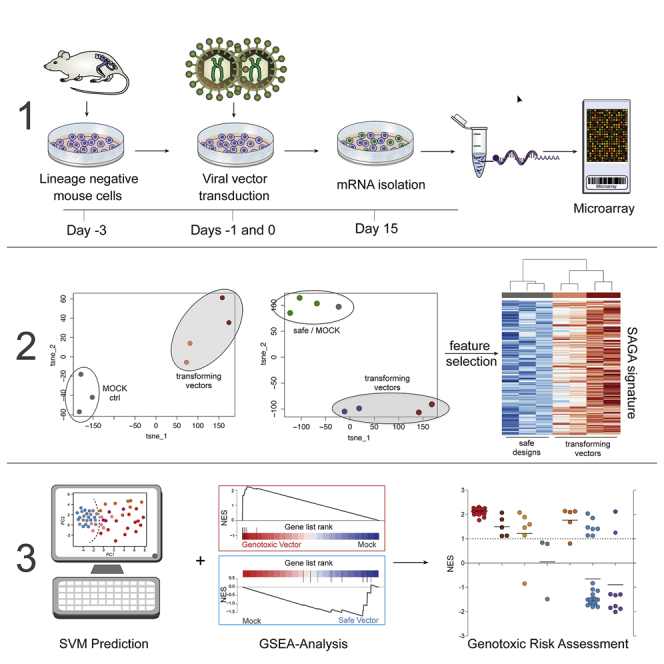
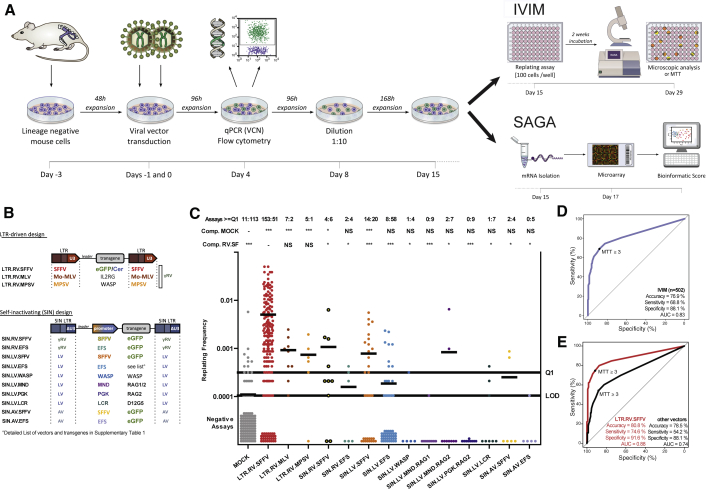
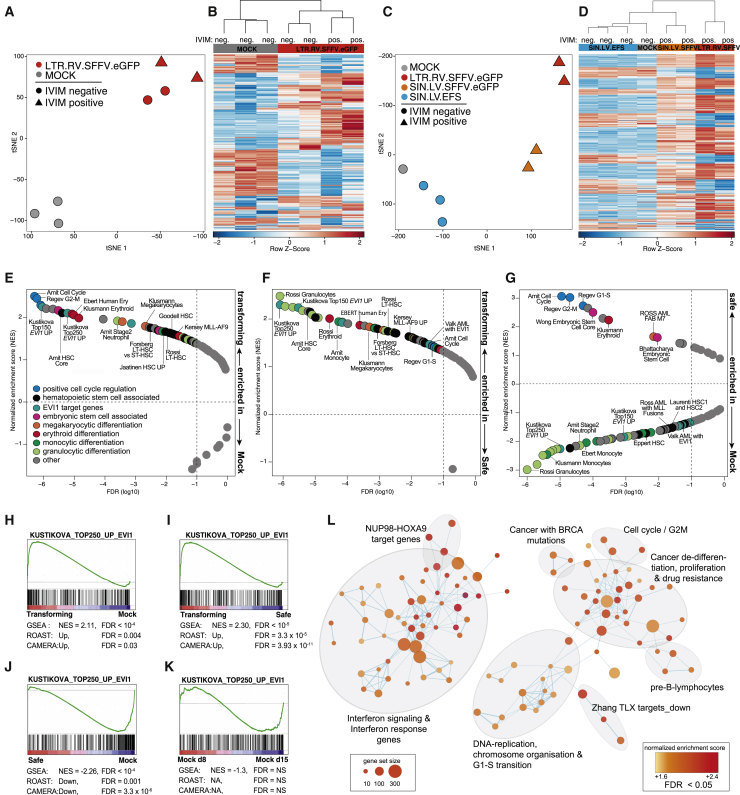
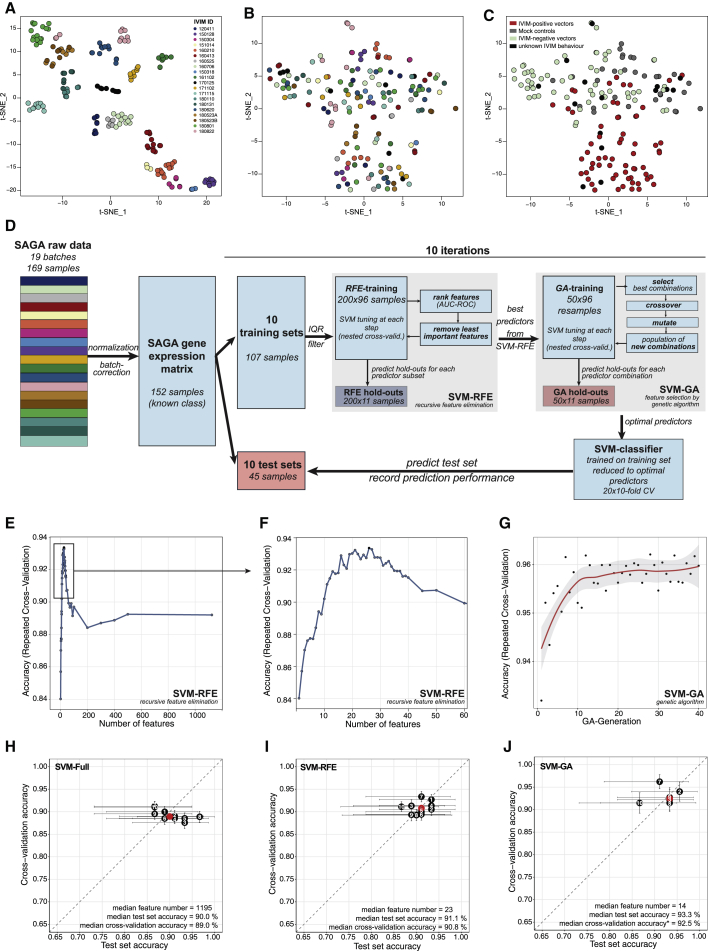
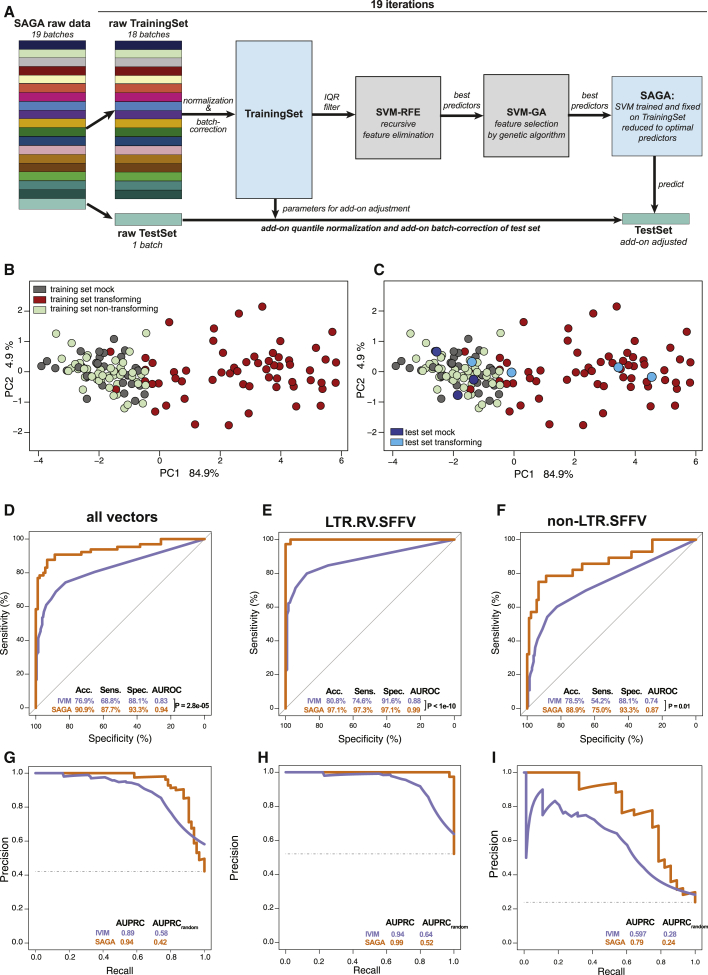
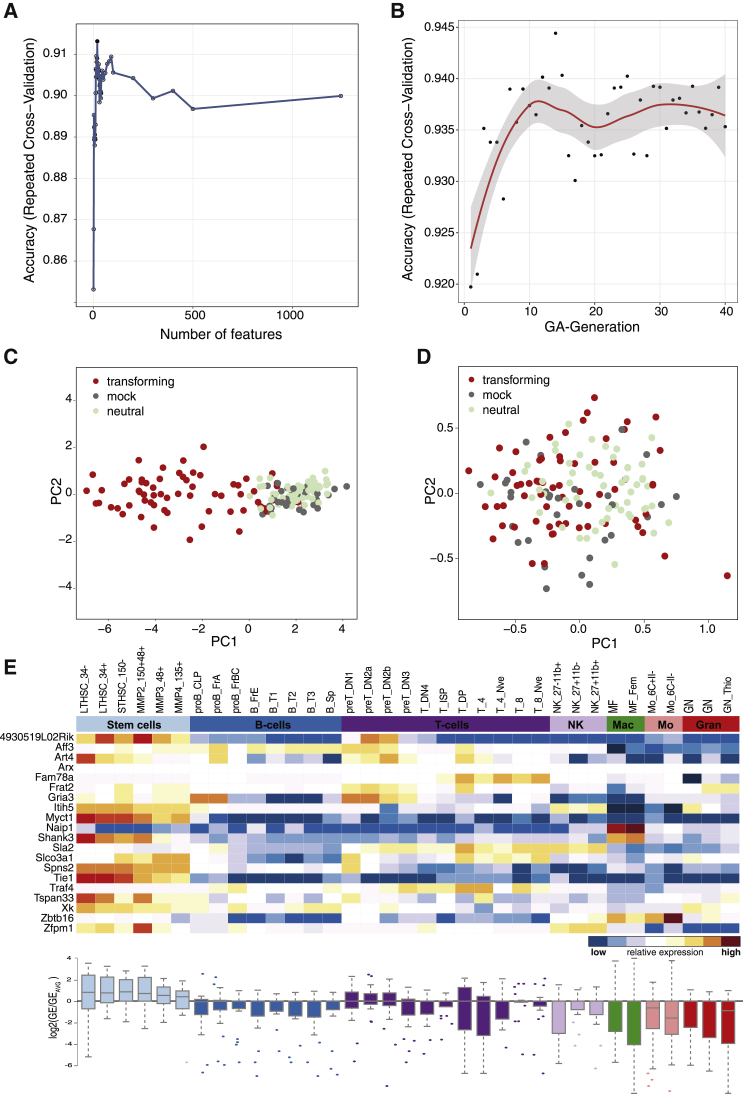
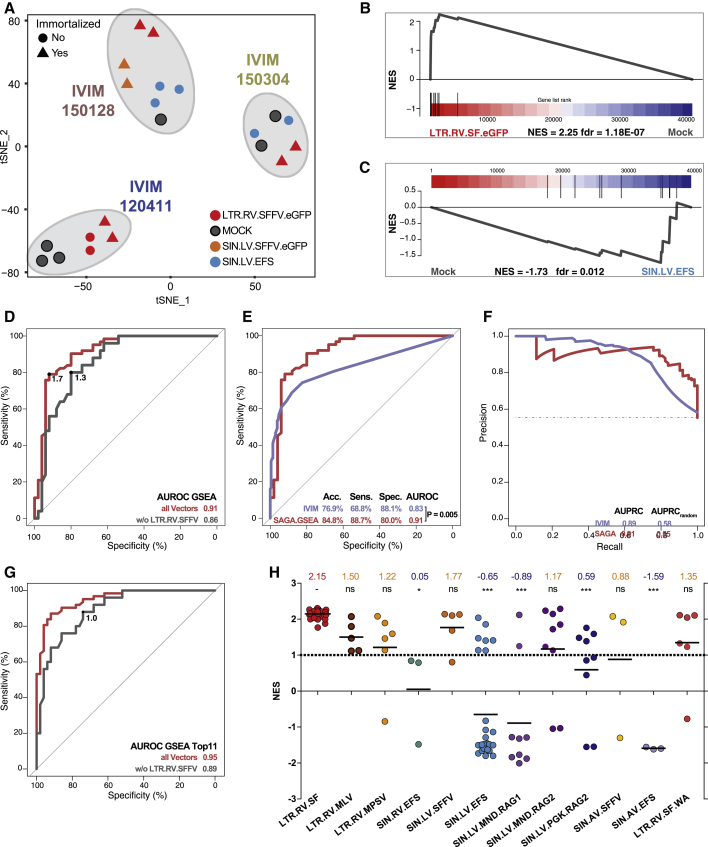
Hematopoietic stem cell gene therapy is emerging as a promising therapeutic strategy for many diseases of the blood and immune system. However, several individuals who underwent gene therapy in different trials developed hematological malignancies caused by insertional mutagenesis. Preclinical assessment of vector safety remains challenging because there are few reliable assays to screen for potential insertional mutagenesis effects in vitro. Here we demonstrate that genotoxic vectors induce a unique gene expression signature linked to stemness and oncogenesis in transduced murine hematopoietic stem and progenitor cells. Based on this finding, we developed the surrogate assay for genotoxicity assessment (SAGA). SAGA classifies integrating retroviral vectors using machine learning to detect this gene expression signature during the course of in vitro immortalization. On a set of benchmark vectors with known genotoxic potential, SAGA achieved an accuracy of 90.9%. SAGA is more robust and sensitive and faster than previous assays and reliably predicts a mutagenic risk for vectors that led to leukemic severe adverse events in clinical trials. Our work provides a fast and robust tool for preclinical risk assessment of gene therapy vectors, potentially paving the way for safer gene therapy trials.

Keywords: gene expression; gene therapy; genotoxicity; in vitro assay; insertional mutagenesis; integrating viral vectors; machine learning; preclinical risk assessment; safety assay gene therapy; support vector machine.


Conflict of interest statement

Declaration of interests A patent application has been filed under registration number EP3394286A1 (Analytical process for genotoxicity assessment).

Figures

None
Graphical abstract
Figure 1
Figure 1
IVIM and SAGA assays to detect vector genotoxicity in vitro (A) Workflow of the in vitro genotoxicity assays. (B) Vector designs used in this study. Indicated are the various promoters and transgenes tested in our study (for details, see Table S1). (C) Replating frequencies (RFs) of different IVIM samples (n = 502) measured in 68 IVIM assays. Each dot represents one individual sample. RFs above Q1 (Q1 = 0.75 quantile of the RF for LTR.RV.SFFV) are counted as positive assays. LOD, limit of detection. Above the graph, the ratios of assays with RFs above and below Q1 are shown. Differences in the incidence of positive and negative assays relative to mock- or LTR.RV.SFFV-transduced cells were analyzed by Fisher’s exact test with Benjamini-Hochberg correction (∗p < 0.05, ∗∗∗p < 0.001; NS, not significant). Bars indicate mean RF. (D) Receiver operating characteristic (ROC) of the IVIM assay for samples (n = 502) with known activity in the IVIM assay. (E) Same as in (D) with separate curves for strongly transforming vectors (LTR.RV.SFFV) and mock controls (red curve) and weakly transforming vectors, safe vectors, and mock controls (black curve) for which the classification based on repeated testing in the IVIM assay was known.
Figure 2
Figure 2
Transforming vectors impose an oncogenic gene expression signature in murine HSPCs (A) t-distributed stochastic neighbor embedding (t-SNE) of three mock samples (gray) and 4 samples transduced with LTR.RV.SFFV (red) from one SAGA assay (ID 120411) using all 36,226 annotated probes. (B) Hierarchical clustering of the samples shown in (A) based on the most variable probes (top 1%). (C) t-SNE of a second SAGA assay (ID 150128, 36,226 annotated probes). (D) Hierarchical clustering of the samples shown in (C) based on the most variable probes (top 1%). (E) Gene set enrichment analysis (GSEA) of hematopoiesis-associated gene sets (Table S3, tab 1) of samples transduced with IVIM-transforming vectors versus mock controls. Plotted are normalized enrichment scores (NESs) against the false discovery rate (FDR). The enrichment cutoff (FDR < 0.1) is indicated by the dashed line. (F) GSEA of IVIM-transforming vectors against IVIM-safe vectors. (G) GSEA of samples transduced with IVIM-safe vectors against mock controls. (H–K) GSEA plots for EVI1 target genes for the contrasts (H) transforming versus mock, (I) transforming versus safe, (J) safe versus mock, (K) mock day 8 versus mock day 15. (L) Enrichment map of highly upregulated (FDR < 0.005) gene sets from MSigDB in samples transduced with transforming vectors compared with mock control and safe samples.
Figure 3
Figure 3
Development phase of an SVM classifier to predict genotoxicity (A–C) Data preprocessing. (A) t-SNE representation of all 169 SAGA assays after quantile normalization using all 39,428 probes. The coloring scheme encodes individual SAGA assays. (B) t-SNE of the 169 SAGA-samples after quantile normalization and ComBat correction using the same color key as in (A). (C) t-SNE plot as in (B) with the samples color coded according to vector properties in the IVIM assay. IVIM positive, transforming vectors; IVIM negative, nontransforming vectors; mock, untransduced controls; unknown, IVIM data inconclusive. (D) Scheme of classifier development during the development phase. The complete raw dataset was quantile normalized and batch corrected. The dataset was split 10 times into training (70% of samples) and test sets (30% of samples). Feature selection by SVM-RFE and SVM-GA was performed by further splitting the training sets using repeated cross-validation and monitoring prediction performance using the hold-out samples. Tuning of the SVM was performed at each step of the feature selection routines using nested cross-validation. An SVM with radial kernel was trained on the training set reduced to the optimal predictors found by SVM-RFE and SVM-GA and used to predict the test set. (E and F) Performance profile of SVM-RFE: accuracy on the hold-out samples plotted against the number of remaining probes during SMV-RFE for a representative training set (split 7). (G) Performance profile of SVM-GA: accuracy on the hold-out samples plotted against generation of the GA for training set 7. (H and I) Estimates of the prediction accuracy for the full models (H), RFE models (I), and GA models (J) using the test set (x axis) or repeated cross-validation (y axis). The horizontal and vertical bars represent the 95% confidence intervals using the test set and resampling approach, respectively.
Figure 4
Figure 4
Estimation of model performance via the leave-one-batch-out approach (A) Scheme of the leave-one-batch-out approach used to estimate SAGA performance. Details are given in the main text. (B) PCA representation of training set 01 reduced to the 8 optimal predictors derived from the training set and used to train the SVM. (C) Projection of add-on adjusted test set 01 samples into the PCA plot spanned by training set 01. (D–I) Aggregated prediction results over 19 iterations for the leave-one-batch-out approach versus a conventional IVIM assay. (D) AUC-ROC for all vector genera. (E) AUC-ROC for strongly transforming LTR.RV.SFFV vectors. (F) AUC-ROC for non-LTR.RV.SFFV vectors. (G) AUC-PRC for all vector genera. (H) AUC-PRC for strongly transforming LTR.RV.SFFV vectors. (I) AUC-PRC for non-LTR.RV.SFFV vectors.
Figure 5
Figure 5
Construction of the final SAGA classifier (A) Performance profile of the SVM-RFE procedure for the complete set of 152 samples. The filled circle represents the predictor subset with the highest performance comprised of the 20 most important predictors. (B) Performance profile of the SVM-GA procedure for the complete set of 152 samples over 40 generations of the GA. (C) Principal-component analysis (PCA) of 152 samples with known IVIM activity on the 11 optimal probes found by SVM-GA. (D) PCA of 152 samples with known IVIM activity on 11 randomly selected probes of 36,226 annotated probes. (E) Heatmap representing expression of the 20 genes with the highest predictive power from SVM-RFE across murine hematopoiesis. The boxplot below the heatmap represents the expression of genes in each column relative to the expression of all genes. LT-HSC, long-term HSC; ST-HSC, short-term HSC; MPP, multipotent progenitor; Mac/MF, macrophage; Mo, monocyte; Gran/GN, granulocyte.
Figure 6
Figure 6
SAGA-GSEA (A) t-SNE representation of gene expression data from three independent SAGAs without batch correction. (B) GSEA plot for the 11 optimal predictors from the final classifier for LTR.SFFV.EGFP (sample X4991) versus mock from IVIM 3 (shown in A). (C) GSEA plot for the 11 optimal predictors for SIN.LV.EFS (sample X4997) versus mock from IVIM 3. (D) AUC-ROC aggregated from the leave-one-batch-out approach for all vector genera (red) and without strongly transforming LTR.RV.SFFV vectors (gray). The points on the curve indicate the best NES cutoff. (E) AUC-ROC for all vector genera (same curve as in D) versus AUC-ROC of the IVIM assay. (F) AUC-PRC aggregated from the leave-one-batch-out approach for all vector genera versus IVIM. (G) AUC-ROC using the 11 optimal predictors from the final classifier on all IVIM batches for all vector genera (red) and without strongly transforming LTR.RV.SFFV vectors (gray). The point on the curve indicates the best NES cutoff. (H) SAGA-GSEA results for all tested vectors. Plotted are the NESs of the 11-probe gene set from the final classifier over the different vector genera. The dashed line denotes NES ≥ 1.0, indicating evidence of genotoxicity as determined from the ROC analysis (Figure 6G) for genotoxic vectors when the strongly transforming LTR.SFFV samples were disregarded. Above the graph, mean NES values are shown for each vector type. The level of evidence whether the NES is significantly different from the positive control is indicated (ns = not significant, ∗p < 0.05, ∗∗∗p < 0.001; p values were calculated using a Kruskal-Wallis test with Dunn’s post hoc test).

References

    1. Morgan R.A., Gray D., Lomova A., Kohn D.B. Hematopoietic Stem Cell Gene Therapy: Progress and Lessons Learned. Cell Stem Cell. 2017;21:574–590. - PMC - PubMed
    1. Hacein-Bey-Abina S., von Kalle C., Schmidt M., Le Deist F., Wulffraat N., McIntyre E., Radford I., Villeval J.-L., Fraser C.C., Cavazzana-Calvo M., Fischer A. A serious adverse event after successful gene therapy for X-linked severe combined immunodeficiency. N. Engl. J. Med. 2003;348:255–256. - PubMed
    1. Stein S., Ott M.G., Schultze-Strasser S., Jauch A., Burwinkel B., Kinner A., Schmidt M., Krämer A., Schwäble J., Glimm H., et al. Genomic instability and myelodysplasia with monosomy 7 consequent to EVI1 activation after gene therapy for chronic granulomatous disease. Nat. Med. 2010;16:198–204. - PubMed
    1. Braun C.J., Boztug K., Paruzynski A., Witzel M., Schwarzer A., Rothe M., Modlich U., Beier R., Gohring G., Steinemann D., et al. Gene Therapy for Wiskott-Aldrich Syndrome–Long-Term Efficacy and Genotoxicity. Sci. Transl. Med. 2014;6:227ra33. - PubMed
    1. Howe S.J., Mansour M.R., Schwarzwaelder K., Bartholomae C., Hubank M., Kempski H., Brugman M.H., Pike-Overzet K., Chatters S.J., de Ridder D., et al. Insertional mutagenesis combined with acquired somatic mutations causes leukemogenesis following gene therapy of SCID-X1 patients. J. Clin. Invest. 2008;118:3143–3150. - PMC - PubMed

Publication types