

The development of theta and alpha neural oscillations from ages 3 to 24 years
- PMID: 34174512
- PMCID: PMC8249779
- DOI: 10.1016/j.dcn.2021.100969
The development of theta and alpha neural oscillations from ages 3 to 24 years
Abstract
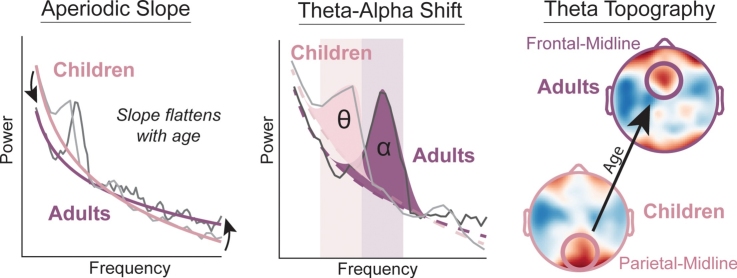
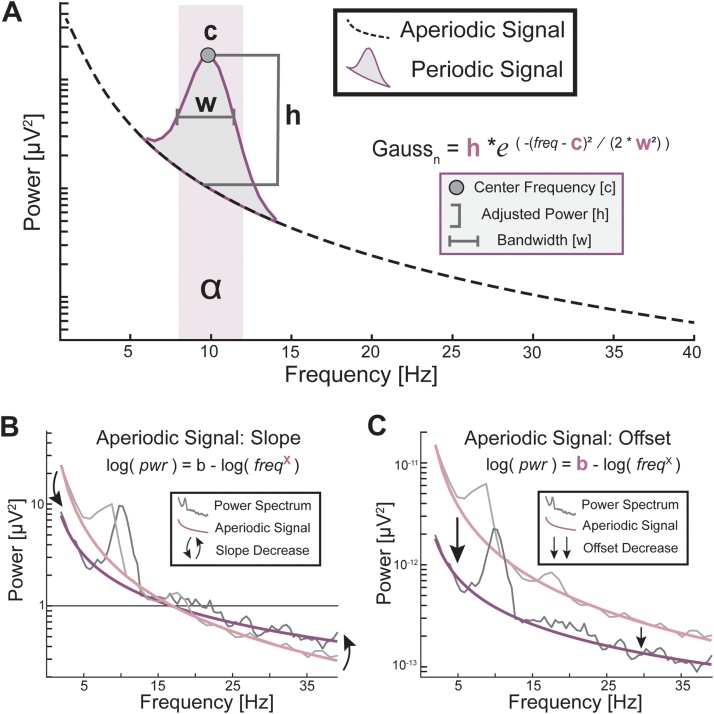
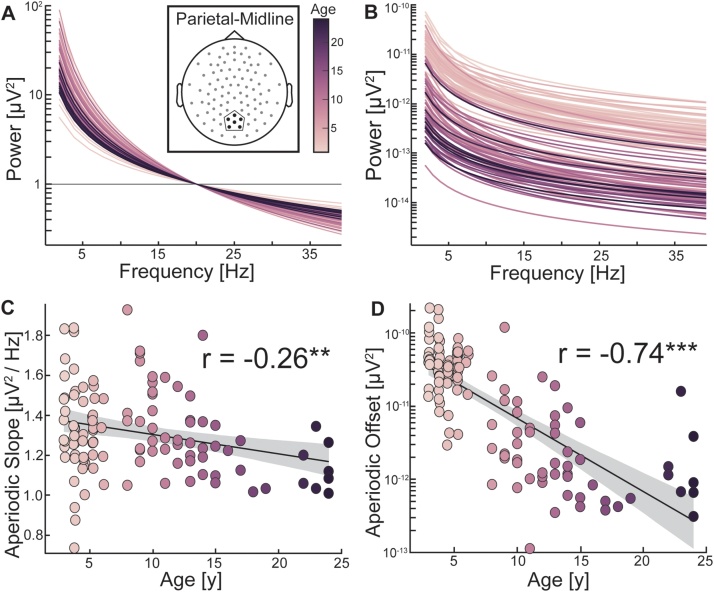
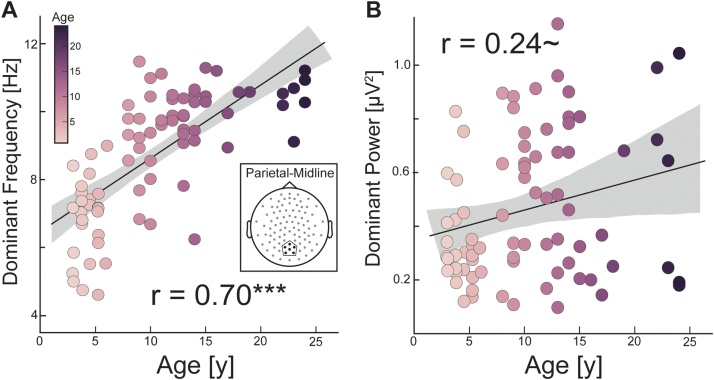
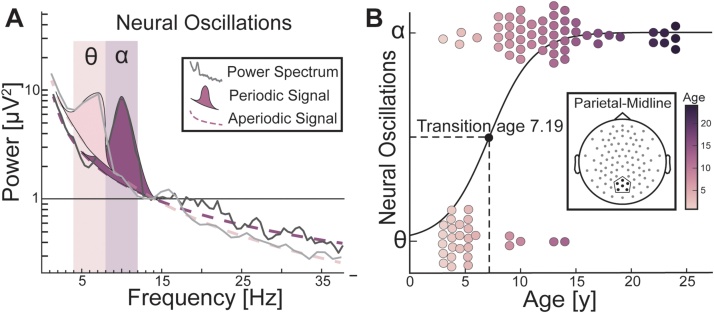
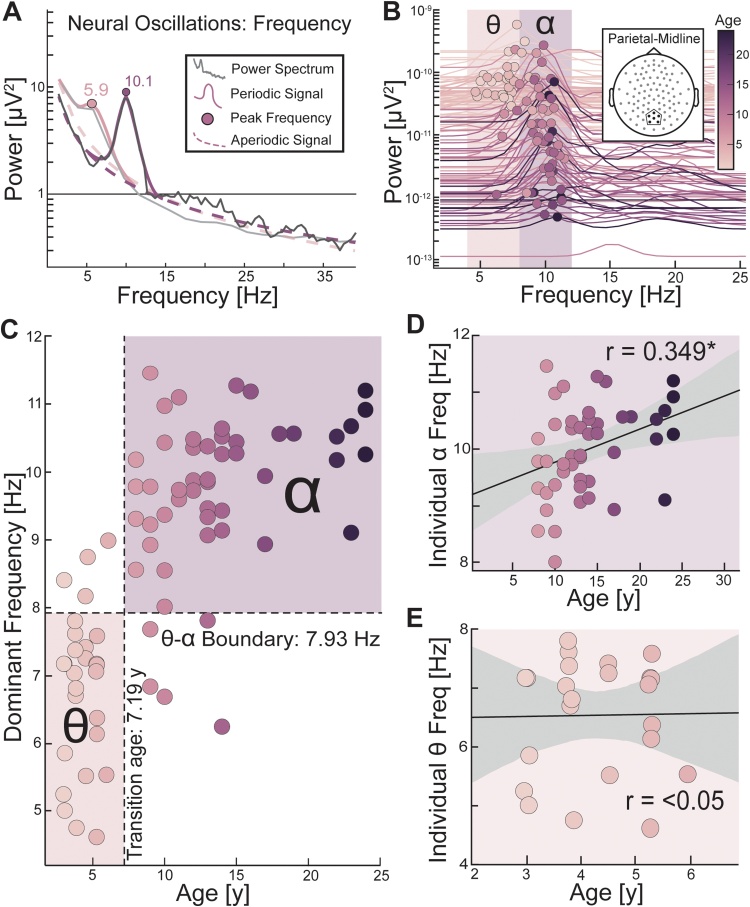
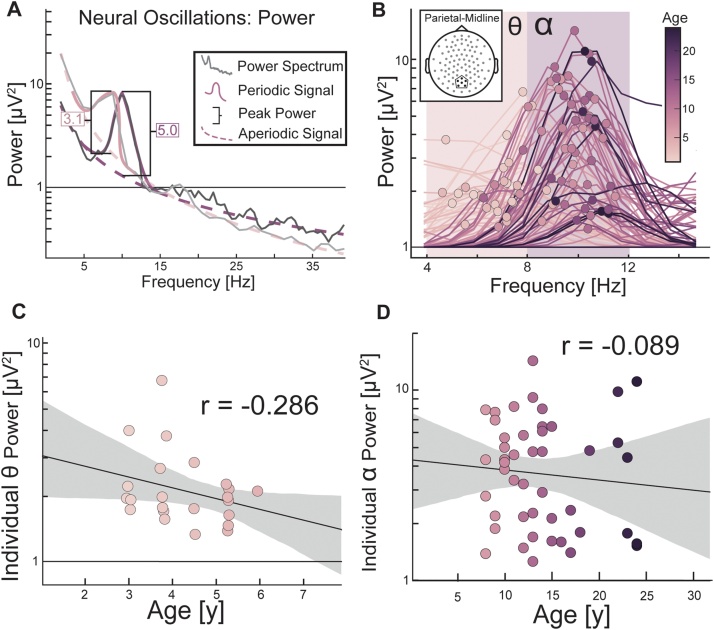
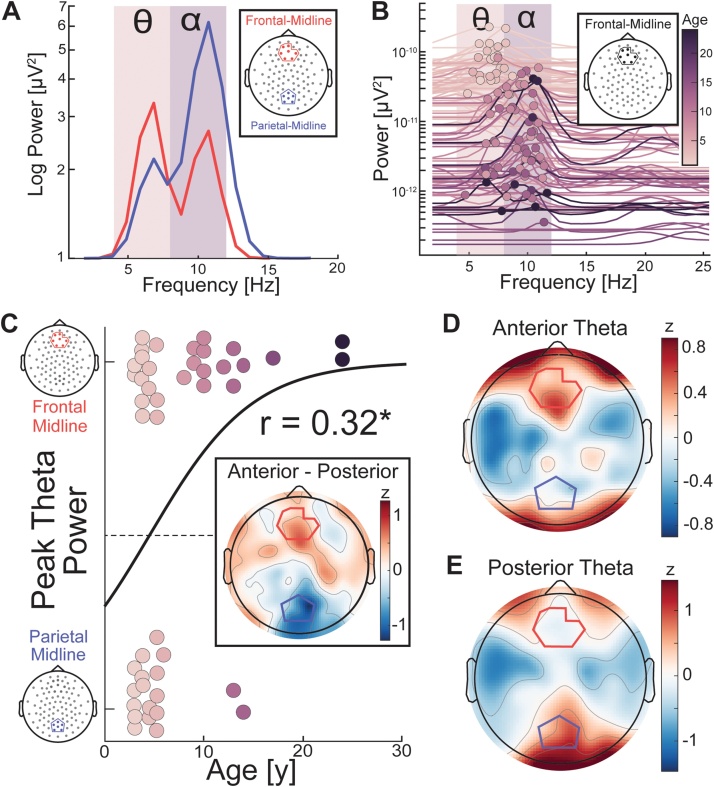
Intrinsic, unconstrained neural activity exhibits rich spatial, temporal, and spectral organization that undergoes continuous refinement from childhood through adolescence. The goal of this study was to investigate the development of theta (4-8 Hertz) and alpha (8-12 Hertz) oscillations from early childhood to adulthood (years 3-24), as these oscillations play a fundamental role in cognitive function. We analyzed eyes-open, resting-state EEG data from 96 participants to estimate genuine oscillations separately from the aperiodic (1/f) signal. We examined age-related differences in the aperiodic signal (slope and offset), as well as the peak frequency and power of the dominant posterior oscillation. For the aperiodic signal, we found that both the aperiodic slope and offset decreased with age. For the dominant oscillation, we found that peak frequency, but not power, increased with age. Critically, early childhood (ages 3-7) was characterized by a dominance of theta oscillations in posterior electrodes, whereas peak frequency of the dominant oscillation in the alpha range increased between ages 7 and 24. Furthermore, theta oscillations displayed a topographical transition from dominance in posterior electrodes in early childhood to anterior electrodes in adulthood. Our results provide a quantitative description of the development of theta and alpha oscillations.
Keywords: Alpha oscillations; Aperiodic signal; Development; EEG; Peak frequency; Theta oscillations.
Copyright © 2021 The Authors. Published by Elsevier Ltd.. All rights reserved.
Conflict of interest statement
The authors report no declarations of interest.
Figures
Similar articles
-
EEG power spectral slope differs by ADHD status and stimulant medication exposure in early childhood.J Neurophysiol. 2019 Dec 1;122(6):2427-2437. doi: 10.1152/jn.00388.2019. Epub 2019 Oct 16. J Neurophysiol. 2019. PMID: 31619109 Free PMC article.
-
Development of EEG alpha and theta oscillations in the maintenance stage of working memory.Biol Psychol. 2024 Sep;191:108824. doi: 10.1016/j.biopsycho.2024.108824. Epub 2024 May 31. Biol Psychol. 2024. PMID: 38823572
-
Oscillatory and Aperiodic Contributions to EEG Event-Related Time-Frequency Metrics During Cognitive Control and Reinforcement Processing: A Registered Report.Psychophysiology. 2025 Jun;62(6):e70073. doi: 10.1111/psyp.70073. Psychophysiology. 2025. PMID: 40462561 Free PMC article.
-
EEG time-frequency dynamics of early cognitive control development.Dev Cogn Neurosci. 2025 Jun;73:101548. doi: 10.1016/j.dcn.2025.101548. Epub 2025 Mar 22. Dev Cogn Neurosci. 2025. PMID: 40179643 Free PMC article. Review.
-
EEG alpha and theta oscillations reflect cognitive and memory performance: a review and analysis.Brain Res Brain Res Rev. 1999 Apr;29(2-3):169-95. doi: 10.1016/s0165-0173(98)00056-3. Brain Res Brain Res Rev. 1999. PMID: 10209231 Review.
Cited by
-
Development of the Alpha Rhythm Is Linked to Visual White Matter Pathways and Visual Detection Performance.J Neurosci. 2024 Feb 7;44(6):e0684232023. doi: 10.1523/JNEUROSCI.0684-23.2023. J Neurosci. 2024. PMID: 38124006 Free PMC article.
-
Maximizing the potential of EEG as a developmental neuroscience tool.Dev Cogn Neurosci. 2023 Apr;60:101201. doi: 10.1016/j.dcn.2023.101201. Epub 2023 Jan 27. Dev Cogn Neurosci. 2023. PMID: 36732112 Free PMC article. No abstract available.
-
Oscillatory But Not Aperiodic Frontal Brain Activity Predicts the Development of Executive Control From Infancy to Toddlerhood.Dev Sci. 2025 Mar;28(2):e13613. doi: 10.1111/desc.13613. Dev Sci. 2025. PMID: 39923184 Free PMC article.
-
Developmental changes in individual alpha frequency: Recording EEG data during public engagement events.Imaging Neurosci (Camb). 2023 Aug 10;1:1-14. doi: 10.1162/imag_a_00001. eCollection 2023 Aug 1. Imaging Neurosci (Camb). 2023. PMID: 37719836 Free PMC article.
-
Age-related trends in aperiodic EEG activity and alpha oscillations during early- to middle-childhood.Neuroimage. 2023 Apr 1;269:119925. doi: 10.1016/j.neuroimage.2023.119925. Epub 2023 Feb 3. Neuroimage. 2023. PMID: 36739102 Free PMC article.
References
-
- Baltes P.B. Longitudinal and cross-sectional sequences in the study of age and generation effects. Hum. Dev. 1968:145–171. - PubMed
-
- Barriga-Paulino C.I., Flores A.B., Gómez C.M. Developmental changes in the EEG rhythms of children and young adults: analyzed by means of correlational, brain topography and principal component analysis. J. Psychophysiol. 2011;25(3):143.
Publication types
MeSH terms
Grants and funding
LinkOut - more resources
Full Text Sources
