

Duchenne's muscular dystrophy involves a defective transsulfuration pathway activity
- PMID: 34174560
- PMCID: PMC8246642
- DOI: 10.1016/j.redox.2021.102040
Duchenne's muscular dystrophy involves a defective transsulfuration pathway activity
Abstract
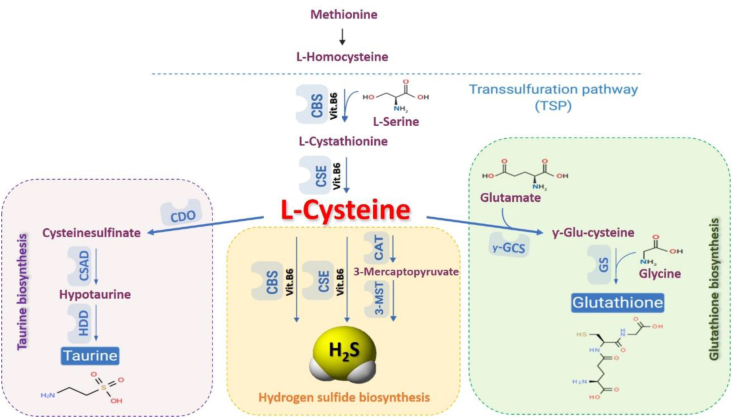
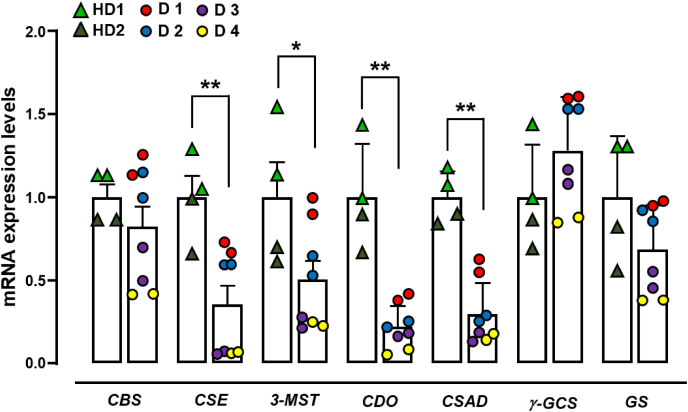
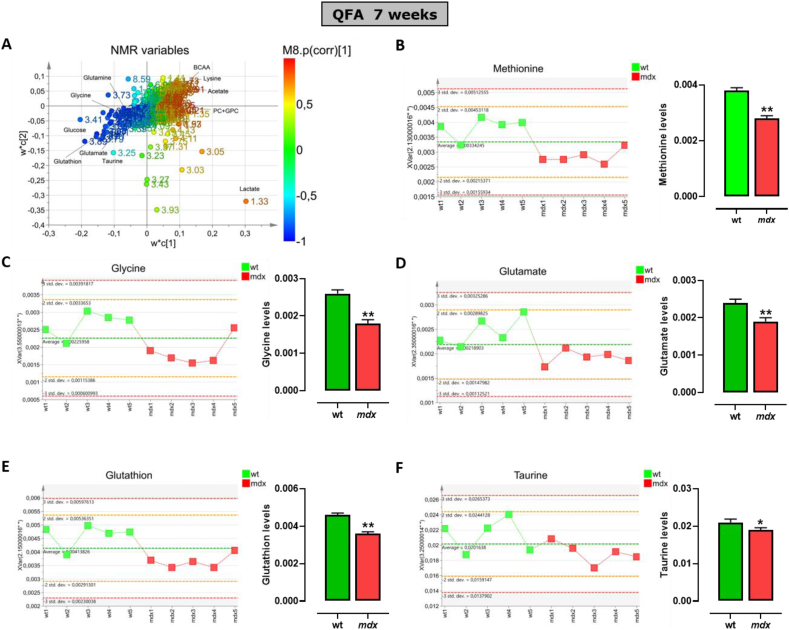
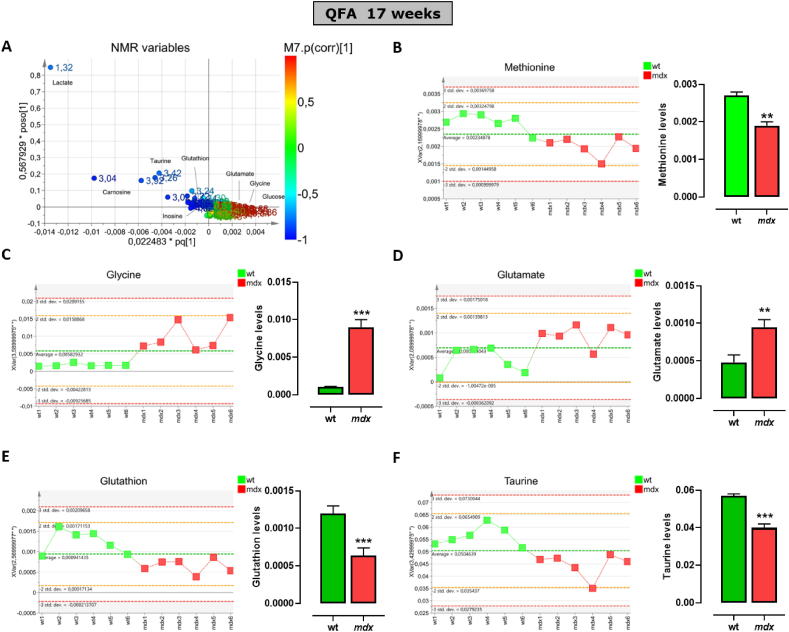
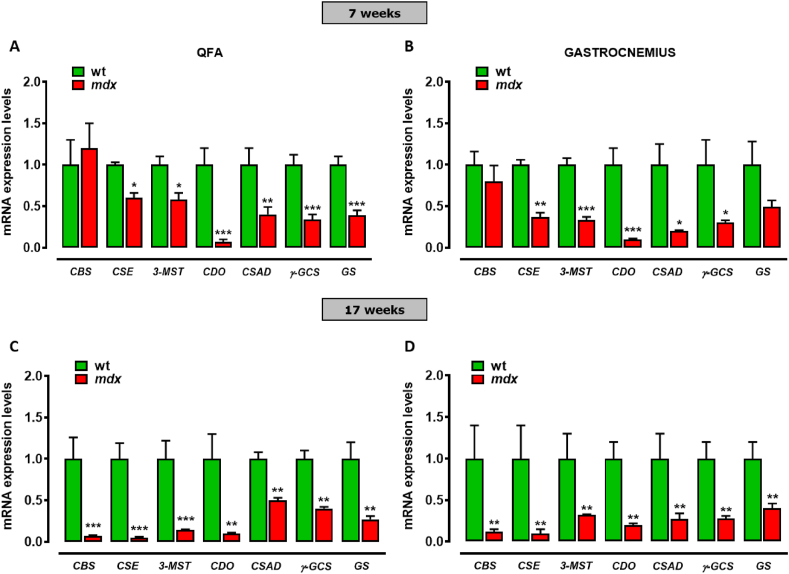
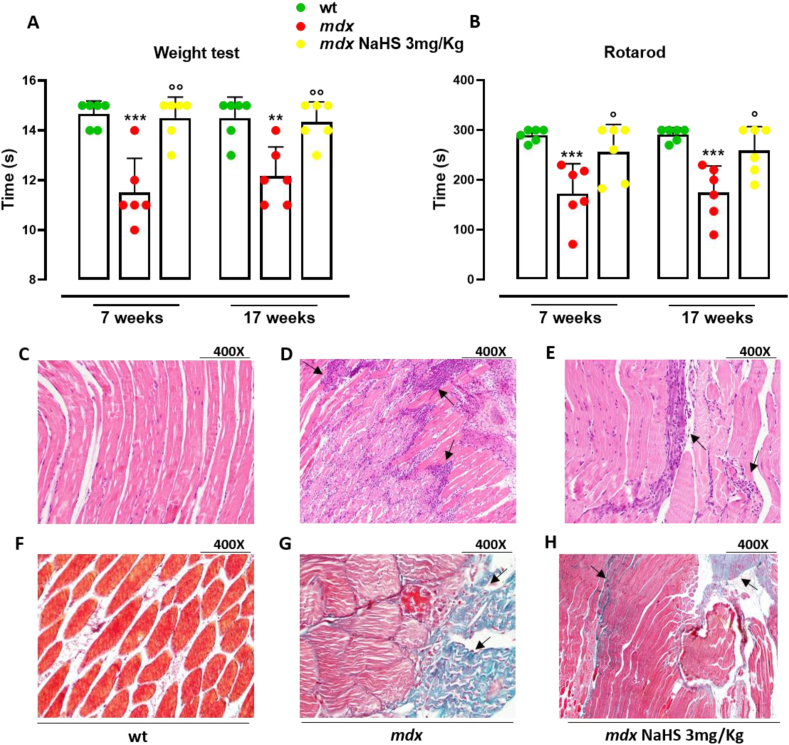
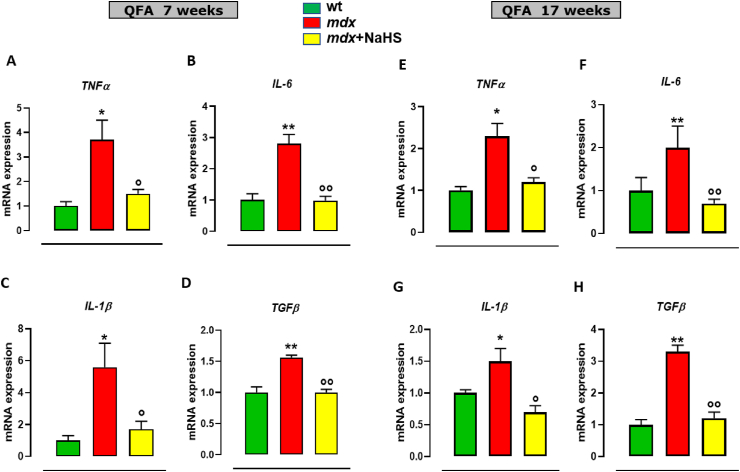
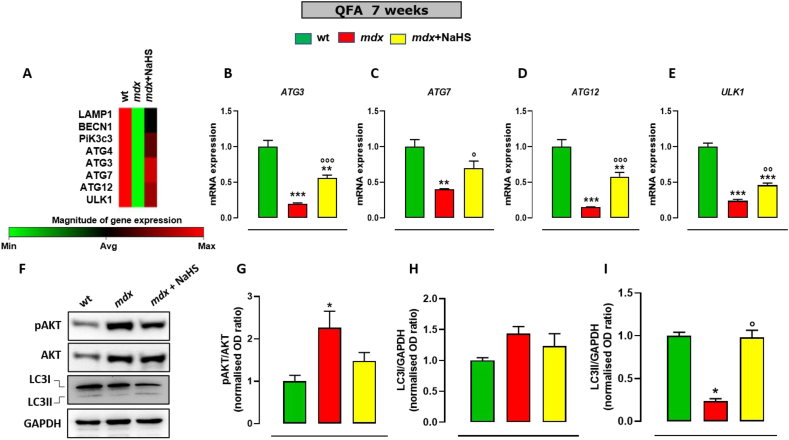
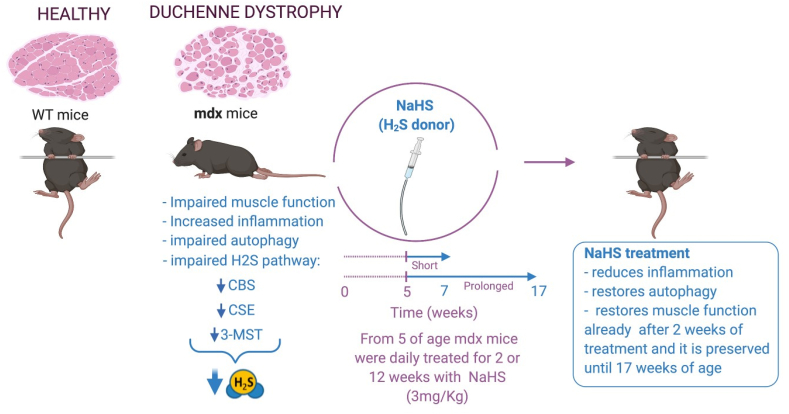
Duchenne muscular dystrophy (DMD) is the most frequent X chromosome-linked disease caused by mutations in the gene encoding for dystrophin, leading to progressive and unstoppable degeneration of skeletal muscle tissues. Despite recent advances in the understanding of the molecular processes involved in the pathogenesis of DMD, there is still no cure. In this study, we aim at investigating the potential involvement of the transsulfuration pathway (TSP), and its by-end product namely hydrogen sulfide (H2S), in primary human myoblasts isolated from DMD donors and skeletal muscles of dystrophic (mdx) mice. In myoblasts of DMD donors, we demonstrate that the expression of key genes regulating the H2S production and TSP activity, including cystathionine γ lyase (CSE), cystathionine beta-synthase (CBS), 3 mercaptopyruvate sulfurtransferase (3-MST), cysteine dioxygenase (CDO), cysteine sulfonic acid decarboxylase (CSAD), glutathione synthase (GS) and γ -glutamylcysteine synthetase (γ-GCS) is reduced. Starting from these findings, using Nuclear Magnetic Resonance (NMR) and quantitative Polymerase Chain Reaction (qPCR) we show that the levels of TSP-related metabolites such as methionine, glycine, glutathione, glutamate and taurine, as well as the expression levels of the aforementioned TSP related genes, are significantly reduced in skeletal muscles of mdx mice compared to healthy controls, at both an early (7 weeks) and overt (17 weeks) stage of the disease. Importantly, the treatment with sodium hydrosulfide (NaHS), a commonly used H2S donor, fully recovers the impaired locomotor activity in both 7 and 17 old mdx mice. This is an effect attributable to the reduced expression of pro-inflammatory markers and restoration of autophagy in skeletal muscle tissues. In conclusion, our study uncovers a defective TSP pathway activity in DMD and highlights the role of H2S-donors for novel and safe adjuvant therapy to treat symptoms of DMD.
Keywords: Autophagy; Duchenne muscular dystrophy; H(2)S donors; Inflammation; Sodium hydrosulfide (NaHS).
Copyright © 2021 The Authors. Published by Elsevier B.V. All rights reserved.
Conflict of interest statement
The authors declare no conflict of interest.
Figures
Similar articles
-
Long-Term Protective Effect of Human Dystrophin Expressing Chimeric (DEC) Cell Therapy on Amelioration of Function of Cardiac, Respiratory and Skeletal Muscles in Duchenne Muscular Dystrophy.Stem Cell Rev Rep. 2022 Dec;18(8):2872-2892. doi: 10.1007/s12015-022-10384-2. Epub 2022 May 19. Stem Cell Rev Rep. 2022. PMID: 35590083 Free PMC article.
-
Alterations in Notch signalling in skeletal muscles from mdx and dko dystrophic mice and patients with Duchenne muscular dystrophy.Exp Physiol. 2014 Apr;99(4):675-87. doi: 10.1113/expphysiol.2013.077255. Epub 2014 Jan 17. Exp Physiol. 2014. PMID: 24443351
-
Sodium hydrosulfide moderately alleviates the hallmark symptoms of Duchenne muscular dystrophy in mdx mice.Eur J Pharmacol. 2023 Sep 15;955:175928. doi: 10.1016/j.ejphar.2023.175928. Epub 2023 Jul 26. Eur J Pharmacol. 2023. PMID: 37507045
-
Hydrogen sulfide as a therapeutic option for the treatment of Duchenne muscular dystrophy and other muscle-related diseases.Cell Mol Life Sci. 2022 Nov 28;79(12):608. doi: 10.1007/s00018-022-04636-0. Cell Mol Life Sci. 2022. PMID: 36441348 Free PMC article. Review.
-
Transsulfuration pathway: a targeting neuromodulator in Parkinson's disease.Rev Neurosci. 2023 Jul 7;34(8):915-932. doi: 10.1515/revneuro-2023-0039. Print 2023 Dec 15. Rev Neurosci. 2023. PMID: 37409540 Review.
Cited by
-
Dysregulated Autophagy and Mitophagy in a Mouse Model of Duchenne Muscular Dystrophy Remain Unchanged Following Heme Oxygenase-1 Knockout.Int J Mol Sci. 2021 Dec 31;23(1):470. doi: 10.3390/ijms23010470. Int J Mol Sci. 2021. PMID: 35008897 Free PMC article.
-
Beneficial Effect of H2S-Releasing Molecules in an In Vitro Model of Sarcopenia: Relevance of Glucoraphanin.Int J Mol Sci. 2022 May 25;23(11):5955. doi: 10.3390/ijms23115955. Int J Mol Sci. 2022. PMID: 35682634 Free PMC article.
-
The Potential Implications of Hydrogen Sulfide in Aging and Age-Related Diseases through the Lens of Mitohormesis.Antioxidants (Basel). 2022 Aug 20;11(8):1619. doi: 10.3390/antiox11081619. Antioxidants (Basel). 2022. PMID: 36009338 Free PMC article. Review.
-
Mitochondrial Transplantation Therapy Ameliorates Muscular Dystrophy in mdx Mouse Model.Biomolecules. 2024 Mar 7;14(3):316. doi: 10.3390/biom14030316. Biomolecules. 2024. PMID: 38540736 Free PMC article.
-
Cardioprotective Effects of Hydrogen Sulfide and Its Potential Therapeutic Implications in the Amelioration of Duchenne Muscular Dystrophy Cardiomyopathy.Cells. 2024 Jan 15;13(2):158. doi: 10.3390/cells13020158. Cells. 2024. PMID: 38247849 Free PMC article. Review.
References
-
- Ehmsen J., Poon E., Davies K. The dystrophin-associated protein complex. J. Cell Sci. 2002;115:2801–2803. - PubMed
Publication types
MeSH terms
Substances
LinkOut - more resources
Full Text Sources
Molecular Biology Databases
Miscellaneous
