. 2021 Jun 26;22(1):476.
doi: 10.1186/s12864-021-07781-1.

LABRAT reveals association of alternative polyadenylation with transcript localization, RNA binding protein expression, transcription speed, and cancer survival

Affiliations

LABRAT reveals association of alternative polyadenylation with transcript localization, RNA binding protein expression, transcription speed, and cancer survival

Raeann Goering et al. BMC Genomics. .

Abstract

Background: The sequence content of the 3' UTRs of many mRNA transcripts is regulated through alternative polyadenylation (APA). The study of this process using RNAseq data, though, has been historically challenging.

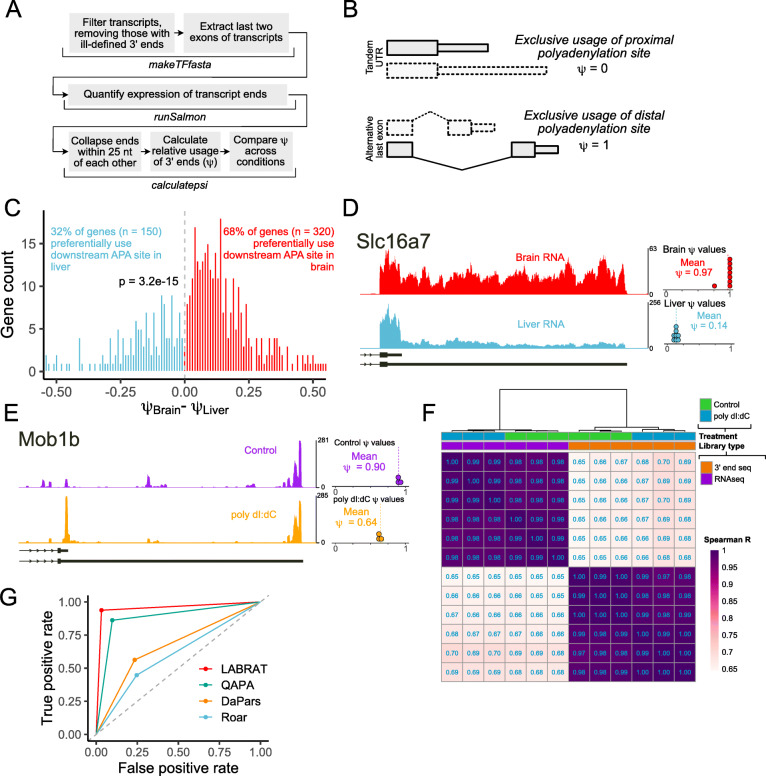
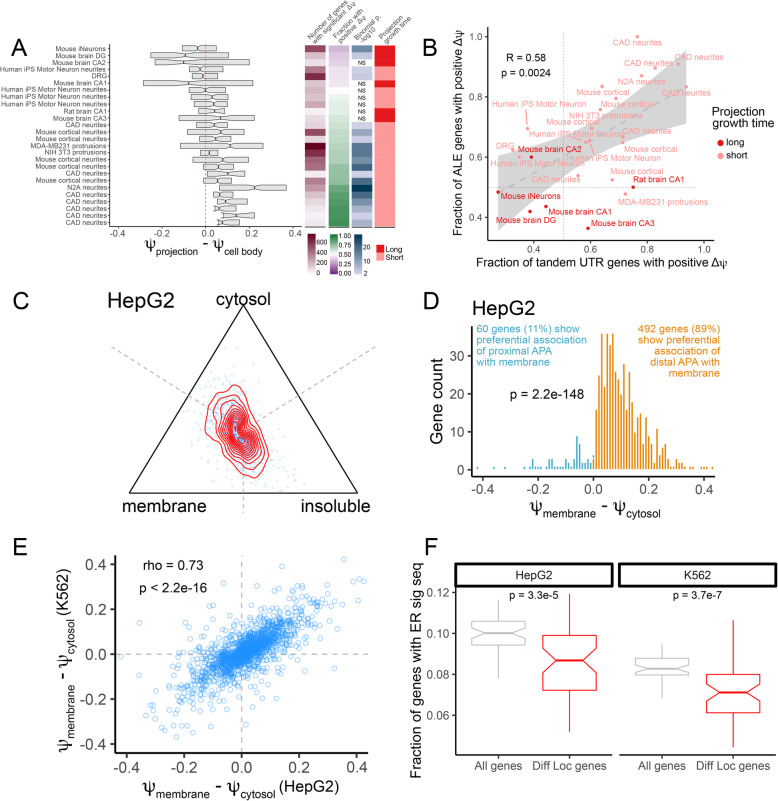
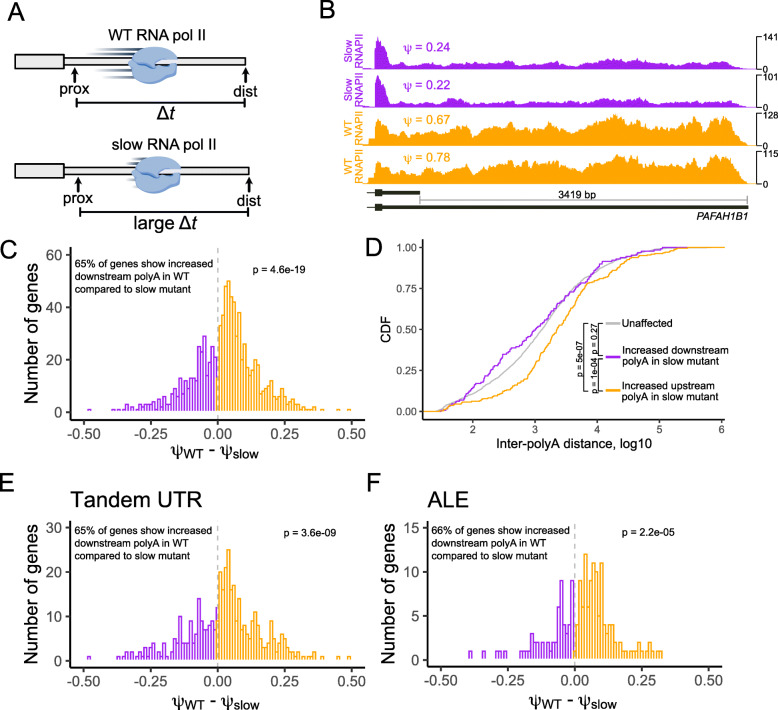
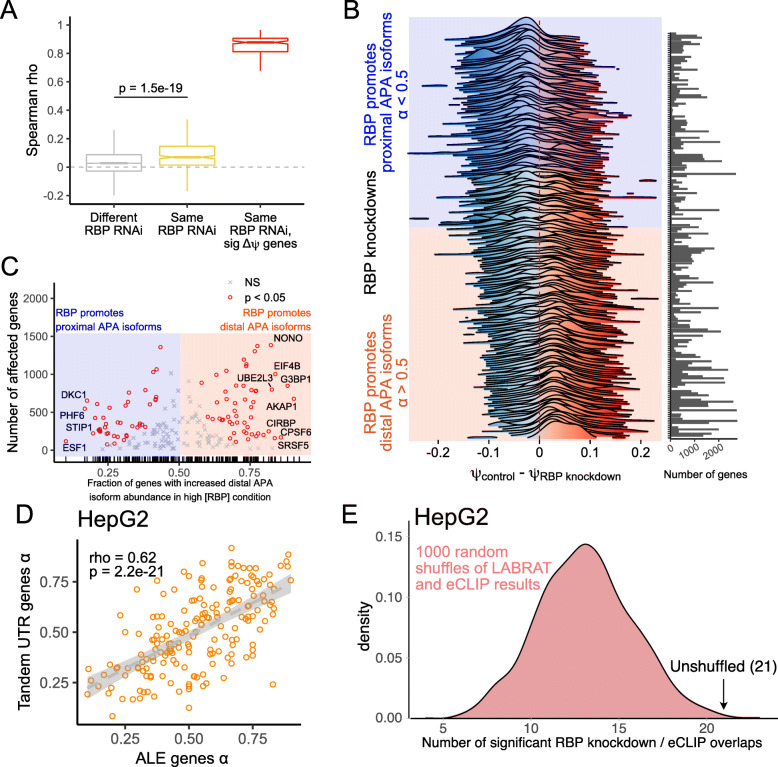
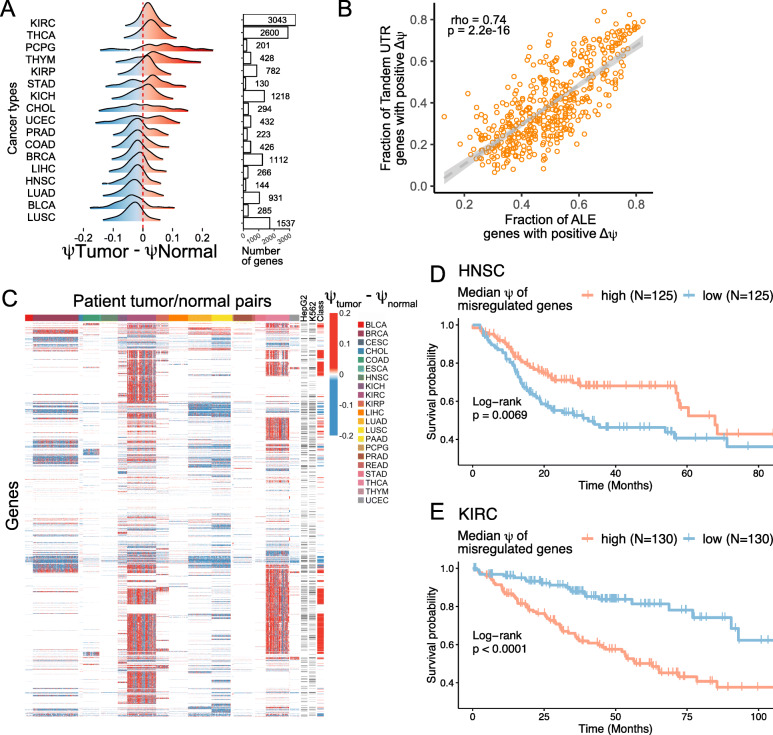
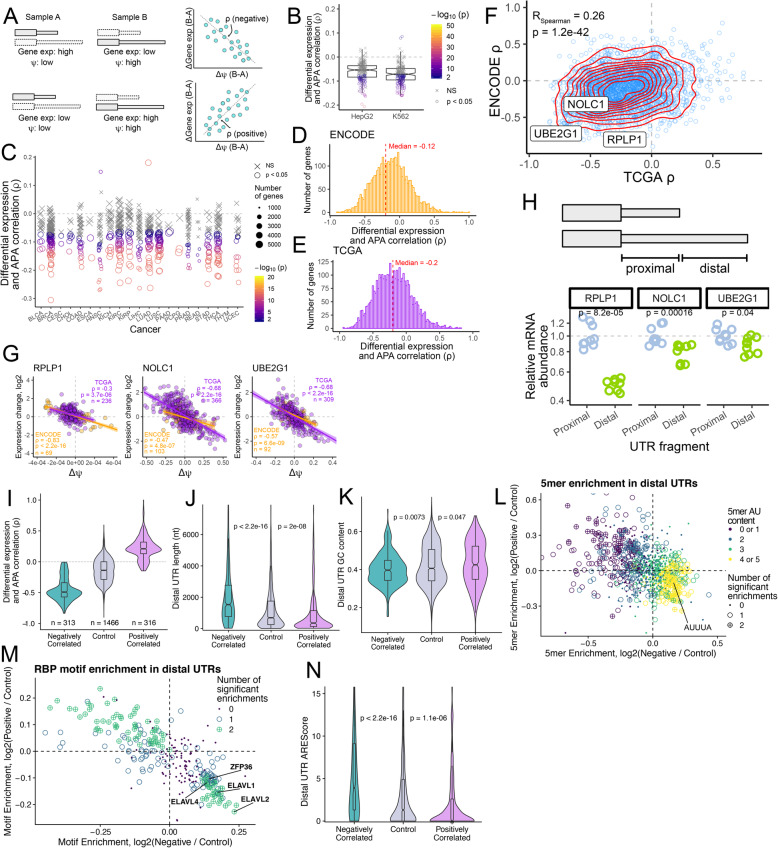
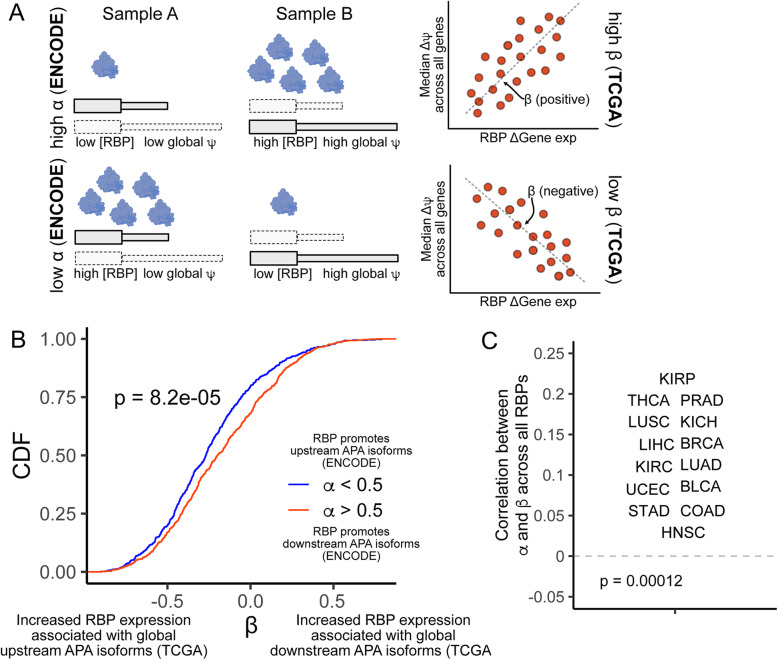
Results: To combat this problem, we developed LABRAT, an APA isoform quantification method. LABRAT takes advantage of newly developed transcriptome quantification techniques to accurately determine relative APA site usage and how it varies across conditions. Using LABRAT, we found consistent relationships between gene-distal APA and subcellular RNA localization in multiple cell types. We also observed connections between transcription speed and APA site choice as well as tumor-specific transcriptome-wide shifts in APA isoform abundance in hundreds of patient-derived tumor samples that were associated with patient prognosis. We investigated the effects of APA on transcript expression and found a weak overall relationship, although many individual genes showed strong correlations between relative APA isoform abundance and overall gene expression. We interrogated the roles of 191 RNA-binding proteins in the regulation of APA isoforms, finding that dozens promote broad, directional shifts in relative APA isoform abundance both in vitro and in patient-derived samples. Finally, we find that APA site shifts in the two classes of APA, tandem UTRs and alternative last exons, are strongly correlated across many contexts, suggesting that they are coregulated.

Conclusions: We conclude that LABRAT has the ability to accurately quantify APA isoform ratios from RNAseq data across a variety of sample types. Further, LABRAT is able to derive biologically meaningful insights that connect APA isoform regulation to cellular and molecular phenotypes.


Conflict of interest statement

None.

Figures

Fig. 1
Fig. 1
Quantifying changes in alternative polyadenylation with LABRAT. (A) LABRAT computational pipeline. (B) Explanation of ψ as a metric of polyadenylation site choice. Genes that exclusively use upstream or gene-proximal sites have ψ values of 0 while those that exclusively use downstream or gene-distal sites have ψ values of 1. The two transcript structures associated with alternative polyadenylation, tandem UTRs and alternative last exons, are diagrammed. (C) Comparison of ψ values in mouse brain and liver RNA for genes whose ψ value was significantly different between these tissues. (D) RNA coverage profiles of a gene with differential polyadenylation site usage in mouse brain and liver tissues. Dots represent ψ values calculated in each of 8 replicates. (E) RNA coverage profile of a gene with differential polyadenylation site usage in control PBMCs and those treated with poly dI:dC. RNA from these cells was profiled using 3′ end sequencing. Dots represent ψ values calculated in each of 3 replicates. (F) Comparison of ψ values between RNA samples profiled using standard RNAseq libraries (purple) and 3′ end sequencing libraries (orange). RNAseq samples were quantified by supplying ‘RNAseq’ as the ‘librarytype’ parameter for LABRAT while 3′ end sequencing libraries were quantified by supplying ‘3pseq’ as the ‘librarytype’ parameter. (G) Benchmarking of LABRAT performance against other widely used software package for quantification of alternative polyadenylation from RNAseq data
Fig. 2
Fig. 2
Alternative polyadenylation is associated with RNA localization in a variety of cell types. (A) Comparison of ψ values for RNA isolated from cell projections and cell bodies. ψ values for all genes were calculated using RNA collected from cell projection and cell body compartments, and genes with significantly different ψ values across compartments were identified (FDR < 0.05). Δψ values (cell projection - cell body) for these genes are indicated by boxplots. P values in blue represent binomial p values for deviations from the expected 50% chance for a gene to have a positive Δψ value. Samples were also separated according to the amount of time that projections were allowed to grow before their RNA content was analyzed. This is represented by the long (at least 6 days) and short (2 days or less) categories colored in red. (B) As in A, ψ values for all genes were calculated using RNA collected from cell projection and cell body compartments, and genes with significantly different ψ values across compartments were identified (FDR < 0.05). The fraction of significant tandem UTR and ALE genes with positive Δψ values were plotted on the x and y axes, respectively. (C) Simplex plot indicating ψ values calculated from RNA isolated from biochemically defined cytosolic, membrane-associated, and insoluble fractions of HepG2 cells. Genes with equal ψ values in all three fractions are represented by dots equidistant from each vertex (at the intersection of the dotted lines). Genes that displayed higher ψ values in a given fraction than the others are represented by dots placed closer to that fraction’s vertex. Red lines indicate the density of dots. (D) Comparison of ψ values in HepG2 cytosolic and membrane fractions for genes whose ψ value was significantly different between these compartments (FDR < 0.01). (E) Correlation of Δψ values (membrane - cytosol) for all genes expressed in both HepG2 and K562 cells. (F) Fraction of genes with nonsignificant Δψ values (membrane vs. cytosol, gray) and those with significant Δψ values (red) that encode peptides that have ER signal sequences as defined by SignalP. Distributions of this fraction were created through bootstrapping in which 40% of the genes were sampled 100 times. P values were calculated using a Wilcoxon rank sum test
Fig. 3
Fig. 3
The speed of RNA polymerase II influences APA. (A) Model for how polymerase speed can affect alternative polyadenylation. During the time between transcription of proximal and distal polyadenylation sites, the proximal site can be recognized and used but the proximal site cannot. Increasing this time of proximal site exclusivity by decreasing the speed of RNA polymerase may increase the likelihood of the proximal site being used. (B) Read coverage and ψ values for the gene PAFAH1B1 in cells expressing wildtype (orange) and slow (purple) RNA polymerase II. (C) Comparison of ψ values in cells expressing wildtype and slow RNA polymerase II for genes whose ψ value was significantly different between these samples (FDR < 0.05). (D) Distance between alternative polyadenylation sites for genes that displayed increased upstream APA (orange), increased downstream APA (purple), or whose APA did not change (gray) in cells expressing a slow RNA polymerase II compared to cells expressing wildtype RNA polymerase II. (E-F) As in D, comparison of ψ values in cells expressing wildtype and slow RNA polymerase II for tandem UTR (E) and ALE (F) genes whose ψ value was significantly different between these samples (FDR < 0.05)
Fig. 4
Fig. 4
Many RBPs promote proximal or distal APA isoform abundance in hundreds of genes. (A) Correlation of all ψ values across HepG2 and K562 cell lines for all ENCODE RBP-knockdown RNAseq experiments. In gray, correlation coefficients for comparisons of different RBP knockdowns are shown (e.g. RBP X in HepG2 vs. RBP Y in K562). In yellow, correlation coefficients for comparisons of the same RBP knockdown are shown (e.g. RBP X in HepG2 vs RBP X in K562). In red, this comparison is restricted to only those genes whose ψ value significantly differed between the RBP knockdown and control knockdown samples (e.g. RBP X in HepG2 vs RBP X in K562, significant Δψ genes only). In identification of these significant genes, the cell line was included as a covariate. (B) Comparison of ψ values in RBP knockdown and control samples for genes whose ψ value was significantly different between these samples (FDR < 0.05). The number of genes with significant Δψ values in each comparison is indicated by the bar graph. A term, α, was defined as the fraction of these genes that displayed higher ψ values in the high RBP state (control knockdown) versus the low RBP state (RBP knockdown). (C) For each RBP knockdown, the number of genes with significant Δψ values (FDR < 0.05) is indicated on the y axis while the fraction of these genes with positive Δψ values (control knockdown - RBP knockdown) is indicated on the x axis. Knockdowns whose fraction of genes with positive Δψ values significantly differs from the expected 50% are indicated with red circles. (D) α values for each RBP knockdown in HepG2 cells were calculated using tandem UTR and ALE genes independently. These were then plotted and correlated. Each dot in this plot represents one RBP knockdown experiment. (E) Among 84 RBPs expressed in HepG2 cells, overlaps between the genes whose APA was sensitive to RBP knockdown and the genes whose 3′ UTRs were bound by the RBP in eCLIP experiments were calculated. The significance of this overlap was calculated using a binomial test. 21 RBPs bound the 3′ UTRs of their APA targets more often than expected (binomial p < 0.05). To assess whether this was more than the expected number of significant RBPs, relationships between RBPs and their lists of APA and eCLIP targets were shuffled 1000 times, and the analysis was repeated after each shuffle to create a null distribution (pink)
Fig. 5
Fig. 5
Misregulation of alternative polyadenylation in primary tumors. (A) Comparison of ψ values in matched patient tumor and control samples for genes whose ψ value was significantly different between these samples (FDR < 0.05). The number of genes with significant Δψ values in each comparison is indicated by the bar graph. (B) As in A, ψ values for all genes were calculated in matched patient tumor and normal tissue samples, and genes with significantly different ψ values across samples within a cancer type were identified (FDR < 0.05). The fraction of significant tandem UTR and ALE genes with positive Δψ values were plotted on the x and y axes, respectively. Each dot represents one patient sample pair. (C) Genes with significantly different ψ values across samples within a cancer type (FDR < 0.05) are colored according to their Δψ value (tumor - control). Columns represent matched patient samples while rows represent genes. Black ticks (right) represent whether or not the gene displayed a significantly different ψ value (FDR < 0.05) between biochemically defined cytosolic and membrane-associated fractions in HepG2 and K562 cells (Fig. 2D). Genes were further separated into classes of those with increased ψ values in KIRC and THCA tumor samples (red ticks, right) and those with decreased ψ values in BRCA, LUAD and LUSC tumor samples (blue ticks, right). (D-E) Survival analysis for APA misregulation in head and neck squamous cell carcinoma and kidney renal clear cell carcinoma, respectively. Patients were grouped into extreme quartiles by ranked median ψ values for misregulated genes as defined in Fig. 5A for the respective tumors. In Fig. 5A, HNSC tumors were associated with decreased ψ values. Here, lower ψ values are associated with poor prognosis. Conversely, in Fig. 5A KIRC tumors were associated with increased ψ values, and here, increased ψ values are associated with poor prognosis
Fig. 6
Fig. 6
Comprehensive analyses of connections between alternative polyadenylation and transcript expression. (A) Diagram of correlation between APA and transcript expression. Rho (ρ) is defined as the correlation between changes in gene expression and changes in ψ value across two conditions. In the scenario described in the top row, the overall RNA expression level for the gene is high in sample A but low in sample B while the gene’s ψ value is low in sample A and high in sample B. Changes in gene expression and Δψ are therefore negatively correlated, giving ρ a negative value. Conversely, in the scenario described in the bottom row, changes in gene expression and ψ are positively correlated. (B) P values across all expressed genes within a comparison for the ENCODE RBP knockdown data. Each dot represents a single comparison (RBP knockdown vs control knockdown). P values for the correlation between gene expression and APA are indicated by dot shape and color. (C) P values across all expressed genes with a comparison for the TCGA paired tumor/control sample data. Each dot represents a single patient’s tumor and control samples. P values for the correlation between gene expression and APA are indicated by dot shape and color. (D) Gene-level ρ values across all ENCODE RBP knockdown experiments. (E) Gene-level ρ values across all TCGA tumor/control sample pairs. (F) Correlation of gene-level ρ values derived from the ENCODE and TCGA datasets (D and E). Red lines indicate the density of points, and the locations of three genes selected for further study are indicated by labels. (G) Correlation between gene expression changes and Δψ for three genes. Orange dots represent ENCODE sample pairs (RBP knockdown vs. control knockdown) while purple dots represent TCGA sample pairs (tumor vs. control samples). (H) Top: illustration of the UTR fragments fused to the Firefly luciferase gene. Bottom: RT-qPCR-derived relative levels of firefly luciferase mRNA expression when the proximal and distal UTR fragments of the indicated genes were fused. Values indicate ratios between the abundances of Firefly and Renilla luciferase mRNAs with this ratio in the proximal UTR comparison set to 1. P values were calculated using a Wilcoxon ranksum test. (I) Correlation between gene expression changes and Δψ was used to define positively correlated, negatively correlated and control genes with two APA isoforms. Correlations are calculated for ENCODE and TCGA separately. (J) Distal UTR lengths of each gene set. P values were calculated using a Wilcoxon ranksum test. (K) Distal UTR GC content of each gene set. P values were calculated using a Wilcoxon ranksum test. (L) Five-mer enrichments in the distal 3′ UTRs of positively and negatively correlated gene sets vs control. Five-mers are significantly enriched (BH-adjusted p < 0.05, Fisher’s exact test) in either both comparisons, one comparison or neither and are represented by a circle plus, open circle or closed dot respectively. Five-mers are colored by their AU content as ranked 0–5. Canonical AU rich element (ARE) “AUUUA” is highlighted as enriched in negatively correlated distal UTRs. (M) RBP motif enrichments in the distal 3′ UTRs of positively and negatively correlated gene sets vs control. RBP motifs are significantly enriched (BH-adjusted p < 0.05, Fisher’s exact test) in either both comparisons, one comparison or neither and are represented by a green circle plus, blue open circle or purple dot respectively. Canonical ARE binding protein motifs are highlighted as enriched in negatively correlated distal UTRs. (N) Distal UTR AREScores of each gene set as calculated by AREScore software. P values were calculated using a Wilcoxon ranksum test
Fig. 7
Fig. 7
APA is regulated by RBP expression in ENCODE and TCGA data. (A) Diagram depicting connections between changes in RBP expression between condition and widespread, global in changes in ψ. Left: In Fig. 4, RBPs were assigned a value, α, based on the effect that their knockdown had on the Δψ values for all genes. α was defined as the fraction of genes that displayed increased ψ values in control knockdown samples compared to RBP knockdown samples. The expression of RBPs with high α values was therefore associated with increased ψ values transcriptome-wide (top) while expression of RBPs with low α values was correlated with decreased ψ values transcriptome-wide (bottom). Similar RBP effects were calculated in TCGA data (right) by comparing the change in RBP expression between two matched samples with transcriptome-wide changes in values. A value, β, was defined as the correlation between changes in RBP expression and the median Δψ across all genes with significant Δψ values (FDR < 0.05). α and β are therefore comparable in relating RBP expression and transcriptome wide changes in with the former designed for ENCODE RBP knockdown data and the latter designed for TCGA paired sample data. (B) β values for RBPs with low α values (α < 0.5, blue) and high α values (a > 0.5, red). Here, an RBP’s β value considers the correlation between its expression and global ψ across all TCGA sample pairs. The p value was calculated using a Wilcoxon ranksum test. (C) Correlation between α and β values across all RBPs for all TCGA sample pairs, separated by cancer type. The p value was calculated using a binomial test for deviation from the expected 0.5 probability that a cancer’s correlation between α and β would be positive

References

    1. Shi Y, Di Giammartino DC, Taylor D, Sarkeshik A, Rice WJ, Yates JR, 3rd, et al. Molecular architecture of the human pre-mRNA 3′ processing complex. Mol Cell. 2009;33(3):365–376. doi: 10.1016/j.molcel.2008.12.028. - DOI - PMC - PubMed
    1. Beilharz TH, Preiss T. Widespread use of poly(a) tail length control to accentuate expression of the yeast transcriptome. RNA. 2007;13(7):982–997. doi: 10.1261/rna.569407. - DOI - PMC - PubMed
    1. Derti A, Garrett-Engele P, Macisaac KD, Stevens RC, Sriram S, Chen R, et al. A quantitative atlas of polyadenylation in five mammals. Genome Res. 2012;22(6):1173–1183. doi: 10.1101/gr.132563.111. - DOI - PMC - PubMed
    1. Wu X, Liu M, Downie B, Liang C, Ji G, Li QQ, Hunt AG. Genome-wide landscape of polyadenylation in Arabidopsis provides evidence for extensive alternative polyadenylation. Proc Natl Acad Sci U S A. 2011;108(30):12533–12538. doi: 10.1073/pnas.1019732108. - DOI - PMC - PubMed
    1. Sherstnev A, Duc C, Cole C, Zacharaki V, Hornyik C, Ozsolak F, Milos PM, Barton GJ, Simpson GG. Direct sequencing of Arabidopsis thaliana RNA reveals patterns of cleavage and polyadenylation. Nat Struct Mol Biol. 2012;19(8):845–852. doi: 10.1038/nsmb.2345. - DOI - PMC - PubMed