

UniBind: maps of high-confidence direct TF-DNA interactions across nine species
- PMID: 34174819
- PMCID: PMC8236138
- DOI: 10.1186/s12864-021-07760-6
UniBind: maps of high-confidence direct TF-DNA interactions across nine species
Abstract
Background: Transcription factors (TFs) bind specifically to TF binding sites (TFBSs) at cis-regulatory regions to control transcription. It is critical to locate these TF-DNA interactions to understand transcriptional regulation. Efforts to predict bona fide TFBSs benefit from the availability of experimental data mapping DNA binding regions of TFs (chromatin immunoprecipitation followed by sequencing - ChIP-seq).
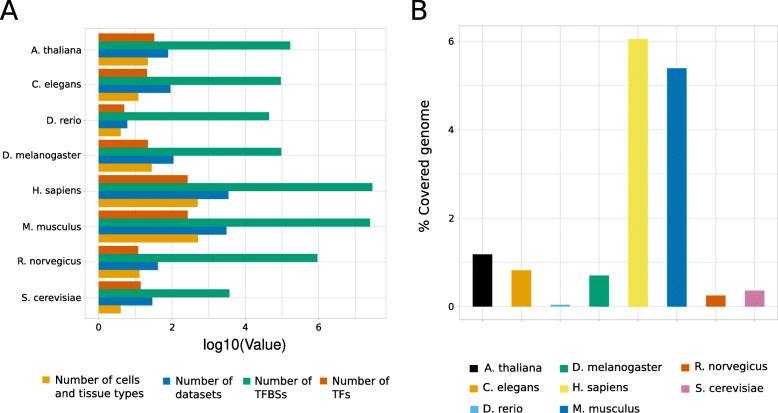
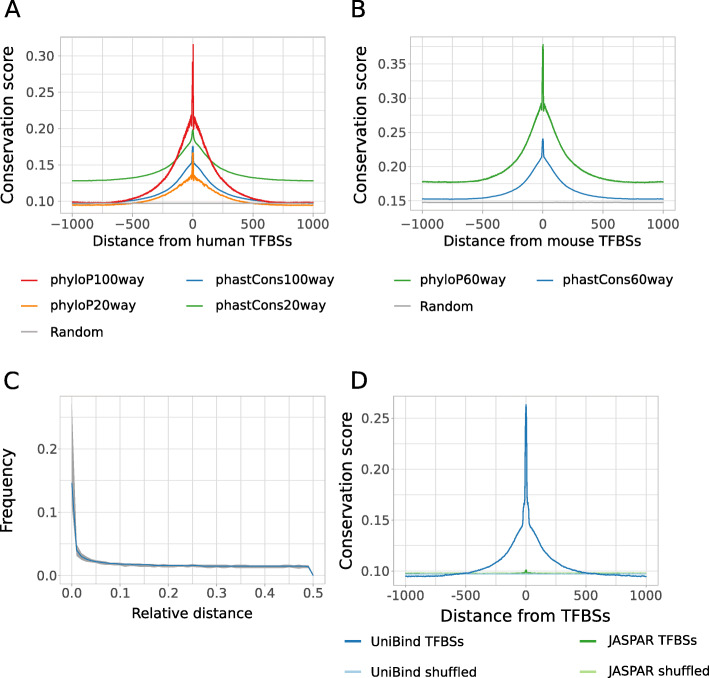
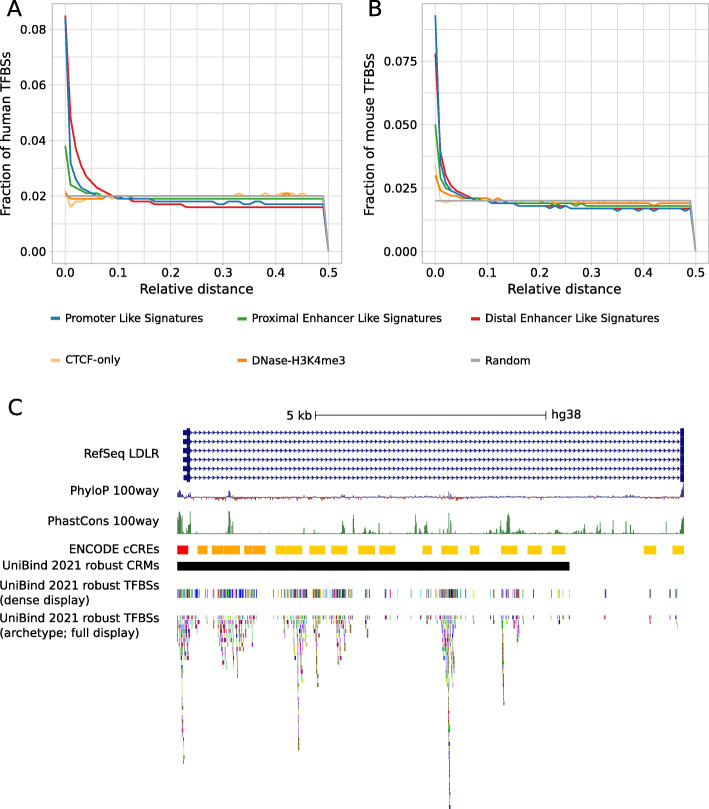
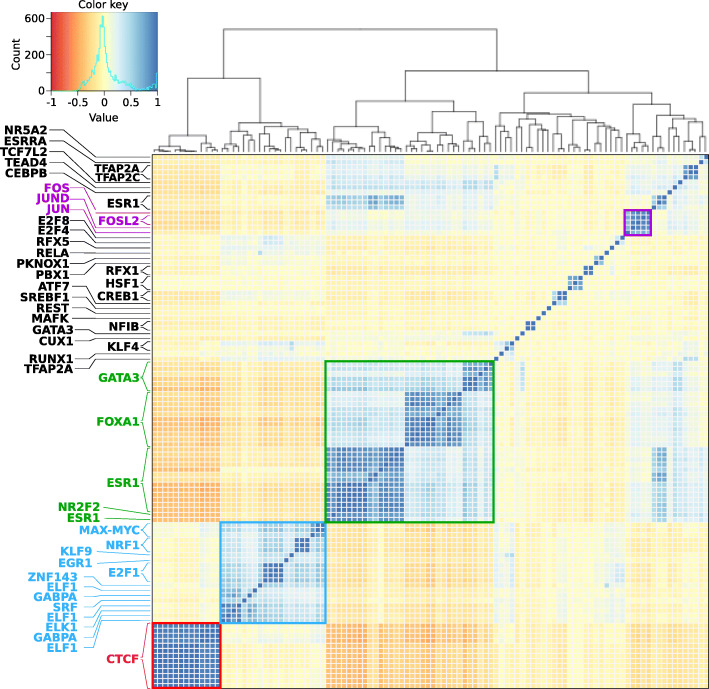
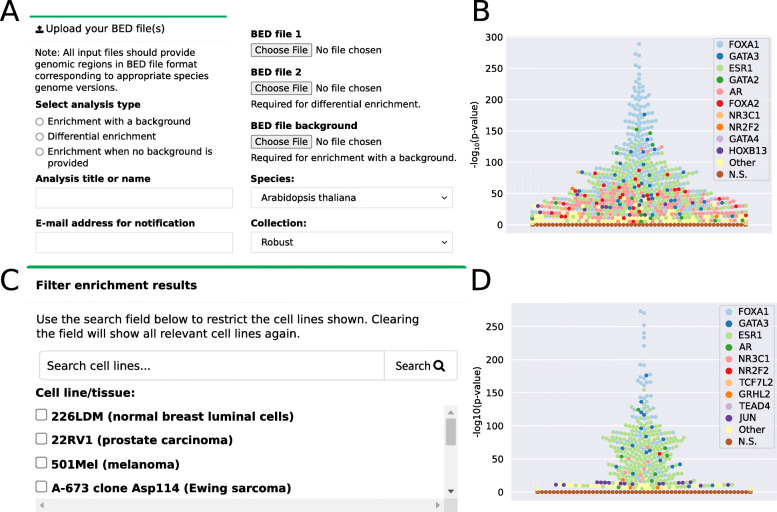
Results: In this study, we processed ~ 10,000 public ChIP-seq datasets from nine species to provide high-quality TFBS predictions. After quality control, it culminated with the prediction of ~ 56 million TFBSs with experimental and computational support for direct TF-DNA interactions for 644 TFs in > 1000 cell lines and tissues. These TFBSs were used to predict > 197,000 cis-regulatory modules representing clusters of binding events in the corresponding genomes. The high-quality of the TFBSs was reinforced by their evolutionary conservation, enrichment at active cis-regulatory regions, and capacity to predict combinatorial binding of TFs. Further, we confirmed that the cell type and tissue specificity of enhancer activity was correlated with the number of TFs with binding sites predicted in these regions. All the data is provided to the community through the UniBind database that can be accessed through its web-interface ( https://unibind.uio.no/ ), a dedicated RESTful API, and as genomic tracks. Finally, we provide an enrichment tool, available as a web-service and an R package, for users to find TFs with enriched TFBSs in a set of provided genomic regions.
Conclusions: UniBind is the first resource of its kind, providing the largest collection of high-confidence direct TF-DNA interactions in nine species.
Keywords: ChIP-seq; Cis-regulatory modules; Evolutionary conservation; TF-DNA interactions; Transcription factor binding sites; Transcription regulation; UniBind.
Conflict of interest statement
None declared.
Figures


Similar articles
-
A map of direct TF-DNA interactions in the human genome.Nucleic Acids Res. 2019 Feb 28;47(4):e21. doi: 10.1093/nar/gky1210. Nucleic Acids Res. 2019. PMID: 30517703 Free PMC article.
-
CacPred: a cascaded convolutional neural network for TF-DNA binding prediction.BMC Genomics. 2025 Mar 18;26(Suppl 2):264. doi: 10.1186/s12864-025-11399-y. BMC Genomics. 2025. PMID: 40102719 Free PMC article.
-
The next generation of transcription factor binding site prediction.PLoS Comput Biol. 2013;9(9):e1003214. doi: 10.1371/journal.pcbi.1003214. Epub 2013 Sep 5. PLoS Comput Biol. 2013. PMID: 24039567 Free PMC article.
-
Towards a better understanding of TF-DNA binding prediction from genomic features.Comput Biol Med. 2022 Oct;149:105993. doi: 10.1016/j.compbiomed.2022.105993. Epub 2022 Aug 17. Comput Biol Med. 2022. PMID: 36057196 Review.
-
An algorithmic perspective of de novo cis-regulatory motif finding based on ChIP-seq data.Brief Bioinform. 2018 Sep 28;19(5):1069-1081. doi: 10.1093/bib/bbx026. Brief Bioinform. 2018. PMID: 28334268 Review.
Cited by
-
Non-coding variants impact cis-regulatory coordination in a cell type-specific manner.Genome Biol. 2024 Jul 18;25(1):190. doi: 10.1186/s13059-024-03333-4. Genome Biol. 2024. PMID: 39026229 Free PMC article.
-
A survey on algorithms to characterize transcription factor binding sites.Brief Bioinform. 2023 May 19;24(3):bbad156. doi: 10.1093/bib/bbad156. Brief Bioinform. 2023. PMID: 37099664 Free PMC article. Review.
-
A CHD8-TRRAP axis facilitates MYC and E2F target gene regulation in human neural stem cells.iScience. 2025 Feb 12;28(3):111978. doi: 10.1016/j.isci.2025.111978. eCollection 2025 Mar 21. iScience. 2025. PMID: 40104050 Free PMC article.
-
Characterization of an eye field-like state during optic vesicle organoid development.Development. 2023 Aug 1;150(15):dev201432. doi: 10.1242/dev.201432. Epub 2023 Aug 9. Development. 2023. PMID: 37306293 Free PMC article.
-
Crosstalk between microRNA expression and DNA methylation drives the hormone-dependent phenotype of breast cancer.Genome Med. 2021 Apr 29;13(1):72. doi: 10.1186/s13073-021-00880-4. Genome Med. 2021. PMID: 33926515 Free PMC article.
References
MeSH terms
Substances
LinkOut - more resources
Full Text Sources
Miscellaneous
