

Diagnostic performance of rapid antigen test for COVID-19 and the effect of viral load, sampling time, subject's clinical and laboratory parameters on test accuracy
- PMID: 34175237
- PMCID: PMC8192262
- DOI: 10.1016/j.jiph.2021.06.002
Diagnostic performance of rapid antigen test for COVID-19 and the effect of viral load, sampling time, subject's clinical and laboratory parameters on test accuracy
Abstract
Background: Egypt was among the first 10 countries in Africa that experienced COVID-19 cases. The sudden surge in the number of cases is overwhelming the capacity of the national healthcare system, particularly in developing countries. Central to the containment of the ongoing pandemic is the availability of rapid and accurate diagnostic tests that could pinpoint patients at early disease stages. In the current study, we aimed to (1) Evaluate the diagnostic performance of the rapid antigen test (RAT) "Standard™ Q COVID-19 Ag" against reverse transcriptase quantitative real-time PCR (RT-qPCR) in eighty-three swabs collected from COVID-19 suspected individuals showing various demographic features, clinical and radiological findings. (2) Test whether measuring laboratory parameters in participant's blood would enhance the predictive accuracy of RAT. (3) Identify the most important features that determine the results of both RAT and RT-qPCR.
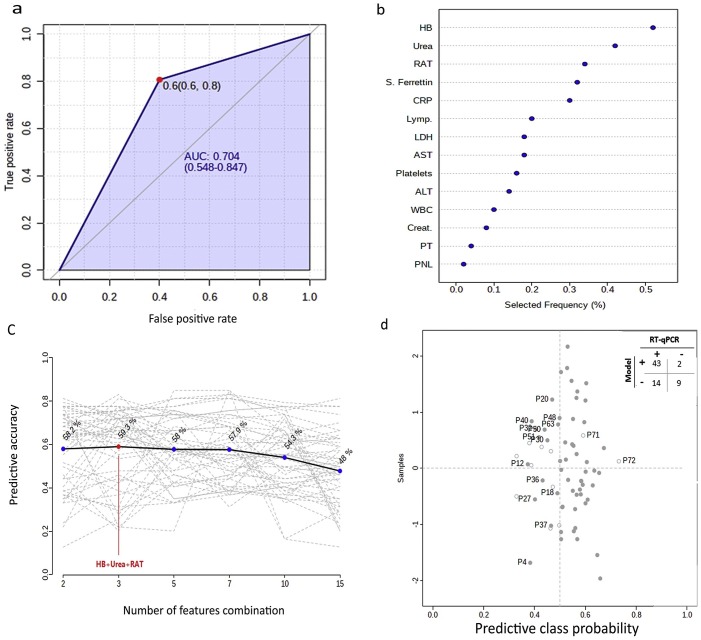
Methods: Diagnostic measurements (e.g. sensitivity, specificity, etc.) and receiver operating characteristic curve were used to assess the clinical performance of "Standard™ Q COVID-19 Ag". We used the support vector machine (SVM) model to investigate whether measuring laboratory indices would enhance the accuracy of RAT. Moreover, a random forest classification model was used to determine the most important determinants of the results of RAT and RT-qPCR for COVID-19 diagnosis.
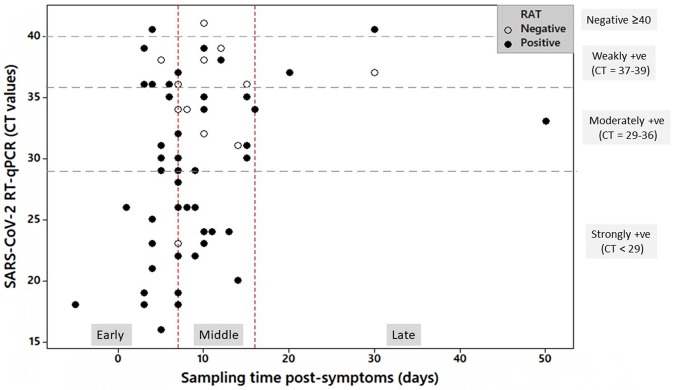
Results: The sensitivity, specificity, and accuracy of RAT were 78.2, 64.2, and 75.9%, respectively. Samples with high viral load and those that were collected within one-week post-symptoms showed the highest sensitivity and accuracy. The SVM modeling showed that measuring laboratory indices did not enhance the predictive accuracy of RAT.
Conclusion: "Standard™ Q COVID-19 Ag" should not be used alone for COVID-19 diagnosis due to its low diagnostic performance relative to the RT-qPCR. RAT is best used at the early disease stage and in patients with high viral load.
Keywords: Accuracy; Diagnosis; Rapid antigen test; SARS-CoV-2.
Copyright © 2021 The Author(s). Published by Elsevier Ltd.. All rights reserved.
Figures
References
-
- Akashi Y., Suzuki H., Ueda A., Hirose Y., Hayashi D., Imai H. Analytical and clinical evaluation of a point-of-care molecular diagnostic system and its influenza A/B assay for rapid molecular detection of the influenza virus. J Infect Chemother. 2019;25(8):578–583. doi: 10.1016/j.jiac.2019.02.022. - DOI - PubMed
-
- WHO (11 March 2020) Coronavirus diseases (COVID-19) global situation report-51.
-
- WHO (11 January 2020) COVID-19 global situation report.
MeSH terms
Substances
LinkOut - more resources
Full Text Sources
Medical
Miscellaneous
