

Translating glucose tolerance data from mice to humans: Insights from stable isotope labelled glucose tolerance tests
- PMID: 34175474
- PMCID: PMC8313600
- DOI: 10.1016/j.molmet.2021.101281
Translating glucose tolerance data from mice to humans: Insights from stable isotope labelled glucose tolerance tests
Abstract
Objective: The glucose tolerance test (GTT) is widely used in human and animal biomedical and pharmaceutical research. Despite its prevalent use, particularly in mouse metabolic phenotyping, to the best of our knowledge we are not aware of any studies that have attempted to qualitatively compare the metabolic events during a GTT in mice with those performed in humans.
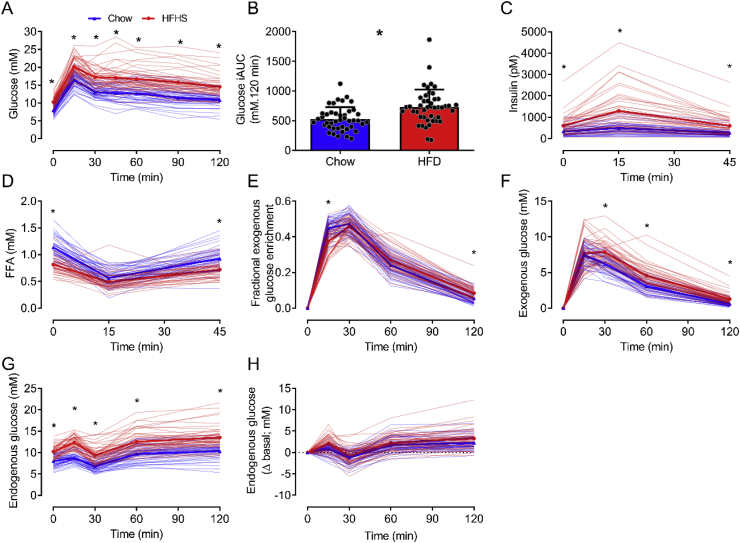
Methods: Stable isotope labelled oral glucose tolerance tests (siOGTTs; [6,6-2H2]glucose) were performed in both human and mouse cohorts to provide greater resolution into postprandial glucose kinetics. The siOGTT allows for the partitioning of circulating glucose into that derived from exogenous and endogenous sources. Young adults spanning the spectrum of normal glucose tolerance (n = 221), impaired fasting (n = 14), and impaired glucose tolerance (n = 19) underwent a 75g siOGTT, whereas a 50 mg siOGTT was performed on chow (n = 43) and high-fat high-sucrose fed C57Bl6 male mice (n = 46).
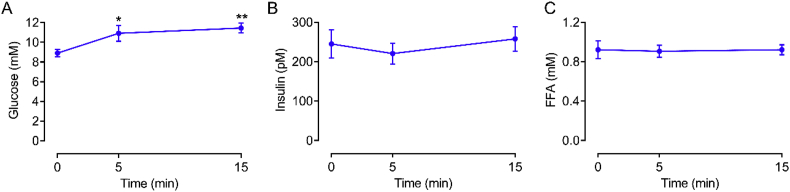
Results: During the siOGTT in humans, there is a long period (>3hr) of glucose absorption and, accordingly, a large, sustained insulin response and robust suppression of lipolysis and endogenous glucose production (EGP), even in the presence of glucose intolerance. In contrast, mice appear to be highly reliant on glucose effectiveness to clear exogenous glucose and experience only modest, transient insulin responses with little, if any, suppression of EGP. In addition to the impaired stimulation of glucose uptake, mice with the worst glucose tolerance appear to have a paradoxical and persistent rise in EGP during the OGTT, likely related to handling stress.
Conclusions: The metabolic response to the OGTT in mice and humans is highly divergent. The potential reasons for these differences and their impact on the interpretation of mouse glucose tolerance data and their translation to humans are discussed.
Keywords: Endogenous glucose production; Human; Mouse; OGTT; Stable isotope.
Copyright © 2021 The Author(s). Published by Elsevier GmbH.. All rights reserved.
Figures


References
-
- Kowalski G.M., Bruce C.R. The regulation of glucose metabolism: implications and considerations for the assessment of glucose homeostasis in rodents. American Journal of Physiology. Endocrinology and Metabolism. 2014;307:E859–E871. - PubMed
-
- Dube S., Errazuriz-Cruzat I., Basu A., Basu R. The forgotten role of glucose effectiveness in the regulation of glucose tolerance. Current Diabetes Reports. 2015;15:605. - PubMed
-
- Best J.D., Kahn S.E., Ader M., Watanabe R.M., Ni T.C., Bergman R.N. Role of glucose effectiveness in the determination of glucose tolerance. Diabetes Care. 1996;19:1018–1030. - PubMed
-
- Winzell M.S., Ahren B. The high-fat diet-fed mouse: a model for studying mechanisms and treatment of impaired glucose tolerance and type 2 diabetes. Diabetes. 2004;53(Suppl 3):S215–S219. - PubMed
Publication types
MeSH terms
Substances
LinkOut - more resources
Full Text Sources
