. 2022 Mar 2;61(3):1092-1105.
doi: 10.1093/rheumatology/keab501.

Serological abnormalities that predict progression to systemic autoimmune rheumatic diseases in antinuclear antibody-positive individuals

Affiliations

Serological abnormalities that predict progression to systemic autoimmune rheumatic diseases in antinuclear antibody-positive individuals

Carolina Muñoz-Grajales et al. Rheumatology (Oxford). .

Abstract

Objective: We investigated the autoantibody (autoAb) profiles in ANA+ individuals lacking systemic autoimmune rheumatic disease (SARD) and early SARD patients to determine the key differences between these groups and identify factors that are associated with an increased risk of symptomatic progression within the next 2 years in ANA+ individuals.

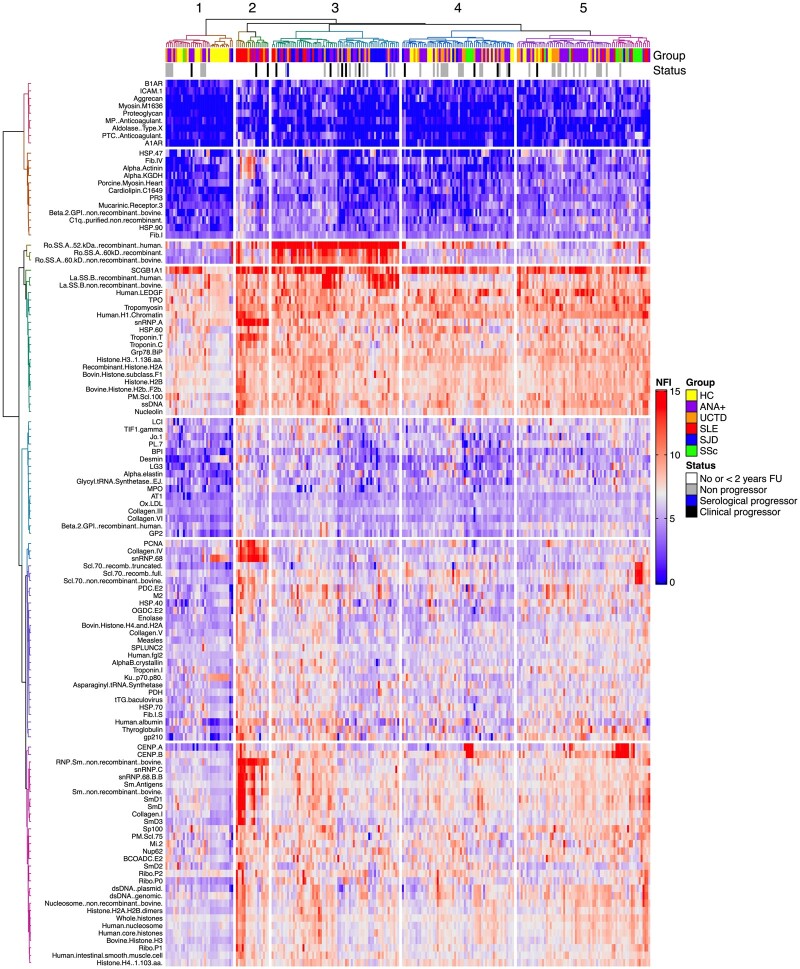
Methods: Using custom antigen (Ag) microarrays, 144 IgM and IgG autoAbs were surveyed in 84 asymptomatic and 123 symptomatic (48 UCTD and 75 SARD patients) ANA+ individuals. AutoAbs were compared in ANA+ individuals lacking a SARD diagnosis with ≥2 years follow-up (n = 52), including all those who demonstrated progression (n = 14) during this period, with changes over time assessed in a representative subset.

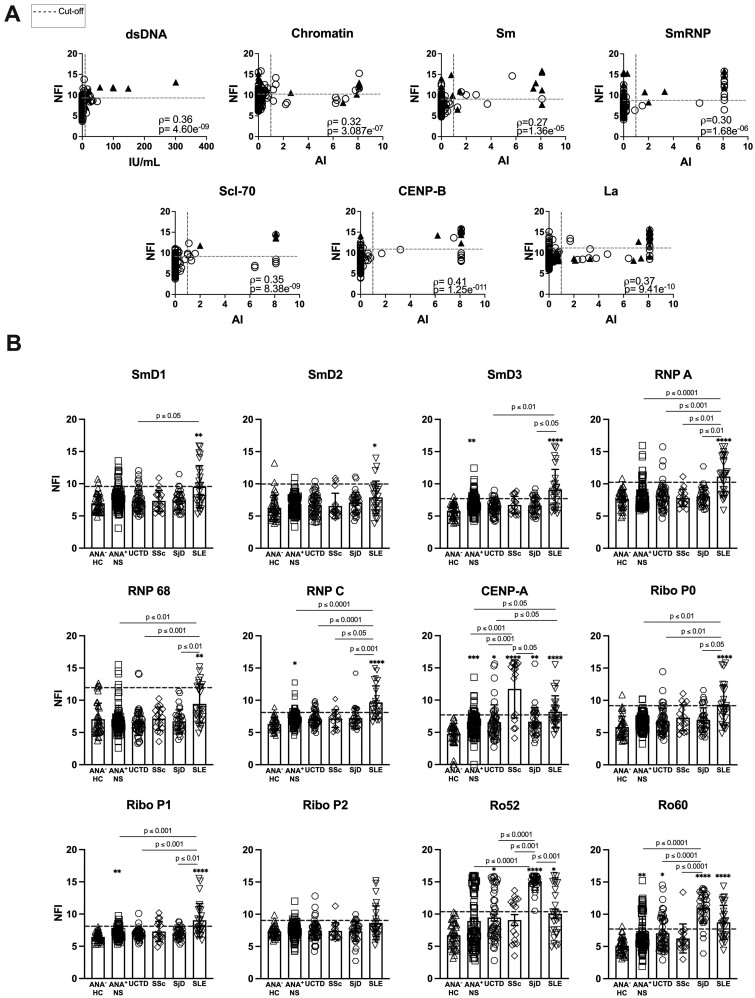
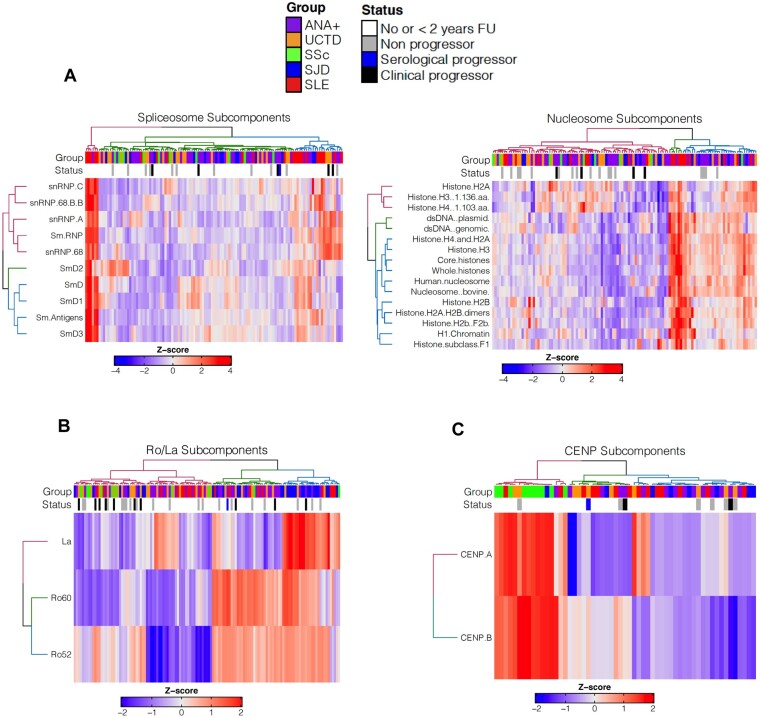
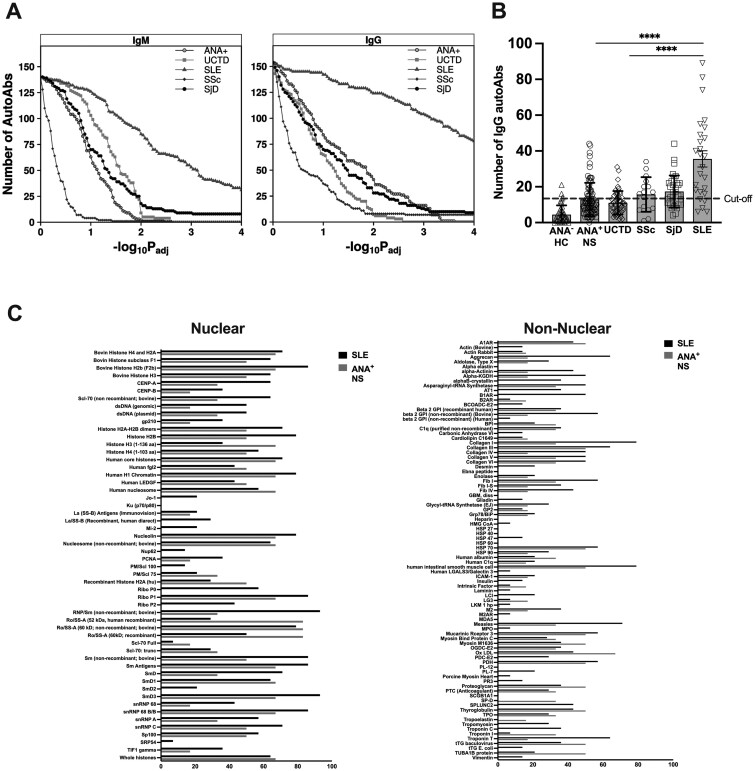
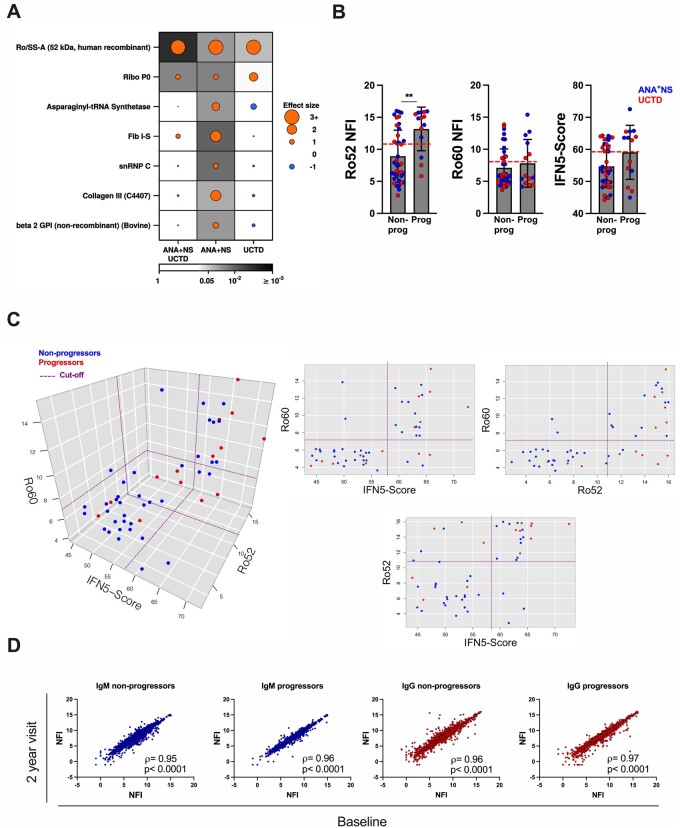
Results: We show that ANA+ individuals have autoAb to many self-Ags that are not being captured by current screening techniques and very high levels of these autoAbs are predominantly restricted to early SARD patients, with SLE patients displaying reactivity to many more autoAgs than the other groups. In general, the symptoms that developed in progressors mirrored those seen in SARD patients with similar patterns of autoAbs. Only anti-Ro52 Abs were found to predict progression (positive predictive value 46%, negative predictive value 89%). Surprisingly, over 2 years of follow-up the levels of autoAbs remained remarkably stable regardless of whether individuals progressed or not.

Conclusion: Our findings strongly argue that development of assays with an expanded set of auto-Ags and enhanced dynamic range would improve the diagnostic and prognostic ability of autoAb testing.

Keywords: Ro52 antigen; SLE; antinuclear antibodies; microarray analysis; rheumatic diseases.


Figures

<sc>Fig.</sc> 1
Fig. 1
Heat map showing the results of unsupervised hierarchical clustering analysis IgG autoAb NFI levels shown in red are high and those in blue are low. The status annotations indicate the diagnostic groups (HC, ANA healthy controls; ANA+, asymptomatic ANA+) and progression (black bar clinical progression, blue bar serological progression, grey bar no progression in the subsequent 2 years). ANAHC, ANA+ individuals lacking a SARD diagnosis with no follow-up (FU) or <2 years of FU and early SARD patients (SS=SJD) are denoted as No or <2 years FU. Only autoAbs that were significantly different at a dual threshold of FDR <0.05 and |coefficient| >1 on linear modelling for at least one of the ANA+ groups as compared with ANAHCs are included in the heat map.
<sc>Fig</sc>. 2
Fig. 2
Very high levels of IgG autoAbs as measured by microarray may help to classify early SARD patients (A) Correlations between the levels of the IgG autoAbs detected by microarray and the corresponding autoAbs in the Bioplex system. Filled triangles indicate patients with the most relevant SARD diagnosis: SLE for dsDNA, chromatin, Sm, and SmRNP; SS (SjD) for La; and SSc for Scl-70 and CENP-B. Open circles represent all the other study participants. The dashed lines indicate the cut-off for elevated levels (horizontal for microarray and vertical for the Bioplex system). Statistical significance was determined using Spearman’s correlation coefficient. (B) Levels of some IgG autoAb subcomponents included on the microarray that are not on the Bioplex system. Bars represent the mean (s.d.). The dashed line indicates the cut-off for elevated levels (ANAHC mean + 2 s.d.). Statistical significance was determined using the Kruskal–Wallis test with Dunn’s post-test for multiple comparisons. Significant differences relative to ANAHC are indicated by asterisks (*P ≤ 0.05, **P ≤ 0.01, ***P ≤ 0.001, ****P ≤ 0.0001) and differences for other groups by P-values. Non-significant differences are not displayed.
<sc>Fig.</sc> 3
Fig. 3
Heat maps showing IgG reactivity to clusters of autoAgs that are seen at high prevalence in SARD (A) Spliceosome and nucleosome subcomponents, (B) Ro52, Ro60 and La and (C) centromeric protein A and B autoAb levels in ANA+ individuals with reactivity to at least one of the autoAgs being surveyed in the plot. The status annotation indicates progression (black bar is clinical and blue bar is serological) and the ANA+ group classification. ANAHC, ANA+ individuals lacking a SARD diagnosis with no follow-up (FU) or <2 years of FU; early SARD patients (SS=SJD) are denoted as No or <2 years FU. AutoAb panels for each heat map were selected based on their high prevalence in SLE, SS and SSc, respectively.
<sc>Fig.</sc> 4
Fig. 4
Many more IgG autoAbs were elevated in SLE than in the other ANA+ groups (A) P-value sensitivity plot indicating the number of autoAbs determined to be significantly associated with each group at various significance thresholds relative to ANAHCs. For downstream analyses, a threshold of 0.05 was used. (B) Number of autoAbs recognized by each ANA+ group (SS=SjD). Reactivity was considered present if the autoAb levels exceeded 2 s.d. above the mean for ANAHCs. Bars represent the mean (s.d.) for each group. Statistical significance was determined using the Kruskal–Wallis test with Dunn’s post-test for multiple comparisons. Non-significant differences are not displayed; **P ≤ 0.01, ****P ≤ 0.0001. (C) Proportion of SLE patients and ANA+NS individuals with >30 autoAbs that recognized each nuclear and non-nuclear Ag in the microarray. Only autoAgs recognized by one of the groups are shown.
<sc>Fig.</sc> 5
Fig. 5
AutoAbs associated with progression in ANA+NS and UCTD individuals (A) Dotmap showing autoAbs with significant differences between progressors and non-progressors (P < 0.05 and |median fold change| >1). Dot size indicates effect size, colour shows direction (orange = higher abundance in progressors, blue = lower abundance in progressors) and background shading shows unadjusted P-value. (B) Levels of IgG anti-Ro52 Abs, IgG anti-Ro60 Abs and IFN5 scores in progressors and non-progressors that completed 2 years of follow-up. ANA+NS are indicated in blue [n = 31 (7 progressors)] and UCTD in red [n = 21 (7 progressors)]. Bars represent the mean (s.d.). Statistical significance was determined using the Mann–Whitney test. Non-significant differences are not displayed; **P ≤ 0.01. Red horizontal dashed lines indicate the cut-off for elevated levels, determined as >2 s.d. above the ANAHC mean. (C) Three-dimensional plot and corresponding orthographic views depicting the interrelationship between IFN5 score and the levels of anti-Ro52 and anti-Ro60 Abs. Red dots represent progressors and blue non-progressors. The dashed purple lines correspond to the cut-off for elevation for each component. (D) Log2-log2 plot contrasting the levels of IgM and IgG autoAbs at baseline and at 2 years of follow-up (visit 2) in progressors and non-progressors. The statistical significance of the correlation between the two visits was determined using Spearman’s correlation coefficient.

Similar articles

Cited by

References

    1. Slight-Webb S, Lu R, Ritterhouse LL. et al. Autoantibody-positive healthy individuals display unique immune profiles that may regulate autoimmunity. Arthritis Rheumatol 2016;68:2492–502. - PMC - PubMed
    1. Li QZ, Karp DR, Quan J. et al. Risk factors for ANA positivity in healthy persons. Arthritis Res Ther 2011;13:R38. - PMC - PubMed
    1. Eriksson C, Kokkonen H, Johansson M. et al. Autoantibodies predate the onset of systemic lupus erythematosus in northern Sweden. Arthritis Res Ther 2011;13:R30. - PMC - PubMed
    1. Bourn R, James JA.. Preclinical lupus. Curr Opin Rheumatol 2015;27:433–9. - PMC - PubMed
    1. McClain MT, Arbuckle MR, Heinlen LD. et al. The prevalence, onset, and clinical significance of antiphospholipid antibodies prior to diagnosis of systemic lupus erythematosus. Arthritis Rheum 2004;50:1226–32. - PubMed

Publication types

Substances

Grants and funding