

Proteomic and Transcriptomic Analyses Provide Novel Insights into the Crucial Roles of Host-Induced Carbohydrate Metabolism Enzymes in Xanthomonas oryzae pv. oryzae Virulence and Rice-Xoo Interaction
- PMID: 34176023
- PMCID: PMC8236019
- DOI: 10.1186/s12284-021-00503-x
Proteomic and Transcriptomic Analyses Provide Novel Insights into the Crucial Roles of Host-Induced Carbohydrate Metabolism Enzymes in Xanthomonas oryzae pv. oryzae Virulence and Rice-Xoo Interaction
Abstract
Background: Xanthomonas oryzae pv. oryzae (Xoo) causes bacterial leaf blight, a devastating rice disease. The Xoo-rice interaction, wherein wide ranging host- and pathogen-derived proteins and genes wage molecular arms race, is a research hotspot. Hence, the identification of novel rice-induced Xoo virulence factors and characterization of their roles affecting rice global gene expression profiles will provide an integrated and better understanding of Xoo-rice interactions from the molecular perspective.
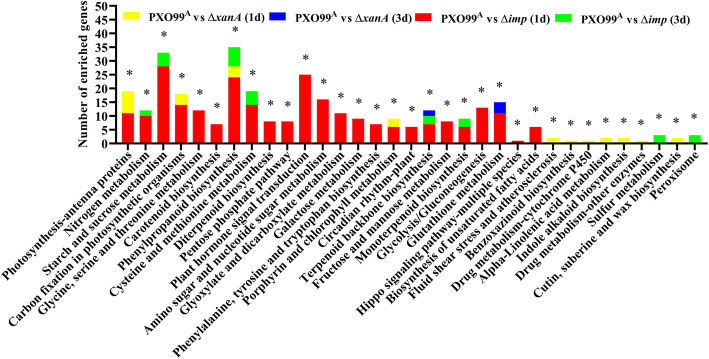
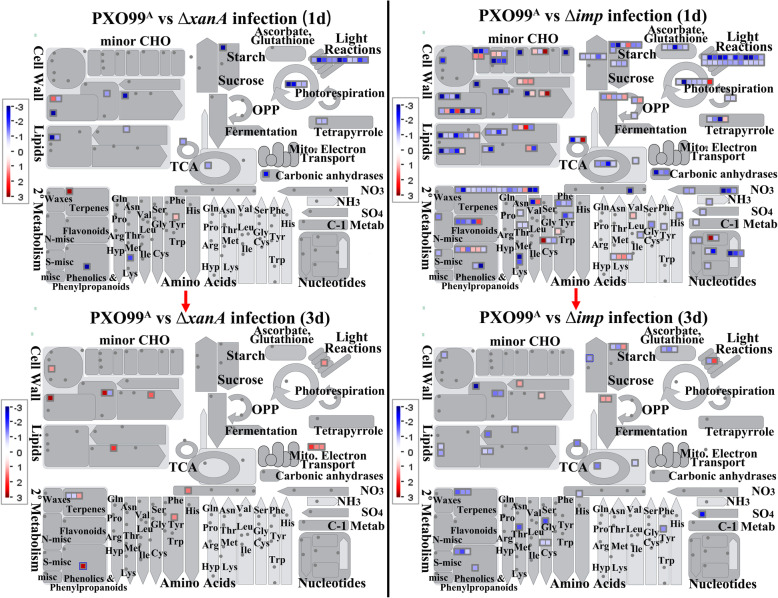
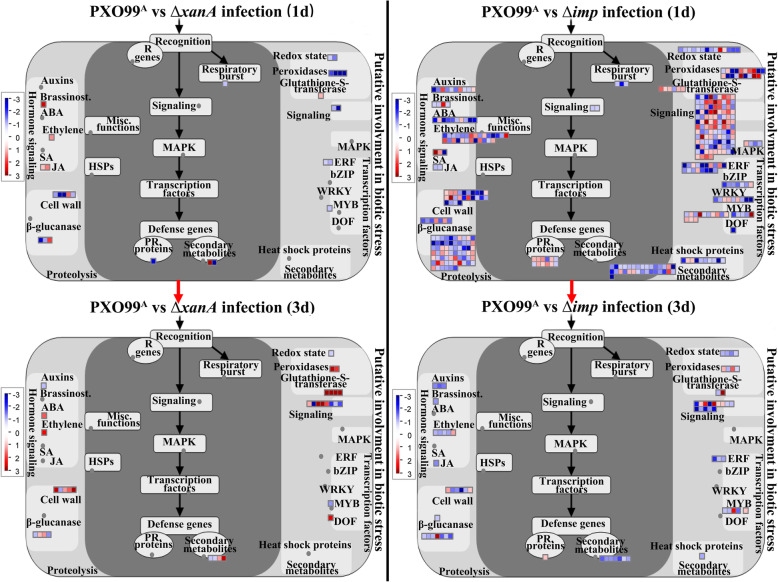
Results: Using comparative proteomics and an in vitro interaction system, we revealed that 5 protein spots from Xoo exhibited significantly different expression patterns (|fold change| > 1.5) at 3, 6, 12 h after susceptible rice leaf extract (RLX) treatment. MALDI-TOF MS analysis and pathogenicity tests showed that 4 host-induced proteins, including phosphohexose mutase, inositol monophosphatase, arginase and septum site-determining protein, affected Xoo virulence. Among them, mutants of two host-induced carbohydrate metabolism enzyme-encoding genes, ΔxanA and Δimp, elicited enhanced defense responses and nearly abolished Xoo virulence in rice. To decipher rice differentially expressed genes (DEGs) associated with xanA and imp, transcriptomic responses of ΔxanA-treated and Δimp-treated susceptible rice were compared to those in rice treated with PXO99A at 1 and 3 dpi. A total of 1521 and 227 DEGs were identified for PXO99A vs Δimp at 1 and 3 dpi, while for PXO99A vs ΔxanA, there were 131 and 106 DEGs, respectively. GO, KEGG and MapMan analyses revealed that the DEGs for PXO99A vs Δimp were mainly involved in photosynthesis, signal transduction, transcription, oxidation-reduction, hydrogen peroxide catabolism, ion transport, phenylpropanoid biosynthesis and metabolism of carbohydrates, lipids, amino acids, secondary metabolites, hormones, and nucleotides, while the DEGs from PXO99A vs ΔxanA were predominantly associated with photosynthesis, signal transduction, oxidation-reduction, phenylpropanoid biosynthesis, cytochrome P450 and metabolism of carbohydrates, lipids, amino acids, secondary metabolites and hormones. Although most pathways were associated with both the Δimp and ΔxanA treatments, the underlying genes were not the same.
Conclusion: Our study identified two novel host-induced virulence factors XanA and Imp in Xoo, and revealed their roles in global gene expression in susceptible rice. These results provide valuable insights into the molecular mechanisms of pathogen infection strategies and plant immunity.
Keywords: Carbohydrate metabolism enzyme; Differentially expressed genes; Host-induced proteins; Pathogenicity; Xoo-rice interaction.
Conflict of interest statement
The authors declare that they have no competing interests.
Figures


Similar articles
-
Comparative proteomic analysis reveals novel insights into the interaction between rice and Xanthomonas oryzae pv. oryzae.BMC Plant Biol. 2020 Dec 14;20(1):563. doi: 10.1186/s12870-020-02769-7. BMC Plant Biol. 2020. PMID: 33317452 Free PMC article.
-
Time-resolved pathogenic gene expression analysis of the plant pathogen Xanthomonas oryzae pv. oryzae.BMC Genomics. 2016 May 10;17:345. doi: 10.1186/s12864-016-2657-7. BMC Genomics. 2016. PMID: 27165035 Free PMC article.
-
The global strategy employed by Xanthomonas oryzae pv. oryzae to conquer low-oxygen tension.J Proteomics. 2017 May 24;161:68-77. doi: 10.1016/j.jprot.2017.04.006. Epub 2017 Apr 12. J Proteomics. 2017. PMID: 28412528
-
Rice versus Xanthomonas oryzae pv. oryzae: a unique pathosystem.Curr Opin Plant Biol. 2013 May;16(2):188-95. doi: 10.1016/j.pbi.2013.02.008. Epub 2013 Mar 4. Curr Opin Plant Biol. 2013. PMID: 23466254 Review.
-
The Roles of MicroRNAs in the Regulation of Rice-Pathogen Interactions.Plants (Basel). 2025 Jan 6;14(1):136. doi: 10.3390/plants14010136. Plants (Basel). 2025. PMID: 39795396 Free PMC article. Review.
Cited by
-
The MinCDE Cell Division System Participates in the Regulation of Type III Secretion System (T3SS) Genes, Bacterial Virulence, and Motility in Xanthomonas oryzae pv. oryzae.Microorganisms. 2022 Jul 31;10(8):1549. doi: 10.3390/microorganisms10081549. Microorganisms. 2022. PMID: 36013967 Free PMC article.
-
Recent Progress in Rice-Xanthomonas oryzae Interactions.Biology (Basel). 2025 Apr 25;14(5):471. doi: 10.3390/biology14050471. Biology (Basel). 2025. PMID: 40427660 Free PMC article. Review.
-
Effect of mutation of phaC on carbon supply, extracellular polysaccharide production, and pathogenicity of Xanthomonas oryzae pv. oryzae.Sci Rep. 2024 Aug 13;14(1):18781. doi: 10.1038/s41598-024-69621-y. Sci Rep. 2024. PMID: 39138326 Free PMC article.
-
Native Trichoderma Induced the Defense-Related Enzymes and Genes in Rice against Xanthomonas oryzae pv. oryzae (Xoo).Plants (Basel). 2023 Apr 30;12(9):1864. doi: 10.3390/plants12091864. Plants (Basel). 2023. PMID: 37176922 Free PMC article.
-
Sulforaphane, a secondary metabolite in crucifers, inhibits the oxidative stress adaptation and virulence of Xanthomonas by directly targeting OxyR.Mol Plant Pathol. 2022 Oct;23(10):1508-1523. doi: 10.1111/mpp.13245. Epub 2022 Aug 8. Mol Plant Pathol. 2022. PMID: 35942507 Free PMC article.
References
-
- Ashburner M, Ball CA, Blake JA, Botstein D, Butler H, Cherry JM, Davis AP, Dolinski K, Dwight SS, Eppig JT, Harris MA, Hill DP, Issel-Tarver L, Kasarskis A, Lewis S, Matese JC, Richardson JE, Ringwald M, Rubin GM, Sherlock G. Gene ontology: tool for the unification of biology. The gene ontology consortium. Nat Genet. 2000;25(1):25–29. doi: 10.1038/75556. - DOI - PMC - PubMed
Grants and funding
LinkOut - more resources
Full Text Sources
