. 2021 Jun;42(2):249-264.
doi: 10.1111/1475-5890.12271. Epub 2021 Jun 8.

Preparing for a pandemic: spending dynamics and panic buying during the COVID-19 first wave

Affiliations

Preparing for a pandemic: spending dynamics and panic buying during the COVID-19 first wave

Martin O'Connell et al. Fisc Stud. 2021 Jun.

Abstract

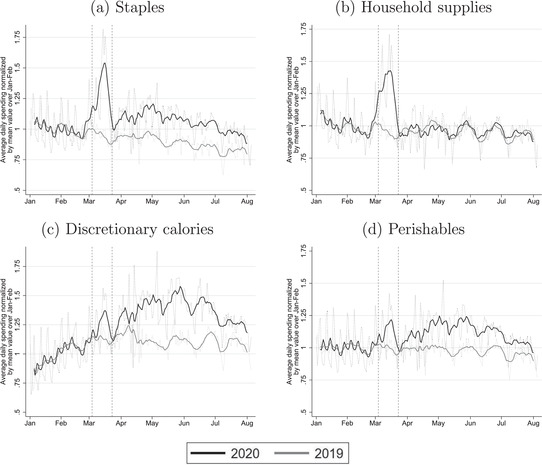
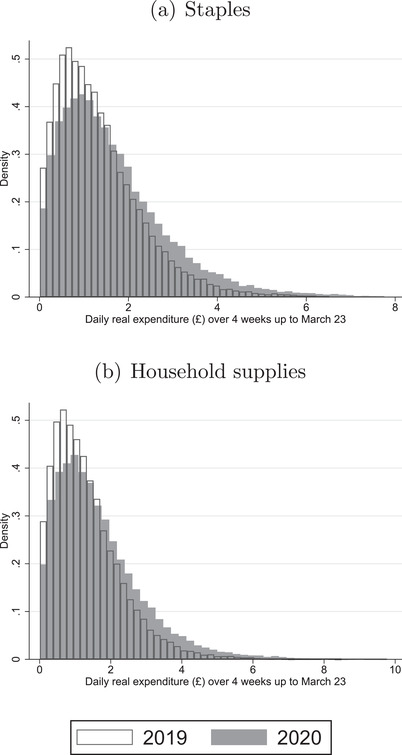
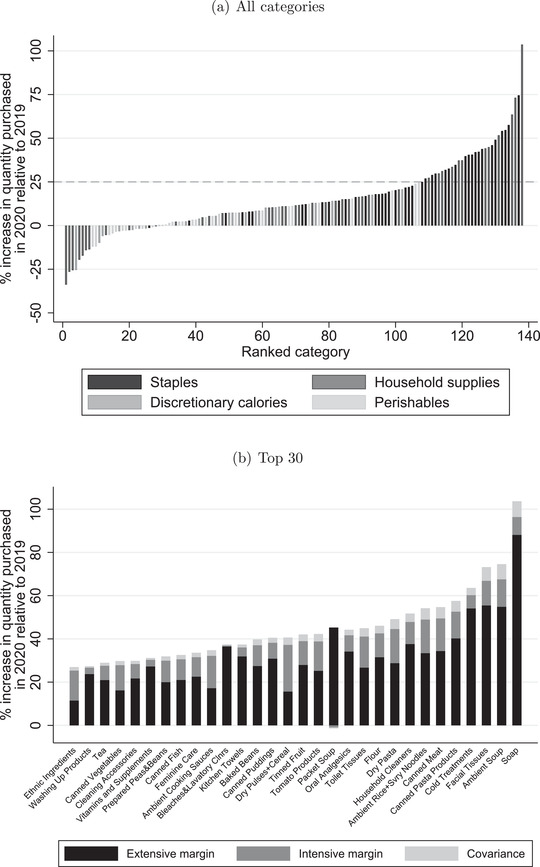
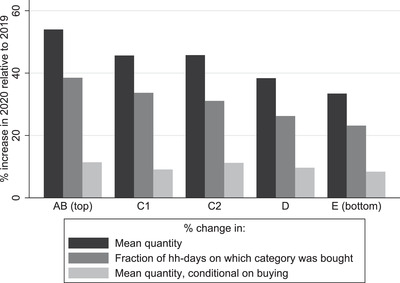
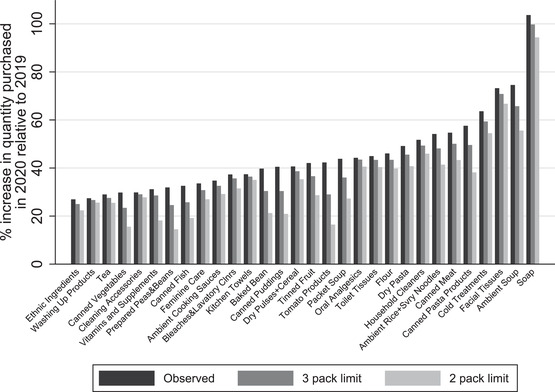
In times of heightened uncertainty, consumers face incentives to build up precautionary stocks of essential supplies. We study consumer spending dynamics during one such time, the first infection wave of the COVID-19 pandemic, using household scanner data covering fast-moving consumer goods in the United Kingdom. We document large increases in demand for storable products, such as food staples and household supplies, in the days before lockdown. Households in all socio-economic groups exhibit unusually high demand pre-lockdown, but there is a clear gradient, with the largest demand spikes for wealthier households. Although stories of people purchasing extreme amounts received a lot of attention, higher aggregate demand was mainly driven by more households than usual choosing to buy storable products, with only small increases in average quantities bought on a given trip. Temporary limits on the number of units per transaction, introduced following the demand spike, are therefore unlikely to lead to the avoidance of stock-outs.

Keywords: coronavirus; hoarding; panic buying.


Figures

FIGURE 1
FIGURE 1
Aggregate spending Note: The panels show total daily expenditure on staples, household supplies, discretionary calories and perishables. See Table A.3 in the online appendix for a list of the product categories in each grouping. The dotted lines show daily expenditure after removing day of the week and holiday effects. The solid black line shows a nine‐day moving average through these points. In each case, the line is normalised by the mean value over January and February. The vertical dashed lines indicate the announcement of the UK's coronavirus action plan on 3 March and the beginning of lockdown on 23 March.
FIGURE 2
FIGURE 2
Distribution of real spending in four weeks up until 23 March Note: For each household, we compute its average daily real expenditure on staples and household supplies over the four‐week period ending 22 March in both 2019 and 2020. The panels show the distributions in 2019 and 2020 for staples (panel a) and household supplies (panel b). See Table A.3 in the online appendix for a list of the product categories in each grouping. Daily real expenditure is constructed holding UPC prices fixed at their average level over the four‐week period ending 22 March in 2019.
FIGURE 3
FIGURE 3
Quantity increases across categories in four weeks up until 23 March Note: For each category, we compute the mean quantity purchased (across household‐days) over the four‐week period ending 22 March in 2019 and 2020. The bars show the percentage change between these two periods. Panel a shows changes for all categories. See Table A.3 in the online appendix for a list. Panel b zooms in on those with an increase of more than 25 per cent, decomposing the increase into changes due to the extensive margin, intensive margin and a covariance term.
FIGURE 4
FIGURE 4
Average change across product categories with largest demand spikes, by socio‐economic group Note: The figure shows the unweighted mean (across the top 30 categories shown in panel b of Figure 3) percentage change in quantity, fraction of household‐days on which the category was bought, and quantity conditional on buying, for each socio‐economic group.
FIGURE 5
FIGURE 5
Change in quantity spikes under counterfactual quantity limits Note: The black bars show the percentage increase in quantity purchased for each category between the four‐week period ending 22 March in 2019 and the same period in 2020. The dark and light grey bars show the analogous, counterfactual increases if households were limited to buying no more than three and no more than two packs per transaction, respectively.

References

    1. Alexander, D. & Karger, E. (2020), Do stay‐at‐home orders cause people to stay at home? Effects of stay‐at‐home orders on consumer behavior. Federal Reserve Bank of Chicago, Working Paper WP 2020‐12.
    1. Andersen, A. L. , Hansen, E. T. , Johannesen, N. & Sheridan, A. (2020), Consumer responses to the COVID‐19 crisis: evidence from bank account transaction data. SSRN Electronic Journal. - PMC - PubMed
    1. Baker, S. R. , Farrokhnia, R. A. , Meyer, S. , Pagel, M. & Yannelis, C. (2020a), How does household spending respond to an epidemic? Consumption during the 2020 COVID‐19 pandemic. Review of Asset Pricing Studies, 10, 834–62.
    1. Baker, S. R. , Farrokhnia, R. A. , Meyer, S. , Pagel, M. & Yannelis, C. (2020b), Income, liquidity, and the consumption response to the 2020 economic stimulus payments. National Bureau of Economic Research (NBER), Working Paper 27097.
    1. Bounie, D. , Camara, Y. & Galbraith, J. W. (2020), Consumers' mobility, expenditure and online‐offline substitution response to COVID‐19: evidence from French transaction data. SSRN Electronic Journal. - PMC - PubMed

LinkOut - more resources