

Optofluidic Flow-Through Biosensor Sensitivity - Model and Experiment
- PMID: 34177078
- PMCID: PMC8224397
- DOI: 10.1109/jlt.2021.3061872
Optofluidic Flow-Through Biosensor Sensitivity - Model and Experiment
Abstract
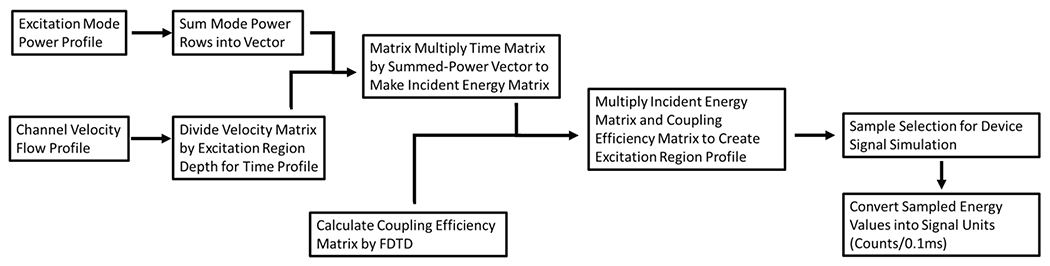
We present a model and simulation for predicting the detected signal of a fluorescence-based optical biosensor built from optofluidic waveguides. Typical applications include flow experiments to determine pathogen concentrations in a biological sample after tagging relevant DNA or RNA sequences. An overview of the biosensor geometry and fabrication processes is presented. The basis for the predictive model is also outlined. The model is then compared to experimental results for three different biosensor designs. The model is shown to have similar signal statistics as physical tests, illustrating utility as a pre-fabrication design tool and as a predictor of detection sensitivity.
Keywords: Anti-resonant reflecting optical waveguides (ARROW); integrated waveguides; model design; optofluidics; predictive simulation.
Conflict of interest statement
Disclosures A.R.H. and H.S. have a financial interest in Fluxus Inc., which commercializes optofluidic technology.
Figures


Similar articles
-
Liquid Core ARROW Waveguides: A Promising Photonic Structure for Integrated Optofluidic Microsensors.Micromachines (Basel). 2016 Mar 11;7(3):47. doi: 10.3390/mi7030047. Micromachines (Basel). 2016. PMID: 30407419 Free PMC article. Review.
-
FPGA Integrated Optofluidic Biosensor for Real-Time Single Biomarker Analysis.IEEE Photonics J. 2022 Feb;14(1):10.1109/jphot.2021.3127484. doi: 10.1109/jphot.2021.3127484. Epub 2021 Nov 15. IEEE Photonics J. 2022. PMID: 34900090 Free PMC article.
-
Optofluidic devices with integrated solid-state nanopores.Mikrochim Acta. 2016 Apr;183(4):1275-1287. doi: 10.1007/s00604-016-1758-y. Epub 2016 Jan 27. Mikrochim Acta. 2016. PMID: 27046940 Free PMC article.
-
Optofluidic Lab-on-a-Chip Fluorescence Sensor Using Integrated Buried ARROW (bARROW) Waveguides.Micromachines (Basel). 2017 Aug;8(8):252. doi: 10.3390/mi8080252. Epub 2017 Aug 17. Micromachines (Basel). 2017. PMID: 29201455 Free PMC article.
-
Tailoring the spectral response of liquid waveguide diagnostic platforms.J Biophotonics. 2012 Aug;5(8-9):703-11. doi: 10.1002/jbio.201200049. Epub 2012 May 16. J Biophotonics. 2012. PMID: 22589084 Free PMC article. Review.
Cited by
-
Performance Comparison of Flow-Through Optofluidic Biosensor Designs.Biosensors (Basel). 2021 Jul 7;11(7):226. doi: 10.3390/bios11070226. Biosensors (Basel). 2021. PMID: 34356697 Free PMC article.
-
Dual optofluidic distributed feedback dye lasers for multiplexed biosensing applications.Sci Rep. 2023 Oct 6;13(1):16824. doi: 10.1038/s41598-023-42671-4. Sci Rep. 2023. PMID: 37803034 Free PMC article.
-
Comparison of Illumination Methods for Flow-Through Optofluidic Biosensors.Micromachines (Basel). 2023 Mar 24;14(4):723. doi: 10.3390/mi14040723. Micromachines (Basel). 2023. PMID: 37420956 Free PMC article.
References
-
- Du K, Cai H, Wall TA, Stott MA, Alfson KJ, Griffiths A, Carrion R, Patterson JL, Hawkins AR, Schmidt H, and Mathies RA, “Multiplexed Efficient On-Chip Sample Preparation and Sensitive Amplification-Free Detection of Ebola Virus”, Biosens. Bioelectron, vol. 91, pp. 489–496, January. 2017, doi: 10.1016/j.bios.2016.12.071. - DOI - PMC - PubMed
Grants and funding
LinkOut - more resources
Full Text Sources