. 2021 Jun 9:15:668918.
doi: 10.3389/fnhum.2021.668918. eCollection 2021.

Neural Entrainment Meets Behavior: The Stability Index as a Neural Outcome Measure of Auditory-Motor Coupling

Affiliations

Neural Entrainment Meets Behavior: The Stability Index as a Neural Outcome Measure of Auditory-Motor Coupling

Mattia Rosso et al. Front Hum Neurosci. .

Abstract

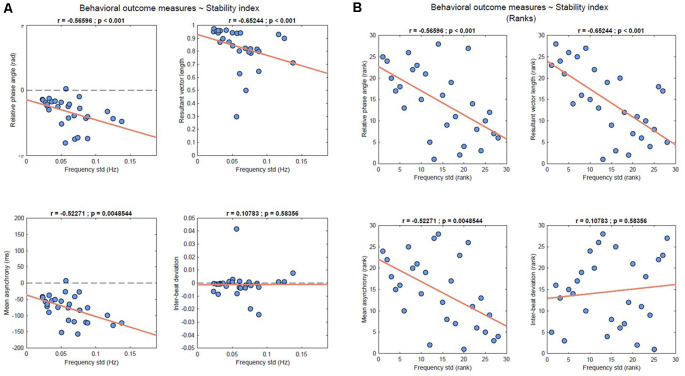
Understanding rhythmic behavior in the context of coupled auditory and motor systems has been of interest to neurological rehabilitation, in particular, to facilitate walking. Recent work based on behavioral measures revealed an entrainment effect of auditory rhythms on motor rhythms. In this study, we propose a method to compute the neural component of such a process from an electroencephalographic (EEG) signal. A simple auditory-motor synchronization paradigm was used, where 28 healthy participants were instructed to synchronize their finger-tapping with a metronome. The computation of the neural outcome measure was carried out in two blocks. In the first block, we used Generalized Eigendecomposition (GED) to reduce the data dimensionality to the component which maximally entrained to the metronome frequency. The scalp topography pointed at brain activity over contralateral sensorimotor regions. In the second block, we computed instantaneous frequency from the analytic signal of the extracted component. This returned a time-varying measure of frequency fluctuations, whose standard deviation provided our "stability index" as a neural outcome measure of auditory-motor coupling. Finally, the proposed neural measure was validated by conducting a correlation analysis with a set of behavioral outcomes from the synchronization task: resultant vector length, relative phase angle, mean asynchrony, and tempo matching. Significant moderate negative correlations were found with the first three measures, suggesting that the stability index provided a quantifiable neural outcome measure of entrainment, with selectivity towards phase-correction mechanisms. We address further adoption of the proposed approach, especially with populations where sensorimotor abilities are compromised by an underlying pathological condition. The impact of using stability index can potentially be used as an outcome measure to assess rehabilitation protocols, and possibly provide further insight into neuropathological models of auditory-motor coupling.

Keywords: EEG; auditory-motor coupling; eigendecomposition; entrainment; finger-tapping; instantaneous frequency; stability index; synchronization.


Conflict of interest statement

The authors declare that the research was conducted in the absence of any commercial or financial relationships that could be construed as a potential conflict of interest.

Figures

Figure 1
Figure 1
Graphical illustration of the study’s rationale and the proposed contribution to the current state of the art.
Figure 2
Figure 2
Electroencephalographic (EEG) processing pipeline. The present pipeline illustrates the steps through which the proposed stability index was computed. Following the pre-processing, generalized eigendecomposition (GED) was performed on a broad set of regions of interest (ROIs). The vector of weights w associated with the highest eigenvalue was used as a spatial filter. By multiplying the data from the 37 channels behind the frontocentral line (1), we produced a single time series. The weights of the excluded channels were set to 0. The resulting “entrained component” (2) went through a cascade of computational steps: first, it was narrow-band filtered with a Gaussian filter centered at the stimulus frequency, in order to extract reliable phase time series unaffected by broad-band components (center = 1.65 Hz; width at half-maximum = 0.3 Hz). The “filtered component” (3) was then Hilbert-transformed to produce the “analytic signal” (4), from which we computed the “phase angles” time series (5). Finally, the phase was unwrapped, its first derivative was used to compute the “instantaneous frequency” (6), and a sliding moving median was applied in order to level out eventual artifactual peaks. The plot shows how the pipeline results in a time-varying measure of frequency over time, which fluctuates around the stimulation frequency (i.e., the thin horizontal line intercepting the y-axis at 1.65 Hz). The standard deviation of the instantaneous frequency provides a global measure of the stability of the entrained component for a given time window, which in our case was the whole duration of the task. We named such a global measure “stability index”, for it equals 0 in the case of a flat horizontal line. Such a scenario would be observed in the ideal case of a perfectly stable component oscillating like a simple sine wave.
Figure 3
Figure 3
Group-level assessment of the source separation. The following criteria were used to assess the quality of our source separation via generalized eigendecomposition (GED). (A) Topography. The grand-average coefficients of activation are shown in the topographic plot: maximal activation was recorded at the left centroparietal “CP” cluster and at left temporal electrodes (“T7” and “TP7”). It should be noted that we explicitly excluded from the spatial filter the channels located beyond the frontocentral line, for we intended to maximize an entrained response related to sensorimotor processing in the context of the task. (B) SNR spectrum. The grand-average power spectrum is represented here in the percentage signal-to-noise ratio between each data point and the mean power in the neighboring bins (0.5 Hz), in order to remove the physiological 1/f component of the spectrum (Freeman et al., 2003). (C) Eigenspectrum.The grand-average eigenvalues sorted in descending order exhibit a steep exponential decay. The vector of weights w used for our spatial filter is the one associated with the highest eigenvalue λ. Before averaging, eigenvalues were normalized and expressed as percentage of explained variance. All grand-averages were computed on the whole sample of participants (N = 28).
Figure 4
Figure 4
(A) Results of the Spearman’s correlation analysis between the behavioral outcome measures and stability index of all study participants. Data are represented on the original scale. (B) Correlations between the ranks for the behavioral outcome measures and stability index of all study participants.

References

    1. Andersen S. K., Fuchs S., Muller M. M. (2011). Effects of feature-selective and spatial attention at different stages of visual processing. J. Cogn. Neurosci. 23, 238–246. 10.1162/jocn.2009.21328 - DOI - PubMed
    1. Andersen S. K., Muller M. M., Martinovic J. (2012). Bottom-up biases in feature-selective attention. J. Neurosci. 32, 16953–16958. 10.1523/JNEUROSCI.1767-12.2012 - DOI - PMC - PubMed
    1. Aschersleben G. (2002). Temporal control of movements in sensorimotor synchronization. Brain Cogn. 48, 66–79. 10.1006/brcg.2001.1304 - DOI - PubMed
    1. Assaneo F. M., Rimmele J. M., Perl Y. S., Poeppel D. (2021). Speaking rhythmically can shape hearing. Nat. Hum. Behav. 5, 71–82. 10.1038/s41562-020-00962-0 - DOI - PubMed
    1. Bavassi M. L., Tagliazucchi E., Laje R. (2013). Small perturbations in a finger-tapping task reveal inherent nonlinearities of the underlying error correction mechanism. Hum. Mov. Sci. 32, 21–47. 10.1016/j.humov.2012.06.002 - DOI - PubMed

LinkOut - more resources