

Patchouli Alcohol Modulates the Pregnancy X Receptor/Toll-like Receptor 4/Nuclear Factor Kappa B Axis to Suppress Osteoclastogenesis
- PMID: 34177594
- PMCID: PMC8227438
- DOI: 10.3389/fphar.2021.684976
Patchouli Alcohol Modulates the Pregnancy X Receptor/Toll-like Receptor 4/Nuclear Factor Kappa B Axis to Suppress Osteoclastogenesis
Abstract
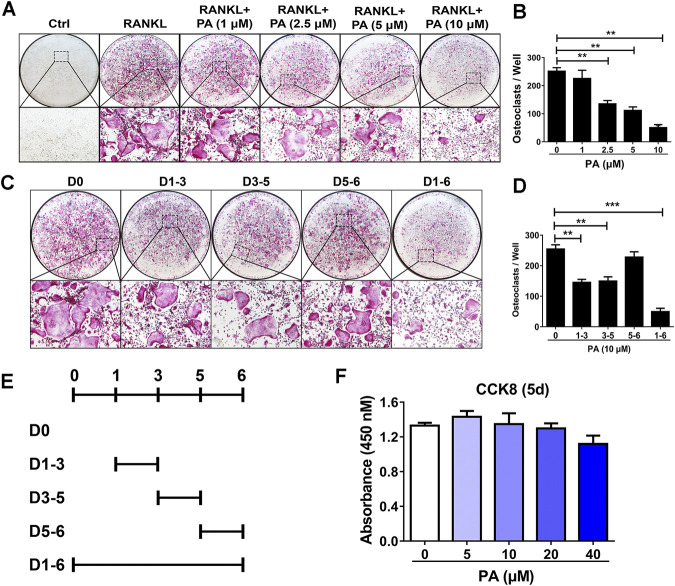
The incidence of osteoporosis, which is primarily characterized by plethoric osteoclast (OC) formation and severe bone loss, has increased in recent years. Millions of people worldwide, especially postmenopausal women, suffer from osteoporosis. The drugs commonly used to treat osteoporosis still exist many disadvantages, but natural extracts provide options for the treatment of osteoporosis. Therefore, the identification of cost-effective natural compounds is important. Patchouli alcohol (PA), a natural compound extracted from Pogostemon cablin that exerts anti-inflammatory effects, is used as a treatment for gastroenteritis. However, no research on the use of Patchouli alcohol in osteoporosis has been reported. We found that PA dose-dependently inhibited the receptor activator of nuclear factor kappa-B ligand (RANKL)-induced formation and function of OCs without cytotoxicity. Furthermore, these inhibitory effects were reflected in the significant effect of PA on the NF-κB signaling pathway, as PA suppressed the transcription factors NFATc1 and c-Fos. We also determined that PA activated expression of the nuclear receptor pregnane X receptor (PXR) and promoted the PXR/Toll-like receptor 4 (TLR4) axis to inhibit the nuclear import of NF-κB (p50 and p65). Additionally, PA exerted therapeutic effects against osteoporosis in ovariectomized (OVX) mice, supporting the use of PA as a treatment for osteoporosis in the future.
Keywords: PXR; nuclear factor κB; osteoclast; osteoporosis; patchouli alcohol; receptor activator for nuclear factor κB ligand.
Copyright © 2021 Lu, Jiang, Hou, Qian, Chu, Zhang, Ye, Chen, Liu, Yao, Zhang, Xu, Wang, Fan and Wang.
Conflict of interest statement
The authors declare that the research was conducted in the absence of any commercial or financial relationships that could be construed as a potential conflict of interest.
Figures


Similar articles
-
Patchouli alcohol activates PXR and suppresses the NF-κB-mediated intestinal inflammatory.J Ethnopharmacol. 2020 Feb 10;248:112302. doi: 10.1016/j.jep.2019.112302. Epub 2019 Oct 12. J Ethnopharmacol. 2020. PMID: 31614203
-
Caffeic acid 3,4-dihydroxy-phenethyl ester suppresses receptor activator of NF-κB ligand–induced osteoclastogenesis and prevents ovariectomy-induced bone loss through inhibition of mitogen-activated protein kinase/activator protein 1 and Ca2+–nuclear factor of activated T-cells cytoplasmic 1 signaling pathways.J Bone Miner Res. 2012 Jun;27(6):1298-1308. doi: 10.1002/jbmr.1576. J Bone Miner Res. 2012. PMID: 22337253
-
Leonurine hydrochloride inhibits osteoclastogenesis and prevents osteoporosis associated with estrogen deficiency by inhibiting the NF-κB and PI3K/Akt signaling pathways.Bone. 2015 Jun;75:128-37. doi: 10.1016/j.bone.2015.02.017. Epub 2015 Feb 21. Bone. 2015. PMID: 25708053
-
Cyperus Rotundus L. extract suppresses RANKL-induced osteoclastogenesis through NFATc1/c-fos downregulation and prevent bone loss in OVX-induced osteoporosis rat.J Ethnopharmacol. 2017 Jun 9;205:186-194. doi: 10.1016/j.jep.2017.03.017. Epub 2017 Mar 15. J Ethnopharmacol. 2017. PMID: 28315458
-
Anti-Osteoporotic Mechanisms of Polyphenols Elucidated Based on In Vivo Studies Using Ovariectomized Animals.Antioxidants (Basel). 2022 Jan 23;11(2):217. doi: 10.3390/antiox11020217. Antioxidants (Basel). 2022. PMID: 35204100 Free PMC article. Review.
Cited by
-
Regulation of differentiation and generation of osteoclasts in rheumatoid arthritis.Front Immunol. 2022 Nov 18;13:1034050. doi: 10.3389/fimmu.2022.1034050. eCollection 2022. Front Immunol. 2022. PMID: 36466887 Free PMC article.
-
The critical role of toll-like receptor 4 in bone remodeling of osteoporosis: from inflammation recognition to immunity.Front Immunol. 2024 Mar 5;15:1333086. doi: 10.3389/fimmu.2024.1333086. eCollection 2024. Front Immunol. 2024. PMID: 38504994 Free PMC article. Review.
-
Employing single-cell RNA sequencing coupled with an array of bioinformatics approaches to ascertain the shared genetic characteristics between osteoporosis and obesity.Bone Joint Res. 2024 Oct 16;13(10):573-587. doi: 10.1302/2046-3758.1310.BJR-2023-0366.R1. Bone Joint Res. 2024. PMID: 39412449 Free PMC article.
-
Tm4sf19 inhibition ameliorates inflammation and bone destruction in collagen-induced arthritis by suppressing TLR4-mediated inflammatory signaling and abnormal osteoclast activation.Bone Res. 2025 Mar 24;13(1):40. doi: 10.1038/s41413-025-00419-y. Bone Res. 2025. PMID: 40128226 Free PMC article.
-
Pregnane X Receptor Signaling Pathway and Vitamin K: Molecular Mechanisms and Clinical Relevance in Human Health.Cells. 2024 Apr 14;13(8):681. doi: 10.3390/cells13080681. Cells. 2024. PMID: 38667296 Free PMC article. Review.
References
LinkOut - more resources
Full Text Sources
Research Materials
Miscellaneous