

Ketamine Alters Functional Gamma and Theta Resting-State Connectivity in Healthy Humans: Implications for Schizophrenia Treatment Targeting the Glutamate System
- PMID: 34177660
- PMCID: PMC8222814
- DOI: 10.3389/fpsyt.2021.671007
Ketamine Alters Functional Gamma and Theta Resting-State Connectivity in Healthy Humans: Implications for Schizophrenia Treatment Targeting the Glutamate System
Abstract
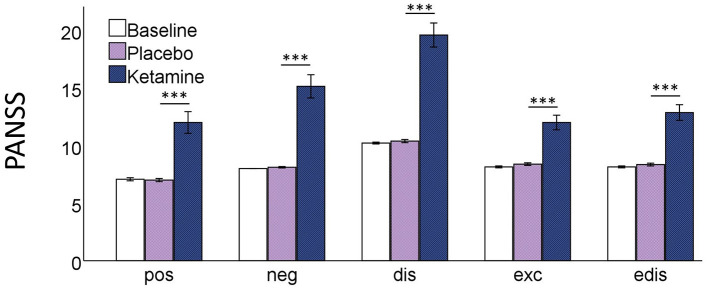
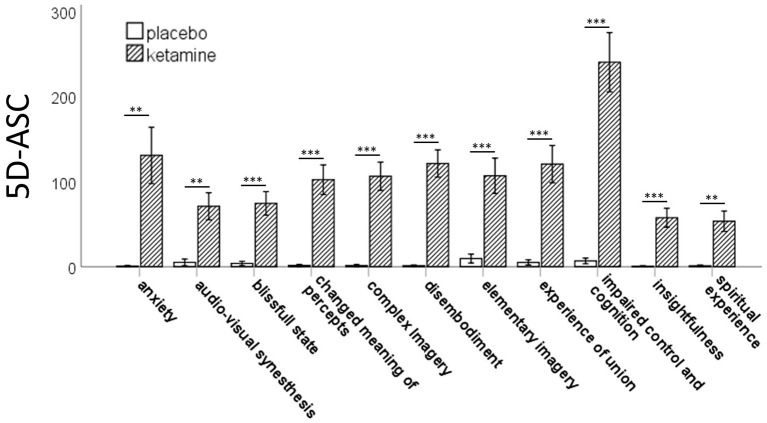
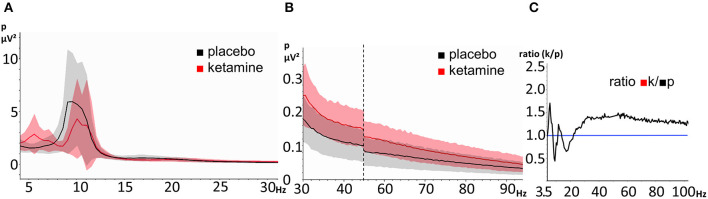
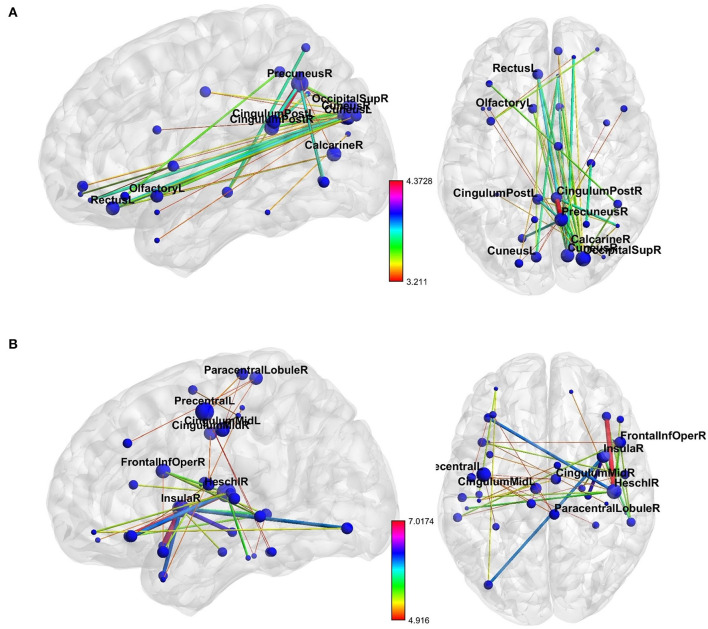
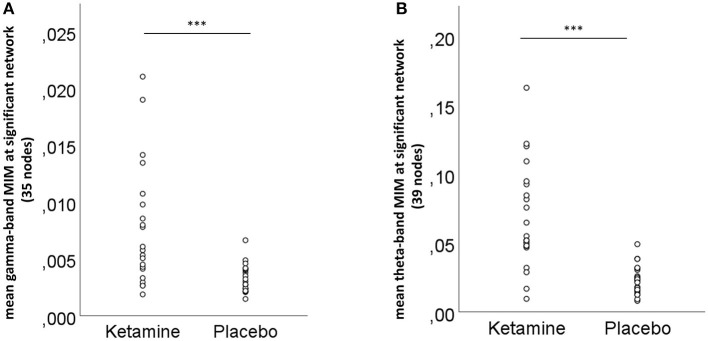
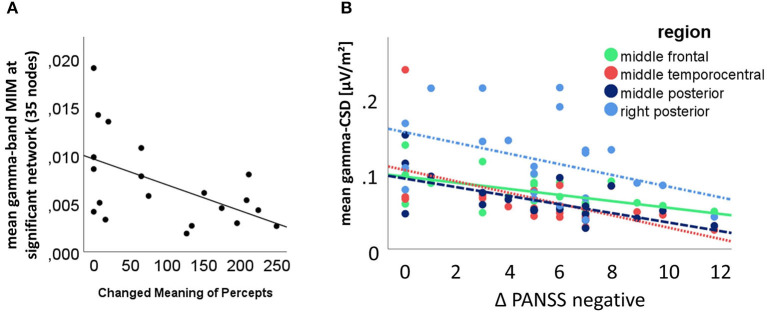
Disturbed functional connectivity is assumed to cause neurocognitive deficits in patients suffering from schizophrenia. A Glutamate N-methyl-D-aspartate receptor (NMDAR) dysfunction has been suggested as a possible mechanism underlying altered connectivity in schizophrenia, especially in the gamma- and theta-frequency range. The present study aimed to investigate the effects of the NMDAR-antagonist ketamine on resting-state power, functional connectivity, and schizophrenia-like psychopathological changes in healthy volunteers. In a placebo-controlled crossover design, 25 healthy subjects were recorded using resting-state 64-channel-electroencephalography (EEG) (eyes closed). The imaginary coherence-based Multivariate Interaction Measure (MIM) was used to measure gamma and theta connectivity across 80 cortical regions. The network-based statistic was applied to identify involved networks under ketamine. Psychopathology was assessed with the Positive and Negative Syndrome Scale (PANSS) and the 5-Dimensional Altered States of Consciousness Rating Scale (5D-ASC). Ketamine caused an increase in all PANSS (p < 0.001) as well as 5D-ASC scores (p < 0.01). Significant increases in resting-state gamma and theta power were observed under ketamine compared to placebo (p < 0.05). The source-space analysis revealed two distinct networks with an increased mean functional gamma- or theta-band connectivity during the ketamine session. The gamma-network consisted of midline regions, the cuneus, the precuneus, and the bilateral posterior cingulate cortices, while the theta-band network involved the Heschl gyrus, midline regions, the insula, and the middle cingulate cortex. The current source density (CSD) within the gamma-band correlated negatively with the PANSS negative symptom score, and the activity within the gamma-band network correlated negatively with the subjective changed meaning of percepts subscale of the 5D-ASC. These results are in line with resting-state patterns seen in people who have schizophrenia and argue for a crucial role of the glutamate system in mediating dysfunctional gamma- and theta-band-connectivity in schizophrenia. Resting-state networks could serve as biomarkers for the response to glutamatergic drugs or drug development efforts within the glutamate system.
Keywords: functional connectivity; gamma-band oscillations; glutamate hypothesis; ketamine model of schizophrenia; negative-symptoms; resting state; theta-band oscillations.
Copyright © 2021 Curic, Andreou, Nolte, Steinmann, Thiebes, Polomac, Haaf, Rauh, Leicht and Mulert.
Conflict of interest statement
The authors declare that the research was conducted in the absence of any commercial or financial relationships that could be construed as a potential conflict of interest.
Figures

Similar articles
-
Reduced auditory evoked gamma-band response and schizophrenia-like clinical symptoms under subanesthetic ketamine.Neuropsychopharmacology. 2019 Jun;44(7):1239-1246. doi: 10.1038/s41386-019-0328-5. Epub 2019 Feb 6. Neuropsychopharmacology. 2019. PMID: 30758327 Free PMC article. Clinical Trial.
-
Alterations in interhemispheric gamma-band connectivity are related to the emergence of auditory verbal hallucinations in healthy subjects during NMDA-receptor blockade.Neuropsychopharmacology. 2018 Jun;43(7):1608-1615. doi: 10.1038/s41386-018-0014-z. Epub 2018 Feb 5. Neuropsychopharmacology. 2018. PMID: 29453445 Free PMC article. Clinical Trial.
-
Resting-state theta-band connectivity and verbal memory in schizophrenia and in the high-risk state.Schizophr Res. 2015 Feb;161(2-3):299-307. doi: 10.1016/j.schres.2014.12.018. Epub 2014 Dec 29. Schizophr Res. 2015. PMID: 25553979
-
Glutamatergic Deficits in Schizophrenia - Biomarkers and Pharmacological Interventions within the Ketamine Model.Curr Pharm Biotechnol. 2018;19(4):293-307. doi: 10.2174/1389201019666180620112528. Curr Pharm Biotechnol. 2018. PMID: 29929462 Free PMC article. Review.
-
Reviewing the ketamine model for schizophrenia.J Psychopharmacol. 2014 Apr;28(4):287-302. doi: 10.1177/0269881113512909. Epub 2013 Nov 20. J Psychopharmacol. 2014. PMID: 24257811 Free PMC article. Review.
Cited by
-
The Altered States Database: Psychometric data from a systematic literature review.Sci Data. 2022 Nov 23;9(1):720. doi: 10.1038/s41597-022-01822-4. Sci Data. 2022. PMID: 36418335 Free PMC article.
-
Glutamatergic mechanisms in early salience processing.Front Pharmacol. 2025 Jul 1;16:1601797. doi: 10.3389/fphar.2025.1601797. eCollection 2025. Front Pharmacol. 2025. PMID: 40667504 Free PMC article.
-
Opposite Modulation of the NMDA Receptor by Glycine and S-Ketamine and the Effects on Resting State EEG Gamma Activity: New Insights into the Glutamate Hypothesis of Schizophrenia.Int J Mol Sci. 2023 Jan 18;24(3):1913. doi: 10.3390/ijms24031913. Int J Mol Sci. 2023. PMID: 36768234 Free PMC article.
-
Activity-State Dependent Reversal of Ketamine-Induced Resting State EEG Effects by Clozapine and Naltrexone in the Freely Moving Rat.Front Psychiatry. 2022 Jan 27;13:737295. doi: 10.3389/fpsyt.2022.737295. eCollection 2022. Front Psychiatry. 2022. PMID: 35153870 Free PMC article.
-
The effect of ketamine and D-cycloserine on the high frequency resting EEG spectrum in humans.Psychopharmacology (Berl). 2023 Jan;240(1):59-75. doi: 10.1007/s00213-022-06272-9. Epub 2022 Nov 19. Psychopharmacology (Berl). 2023. PMID: 36401646 Free PMC article.
References
LinkOut - more resources
Full Text Sources
Miscellaneous