. 2021 Jun 11:12:640931.
doi: 10.3389/fmicb.2021.640931. eCollection 2021.

Comparative Proteomic Analysis of Histoplasma capsulatum Yeast and Mycelium Reveals Differential Metabolic Shifts and Cell Wall Remodeling Processes in the Different Morphotypes

Affiliations

Comparative Proteomic Analysis of Histoplasma capsulatum Yeast and Mycelium Reveals Differential Metabolic Shifts and Cell Wall Remodeling Processes in the Different Morphotypes

Marcos Abreu Almeida et al. Front Microbiol. .

Abstract

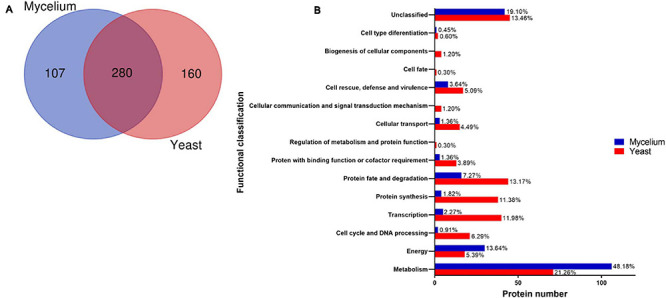
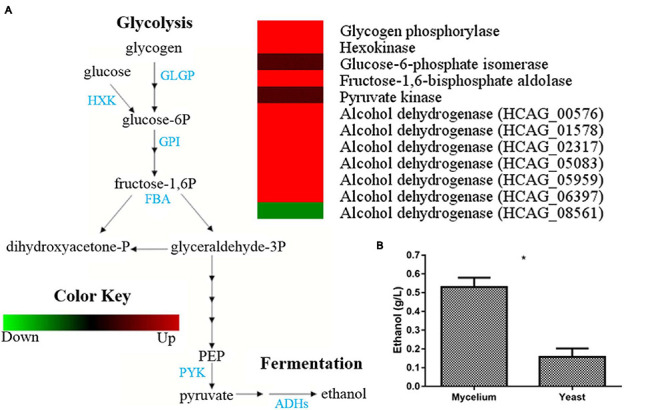
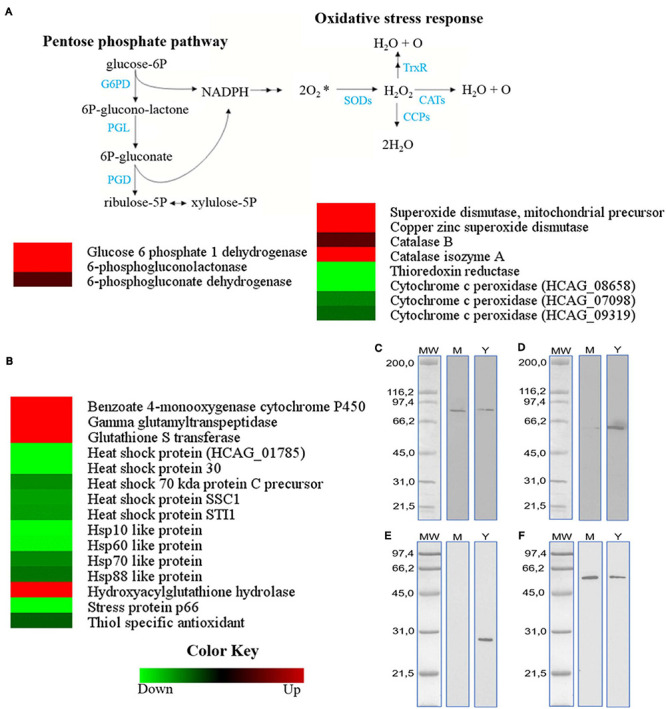
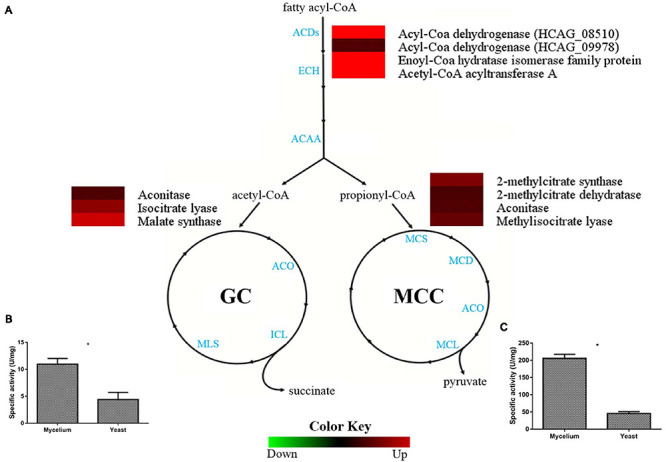
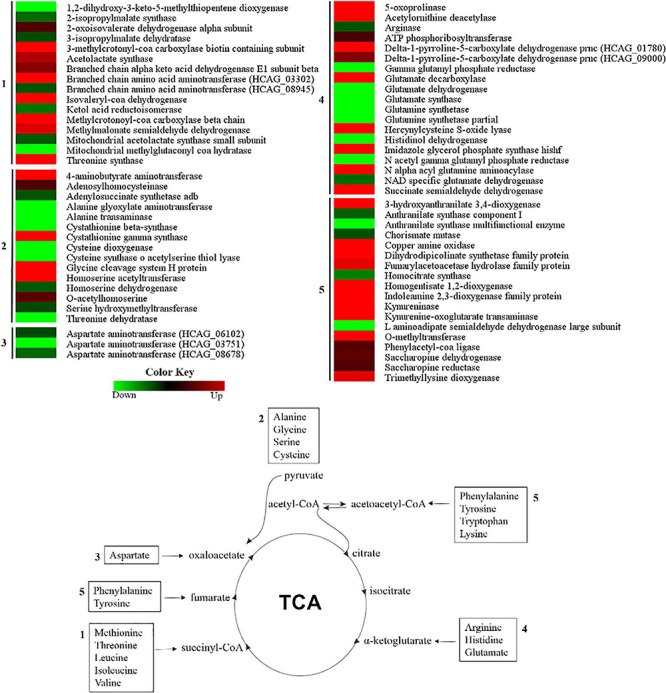
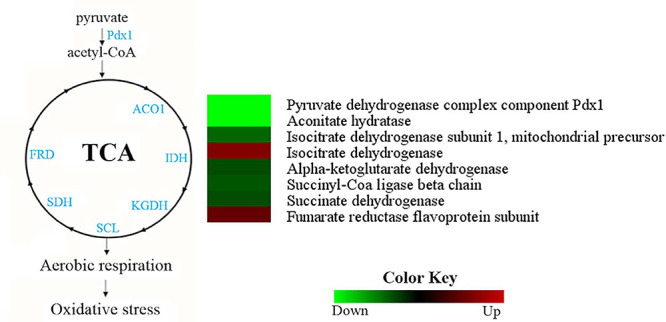
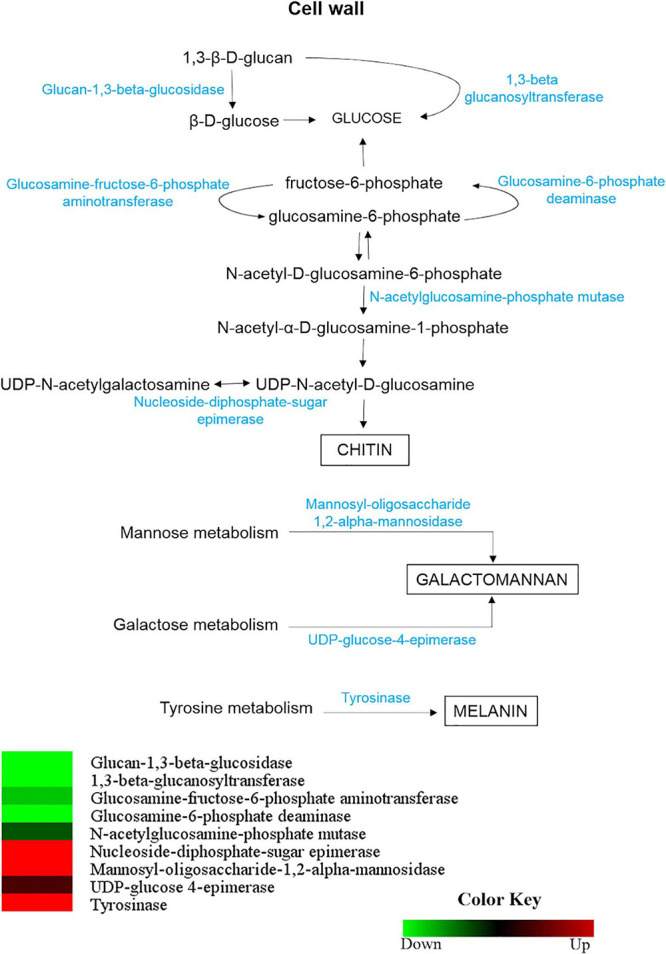
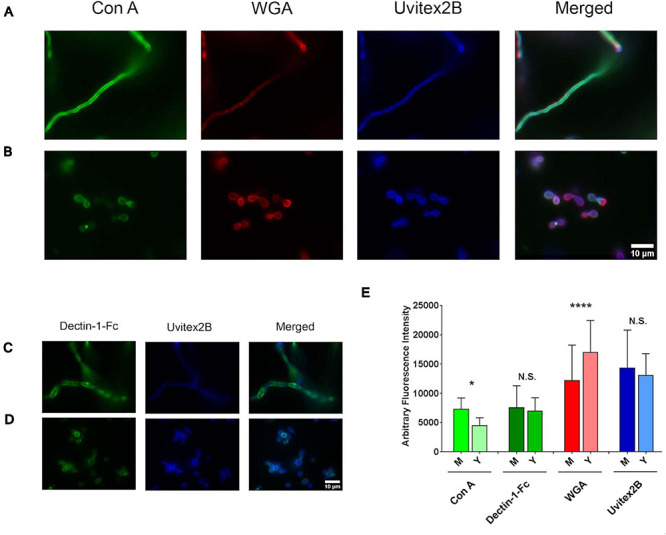
Histoplasma capsulatum is a thermally dimorphic fungus distributed worldwide, but with the highest incidence in the Americas within specific geographic areas, such as the Mississippi River Valley and regions in Latin America. This fungus is the etiologic agent of histoplasmosis, an important life-threatening systemic mycosis. Dimorphism is an important feature for fungal survival in different environments and is related to the virulence of H. capsulatum, and essential to the establishment of infection. Proteomic profiles have made important contributions to the knowledge of metabolism and pathogenicity in several biological models. However, H. capsulatum proteome studies have been underexplored. In the present study, we report the first proteomic comparison between the mycelium and the yeast cells of H. capsulatum. Liquid chromatography coupled to mass spectrometry was used to evaluate the proteomic profile of the two phases of H. capsulatum growth, mycelium, and yeast. In summary, 214 and 225 proteins were only detected/or preferentially abundant in mycelium or yeast cells, respectively. In mycelium, enzymes related to the glycolytic pathway and to the alcoholic fermentation occurred in greater abundance, suggesting a higher use of anaerobic pathways for energy production. In yeast cells, proteins related to the tricarboxylic acid cycle and response to temperature stress were in high abundance. Proteins related to oxidative stress response or involved with cell wall metabolism were identified with differential abundance in both conditions. Proteomic data validation was performed by enzymatic activity determination, Western blot assays, or immunofluorescence microscopy. These experiments corroborated, directly or indirectly, the abundance of isocitrate lyase, 2-methylcitrate synthase, catalase B, and mannosyl-oligosaccharide-1,2-alpha-mannosidase in the mycelium and heat shock protein (HSP) 30, HSP60, glucosamine-fructose-6-phosphate aminotransferase, glucosamine-6-phosphate deaminase, and N-acetylglucosamine-phosphate mutase in yeast cells. The proteomic profile-associated functional classification analyses of proteins provided new and interesting information regarding the differences in metabolism between the two distinct growth forms of H. capsulatum.

Keywords: Histoplasma capsulatum; dimorphism; fungal biology; mycelium; proteomic analysis; yeast.


Conflict of interest statement

The authors declare that the research was conducted in the absence of any commercial or financial relationships that could be construed as a potential conflict of interest.

Figures

FIGURE 1
FIGURE 1
Proteome profile of Histoplasma capsulatum mycelium and yeast forms. (A) Venn diagram presenting the total number of proteins identified in extracts from both H. capsulatum morphologies (http://bioinformatics.psb.ugent.be/webtools/Venn/); (B) Functional classification of H. capsulatum proteins obtained by NanoUPLC-MSE analysis identified with preferential abundance in mycelium and yeast forms. The biological processes of the differentially expressed proteins in the isolates were obtained using the Uniprot (http://www.uniprot.org) and KEGG: Kyoto Encyclopedia of Genes and Genomes (www.genome.jp/kegg).
FIGURE 2
FIGURE 2
Comparison of protein profiles related to glycolysis and fermentation in H. capsulatum mycelium and yeast forms. A 50%-fold change was used as a cutoff to determine the differentially abundant proteins in the fungus yeast and mycelial forms. The Multi Experiment Viewer software V.4.9 was used to group and compare the abundance data. (A) The diagram representing the glycolytic and fermentation metabolic pathways represents differentially abundant proteins in the mycelium and yeast phases. Changes in the abundance levels in the mycelium compared with the yeast are represented in the heat map. Experimental triplicate mean values are presented for the lowest abundance (green) and the H. capsulatum proteins highest abundance (red) in the mycelium form. Black indicates that no significant difference was observed. GLGP, glycogen phosphorylase; HXK, hexokinase; GPI, glucose-6-phosphate isomerase; FBA, fructose-1,6-bisphosphate aldolase; PYK, pyruvate kinase; ADHs, alcohol dehydrogenases. (B) Ethanol quantification assay. The ethanol concentration (g/L) was determined in H. capsulatum yeast and mycelial phase cells, upon growth in Hams F12 media for 72 h (36°C) and 96 h (25°C), respectively. The cells were disrupted in the bead beater, and the ethanol compound was quantified using an enzymatic detection kit (UV-test for ethanol, RBiopharm, Darmstadt, Germany). Data are expressed as the mean ± standard deviation of biological triplicates in independent experiments. *p < 0.05.
FIGURE 3
FIGURE 3
Comparison of protein profiles related to pentose phosphate pathway and stress response in H. capsulatum mycelium and yeast forms. Dataset comparisons were carried out as cited in the Figure 2 legend. (A) The diagram representing the pentose phosphate and oxidative stress response pathways represents differentially abundant proteins in the mycelium and yeast phases. (B) Comparison of protein profiles related to the stress response in mycelium and yeast forms of H. capsulatum. Changes in the abundance levels in the mycelium compared with the yeast are represented in the heat map. Experimental triplicate mean values are presented for the lowest (green) and the highest (red) abundance of H. capsulatum proteins in the mycelium form. Black indicates that no significant difference was observed. G6PD, glucose 6 phosphate 1 dehydrogenase; PGL, 6-phosphogluconolactonase; PGD, 6-phosphogluconate dehydrogenase; SODs, superoxide dismutases; TRxR, thioredoxin reductase; CATs, catalases; C, cytochrome c peroxidases. Confirmatory Western blot analysis of selected proteins detected in the H. capsulatum proteomic analyses. Protein extracts are shown after the reaction with antibodies against the following proteins: (C) catalase; (D) HSP60; (E) HSP30; (F) β-tubulin, as a loading control. The blots were incubated with goat anti-mouse IgG polyclonal or goat anti-rabbit IgG polyclonal antibodies coupled to peroxidase and developed with SuperSignal West Dura Chemiluminescent substrate (Pierce, Rockford, IL, United States). The X-ray films were developed using Kodak imaging films according to the manufacturer’s instructions.
FIGURE 4
FIGURE 4
Comparison of protein profiles related to beta-oxidation, methylcitrate, and glyoxylate cycles in H. capsulatum mycelium and yeast forms. Dataset comparisons were carried out as cited in the Figure 2 legend. (A) The diagram representing the metabolic pathways of beta-oxidation, methylcitrate, and glyoxylate cycles represents differentially abundant proteins in the mycelium and yeast phases. Changes in the abundance levels in the mycelium compared with the yeast are represented in the heat map. Experimental triplicate mean values are presented for the lowest (green) and the highest (red) abundance of H. capsulatum proteins in the mycelium form. Black indicates that no significant difference was observed. ACDs, Acyl-Coa dehydrogenases; ECH, enoyl-Coa hydratase; ACAA, Acetyl-CoA acyltransferase; ACO, aconitase; ICL, isocitrate lyase; MLS, malate synthase; MCS, 2-methylcitrate synthase; MCD, 2-methylcitrate dehydratase; MCL, methylisocitrate lyase; (B) Isocitrate lyase (ICL) activity was determined by measuring glyoxylate formation as its phenylhydrazone derivative under the two conditions. The specific activity of ICL was determined as the amount of enzyme required to form 1 μmol of glyoxylate-phenylhydrazone per minute, per mg of total protein, and represented as U⋅mg-1. Errors bars represent standard deviation from three biological replicates. *p < 0.05. (C) Methylcitrate synthase measurement was determined in H. capsulatum yeast and mycelial phase cells, upon growth in Hams F12 media for 72 h (36°C) and 96°h (25°C), respectively. Activity was determined by nitrothiophenolate (2-mercapto-5-nitrobenzoate dianion) formation during the 5,5’-Dithiobis (2-nitrobenzoic acid) (DTNB) reaction with Coenzyme A, released during the condensation of oxaloacetate with propionyl-CoA.
FIGURE 5
FIGURE 5
Comparison of protein profiles related to amino acid metabolism in H. capsulatum mycelium and yeast forms. Dataset comparisons were carried out as cited in the Figure 2 legend. Changes in the abundance levels in the mycelium compared with the yeast are represented in the heat map. Experimental triplicate mean values are presented for the lowest (green) and the highest (red) abundance of H. capsulatum proteins in the mycelium form. Black indicates that no significant difference was observed.
FIGURE 6
FIGURE 6
Comparison of protein profiles related to tricarboxylic acid (TCA) cycle and oxidative phosphorylation in H. capsulatum mycelium and yeast forms. Dataset comparisons were carried out as cited in the Figure 2 legend. The diagram representing the metabolic pathways of TCA cycle and oxidative phosphorylation represents differentially abundant proteins in the mycelium and yeast phases. Changes in the abundance levels in the mycelium compared with the yeast are represented in the heat map. Experimental triplicate mean values are presented for the lowest (green) and the highest (red) abundance of H. capsulatum proteins in the mycelium form. Black indicates that no significant difference was observed. Pdx1, pyruvate dehydrogenase; ACO1, aconitate hydratase; IDH, isocitrate dehydrogenase; KGDH, alpha-ketoglutarate dehydrogenase; SCL, succinyl-Coa ligase; SDH, succinate dehydrogenase; FRD, fumarate reductase.
FIGURE 7
FIGURE 7
Comparison of protein profiles related to the metabolism of compounds present in the H. capsulatum mycelium and yeast forms the cell wall. Dataset comparisons were carried out as cited in the Figure 2 legend. Changes in the abundance levels in the mycelium compared with the yeast are represented in the heat map. Experimental triplicate mean values are presented for the lowest (green) and the highest (red) abundance of H. capsulatum proteins in the mycelium form. Black indicates that no significant difference was observed.
FIGURE 8
FIGURE 8
Histoplasma capsulatum cell wall composition from mycelium and yeast cells. Immunofluorescence microscopy showing the labeling pattern of H. capsulatum mycelium (A,C) and yeast cells (B,D) by Con A–FITC, WGA-Fc (Alexa 546), Uvitex 2B, and Dectin-Fc. (E) Arbitrary fluorescence intensity of markers presented in previous panels. N. S., not significant; *p < 0.05; ****p < 0.0001.

Similar articles

Cited by

References

    1. Almeida M. A., Almeida-Paes R., Guimarães A. J., Valente R. H., Soares C. M. A., Zancopé-Oliveira R. M. (2020). Immunoproteomics reveals pathogen’s antigens involved in Homo sapiens-Histoplasma capsulatum interaction and specific linear B-cell epitopes in histoplasmosis. Front. Cell. Infect. Microbiol. 29:591121. 10.3389/fcimb.2020.591121 - DOI - PMC - PubMed
    1. Almeida-Paes R., Almeida-Silva F., Pinto G. C. M., Almeida M. A., Muniz M. M., Pizzini C. V., et al. (2018). L-tyrosine induces the production of a pyomelanin-like pigment by the parasitic yeast-form of Histoplasma capsulatum. Med. Mycol. 56 506–509. 10.1093/mmy/myx068 - DOI - PMC - PubMed
    1. Armstrong P. A., Jackson B. R., Haselow D., Fields V., Ireland M., Austin C., et al. (2018). Multistate epidemiology of histoplasmosis, United States, 2011-2014. Emerg. Infect. Dis. 24 425–431. 10.3201/eid2403.171258 - DOI - PMC - PubMed
    1. Baeza L. C., da Mata F. R., Pigosso L. L., Pereira M., de Souza G. H. M. F., Coelho A. S. G., et al. (2017). Differential metabolism of a two-carbon substrate by members of the Paracoccidioides Genus. Front. Microbiol. 8:2308. 10.3389/fmicb.2017.02308 - DOI - PMC - PubMed
    1. Beyhan S., Gutierrez M., Voorhies M., Sil A. (2013). A temperature-responsive network links cell shape and virulence traits in a primary fungal pathogen. PLoS Biol. 11:e1001614. 10.1371/journal.pbio.1001614 - DOI - PMC - PubMed