. 2021 Jun 8:12:647373.
doi: 10.3389/fmicb.2021.647373. eCollection 2021.

A New Ciboria sp. for Soil Mycoremediation and the Bacterial Contribution to the Depletion of Total Petroleum Hydrocarbons

Affiliations

A New Ciboria sp. for Soil Mycoremediation and the Bacterial Contribution to the Depletion of Total Petroleum Hydrocarbons

Simone Becarelli et al. Front Microbiol. .

Abstract

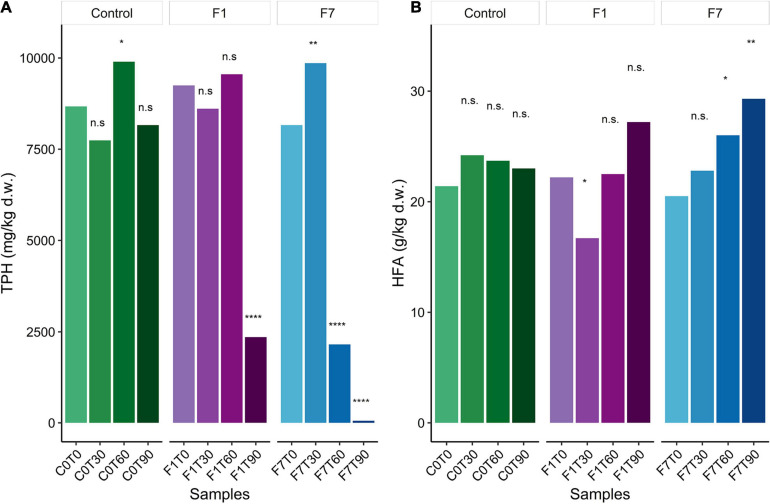
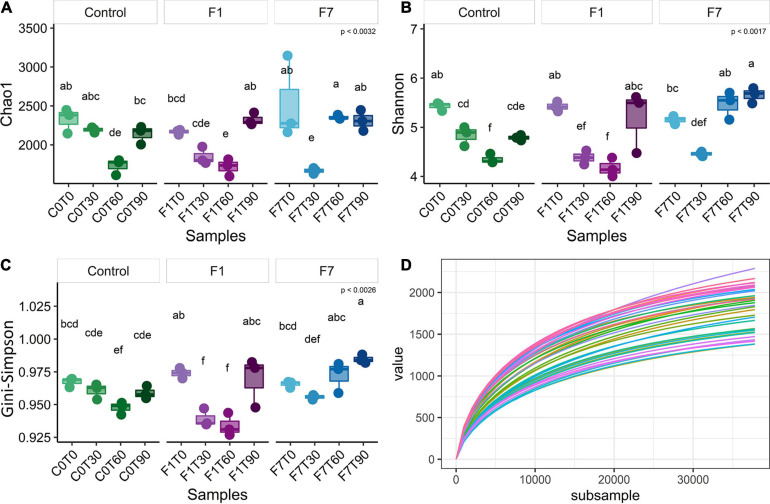
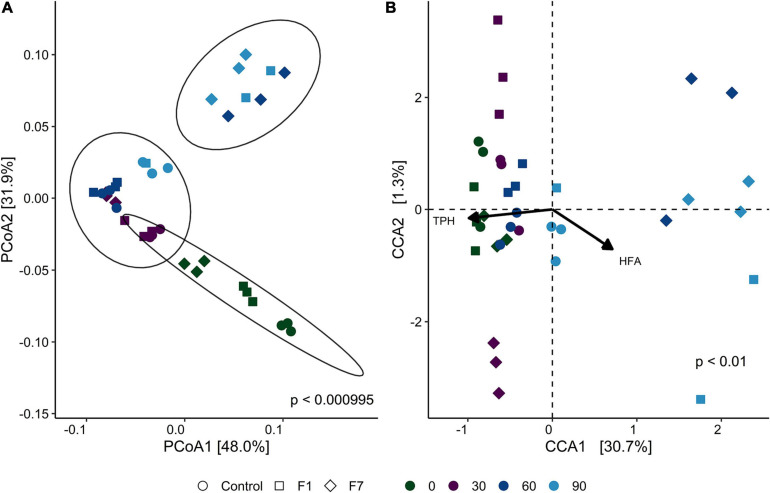
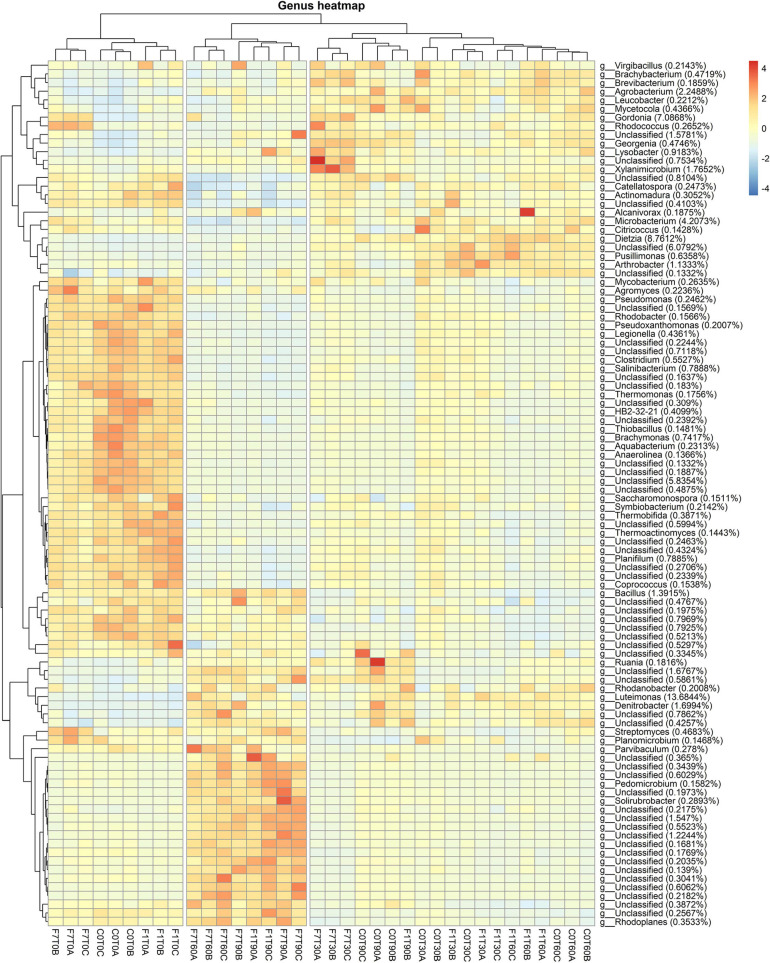
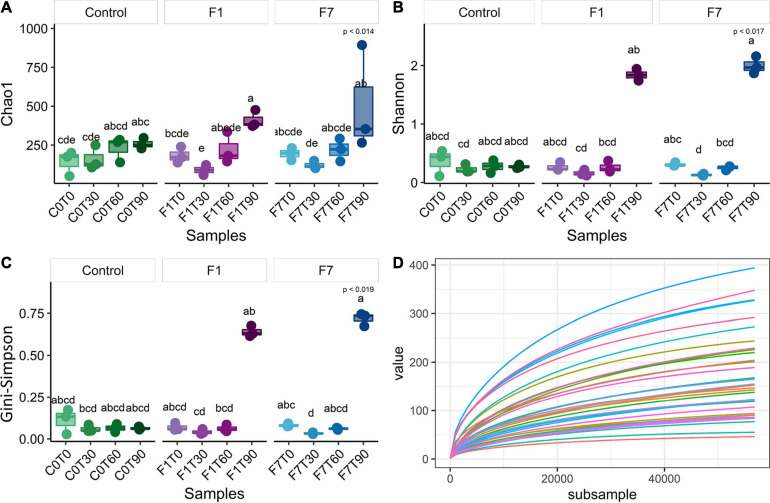
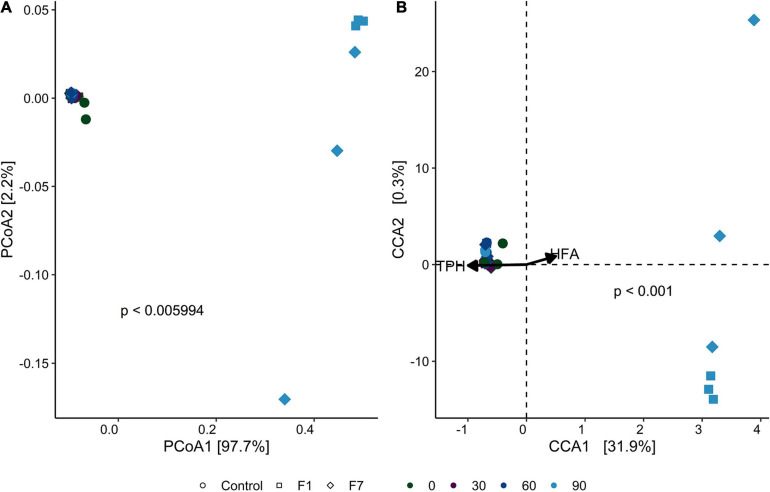
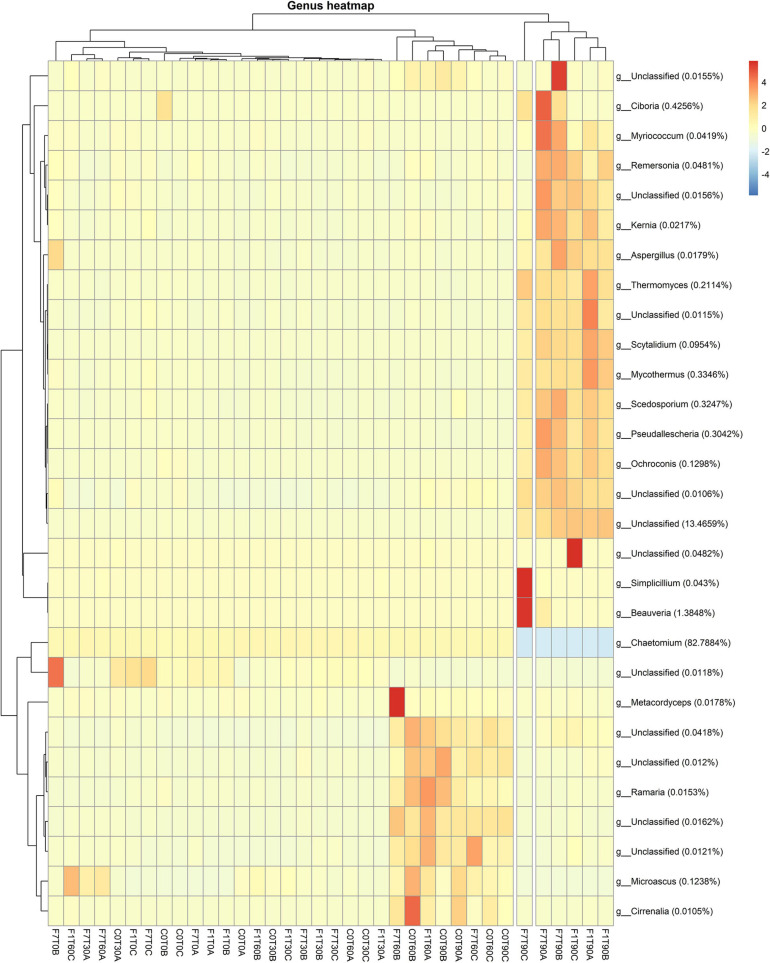
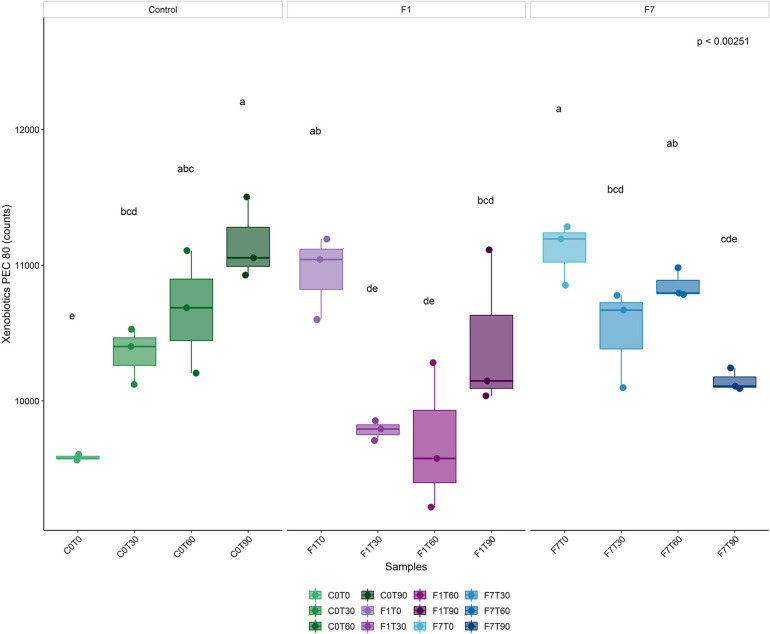
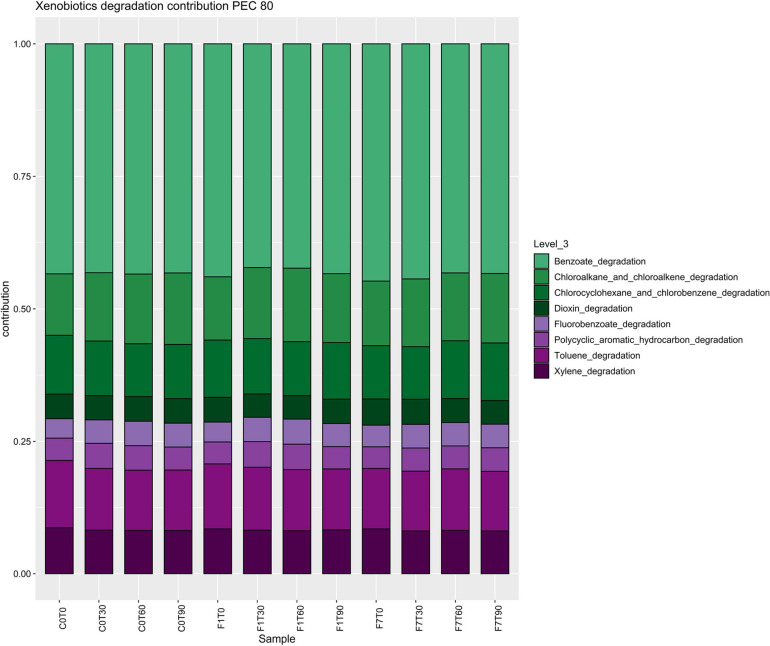
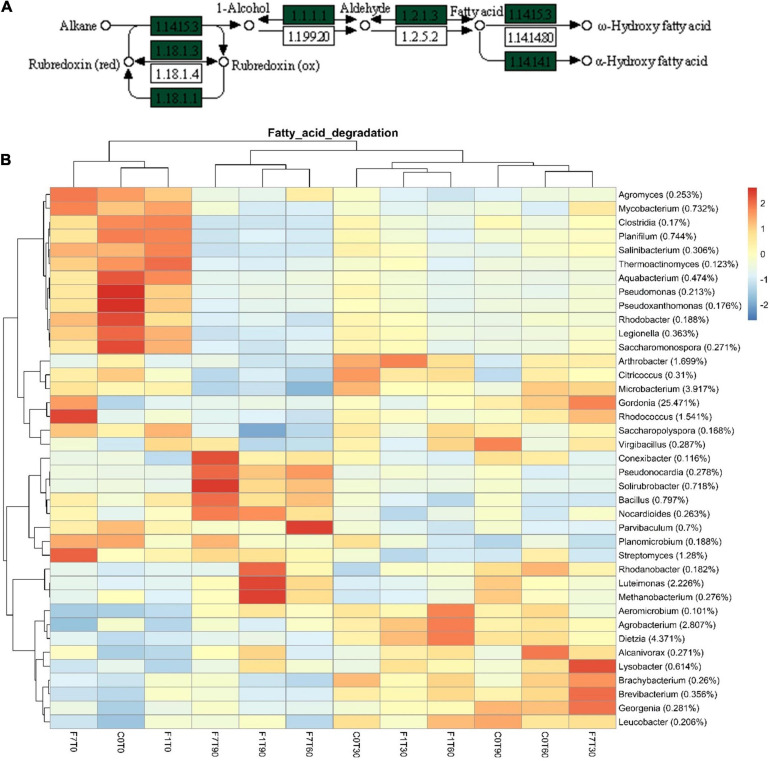
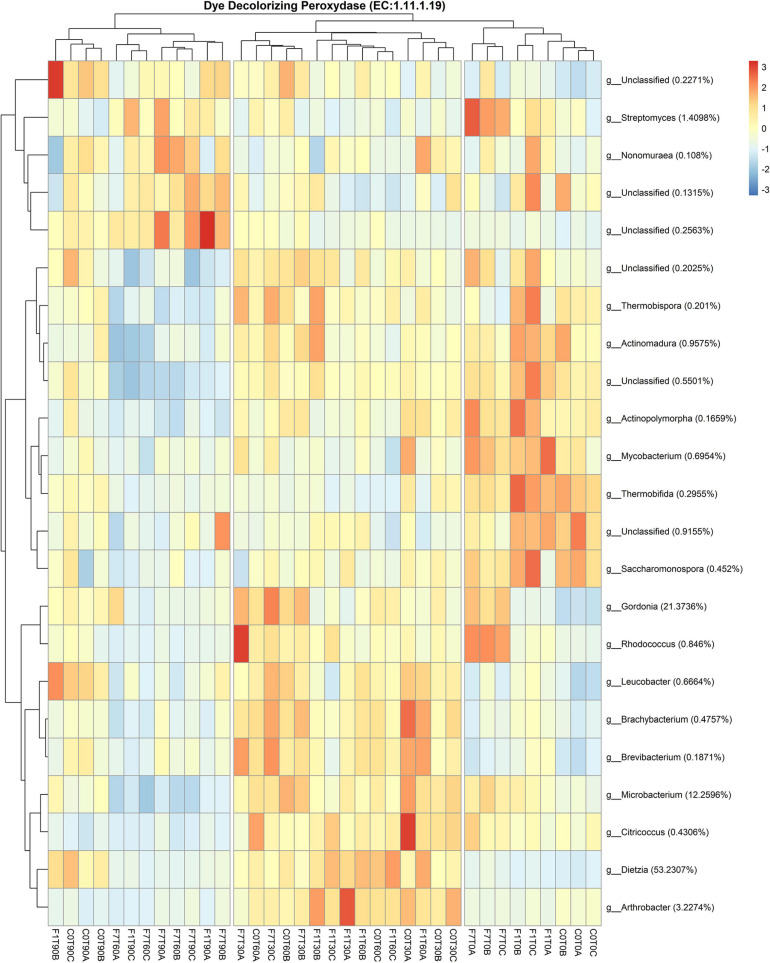
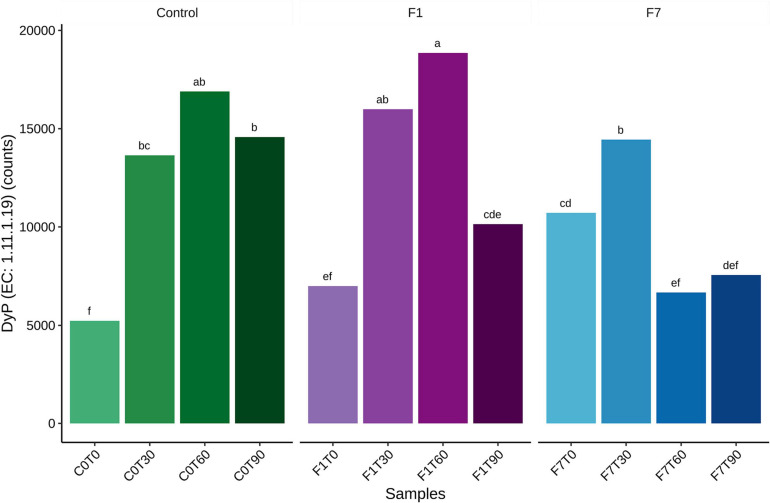
A Ciboria sp. strain (Phylum Ascomycota) was isolated from hydrocarbon-polluted soil of an abandoned oil refinery in Italy. The strain was able to utilize diesel oil as a sole carbon source for growth. Laboratory-scale experiments were designed to evaluate the use of this fungal strain for treatment of the polluted soil. The concentration of total petroleum hydrocarbons (TPH) in the soil was 8,538 mg/kg. Mesocosms containing the contaminated soil were inoculated with the fungal strain at 1 or 7%, on a fresh weight base ratio. After 90 days of incubation, the depletion of TPH contamination was of 78% with the 1% inoculant, and 99% with the 7% inoculant. 16S rDNA and ITS metabarcoding of the bacterial and fungal communities was performed in order to evaluate the potential synergism between fungi and bacteria in the bioremediation process. The functional metagenomic prediction indicated Arthrobacter, Dietzia, Brachybacerium, Brevibacterium, Gordonia, Leucobacter, Lysobacter, and Agrobacterium spp. as generalist saprophytes, essential for the onset of hydrocarbonoclastic specialist bacterial species, identified as Streptomyces, Nocardoides, Pseudonocardia, Solirubrobacter, Parvibaculum, Rhodanobacter, Luteiomonas, Planomicrobium, and Bacillus spp., involved in the TPH depletion. The fungal metabolism accelerated the onset of specialist over generalist bacteria. The capacity of the Ciboria sp. to deplete TPH in the soil in treatment was also ascertained.

Keywords: Ciboria sp.; dye-decolorizing peroxidases DyP; functional metagenomic prediction; generalist bacterial species; mycoremediation; specialist bacterial species; total petroleum hydrocarbons.


Conflict of interest statement

The authors declare that the research was conducted in the absence of any commercial or financial relationships that could be construed as a potential conflict of interest.

Figures

FIGURE 1
FIGURE 1
(A) Average of Total Petroleum Hydrocarbon (TPH) content for datapoint triplicates, expressed as mg/kg per dry weight (ppm); (B) Average of humic and fulvic acids (HFA) content for datapoint triplicates, expressed as g/kg per dry weight (‰). Statistical significance was assessed by two-way RM ANOVA test (Days = matching factor) followed by Dunnett post-hoc test corrected for multiple comparisons. Group labels represent statistical significance against 0 Days datapoint within each Treatment (C0, control mesocosms, F1, F7) at α = 0.05 : n.s., not significative, *corrected p-value < 0.05, **corrected p-value < 0.01, ****corrected p-value < 0.0001.
FIGURE 2
FIGURE 2
(A) Chao1 index, (B) Shannon index, (C) Gini–Simpson index (1-λ), and (D) rarefaction curves of observed species of bacterial community composition. Each sample was rarefied at 37,809 counts, and the distribution of three biological replicates per sample is reported. Box and whiskers hinges represent the first and third quartiles, upper and lower whiskers represent the furthest datapoints from median. Reported p-value is calculated by Kruskal–Wallis test (α = 0.05). Group letters represent statistical significance at α = 0.05, based on Fisher LSD post-hoc test, with Benjamini–Hochberg correction for multiple comparisons: groups sharing one or more letters are not significantly dissimilar.
FIGURE 3
FIGURE 3
(A) Principal component analysis (PCoA) of bacterial communities, based on weighted UniFrac distance for each sample triplicate. Point shapes represent treatment category, while color indicates time category. The percentage reported on axes represent the amount of total variance depicted by each of them. P-value was calculated by ADONIS function (Vegan R package) between weighted UniFrac distances and sample groups, using the Bray–Curtis method with 1,000 repetitions. UPGMA hierarchical clustering was performed on the same distances. Circles enclose sample groups, which share a dendrogram height = 0.20. (B) Canonical correspondence analysis (CCA) biplot that shows correlation between amplicon sequence variant (ASV) composition of each sample triplicate and the environmental parameters total petroleum hydrocarbon concentration (TPH) and humic and fulvic acid concentration (HFA). Point shapes represent treatment category, while color indicate time category. Black arrows are the eigen-vectors representing constraining variables. Eigen-values of constrained axes are 0.16211 for CCA1 and 0.00856 for CCA2. Of the total inertia, 32% is explained by CCA1 and CCA2 axes. Reported p-value is calculated by PERMANOVA test performed on full model ASV − TPH + HFA with 999 permutations.
FIGURE 4
FIGURE 4
Heatmap showing bacterial ASV abundances per sample at genus level with a cut-off of 0.01%. Hierarchical clustering was performed on both rows and columns by Pearson correlation, based on Euclidean distance. Color scheme represents row-wise Z-scores of ASV counts. Percentage reported near ASV names represent the relative abundance of the sum of ASV counts per sample against total sum (i.e., Z = 0 matches reported percentage).
FIGURE 5
FIGURE 5
(A) Chao1 index, (B) Shannon index, (C) Gini–Simpson index (1-λ), and (D) rarefaction curves of observed species of fungal community composition. Each sample was rarefied at 56,830 counts, and the distribution of three biological replicates per sample is reported. Box and whiskers hinges represent first and third quartiles; upper and lower whiskers represent the furthest datapoints from median. Reported p-value is calculated by Kruskal–Wallis test (α = 0.05). Group letters represent statistical significance at α = 0.05, based on Fisher LSD post-hoc test, with Benjamini–Hochberg correction for multiple comparisons: groups sharing one or more letters are not significantly dissimilar.
FIGURE 6
FIGURE 6
(A) Principal component analysis (PCoA) of fungal communities, based on weighted UniFrac distance for each sample triplicate. Point shapes represent treatment category, while color indicates time category. The percentage reported on axes represent the amount of total variance depicted by each of them. P-value was calculated by ADONIS function (Vegan R package) between weighted UniFrac distances and sample groups, using the Bray–Curtis method with 1,000 repetitions. (B) Canonical correspondence analysis (CCA) biplot that shows correlation between ASV composition of each sample triplicate and the environmental parameters total petroleum hydrocarbon concentration (TPH) and humic and fulvic acid concentration (HFA). Point shapes represent treatment category, while color indicates time category. Black arrows are the eigen-vectors representing constraining variables. Eigen-values of constrained axes are 0.3952 for CCA1 and 0.0042 for CCA2. Of the total inertia, 32% is explained by CCA1 and CCA2 axes. Reported p-value is calculated by PERMANOVA test performed on full model ASV − TPH + HFA with 999 permutations.
FIGURE 7
FIGURE 7
Heatmaps showing fungal ASV abundances per sample at genus level with a cut-off of 0.01%. Hierarchical clustering was performed on both rows and columns by Pearson correlation, based on Euclidean distance. Color scheme represents row-wise Z-scores of ASV counts per sample. Percentage reported near ASV names represents the relative abundance of the sum of ASV counts per sample against total sum (i.e., Z = 0 matches reported percentage). Unclassified groups were not pooled.
FIGURE 8
FIGURE 8
Boxplot representing total bacterial contributions to Xenobiotic biodegradation functional profile (Level 2) with a Pathway Exclusion Cut-off (PEC) of 80% (i.e., only contributions that contain 80% of genes/enzymes that constitute the pathway are taken into account), as calculated by iVikodak server. Box and whiskers hinges represent first and third quartiles; upper and lower whiskers represent the furthest datapoints from median. Reported p-value is calculated by Kruskal–Wallis test (α = 0.05). Group letters represent statistical significance at α = 0.05, based on Fisher LSD post-hoc test, with Benjamini–Hochberg correction for multiple comparisons: groups sharing one or more letters are not significantly dissimilar.
FIGURE 9
FIGURE 9
Stacked barplot representing composition of bacterial contributions to xenobiotic degradation pathways, depicted in Figure 8. Each bar represents the average of three replicates.
FIGURE 10
FIGURE 10
(A) Particular of fatty acid degradation pathway map (map00071) depicting aliphatic hydrocarbon degradation. Green labels indicate the presence of enzymatic features among those inferred in metagenome. (B) Heatmap showing bacterial contributions to fatty acid degradation pathway in metagenome, as calculated by iVikodak server, with a PEC of 80%. Reported taxonomic resolution is genus level, with a cut-off of 0.1%. Hierarchical clustering was performed on both rows and columns by Pearson correlation, based on Euclidean distance. Color scheme represents row-wise Z-scores of contribution counts per ASV. Percentage reported near ASV names represents the relative abundance of the sum of ASV contributions per sample against total sum (i.e., Z = 0 matches reported percentage).
FIGURE 11
FIGURE 11
Heatmap showing Bacterial contribution to Dye decolorizing peroxidase (EC:1.11.1.19) in metagenome, as calculated by PICRUSt 2. Reported taxonomic resolution is genus level, with a cut-off of 0.1%. Hierarchical clustering was performed on both rows and columns by Pearson correlation, based on Euclidean distance. Colour scheme represents row-wise Z-scores of contribution counts per ASV. Percentage reported near ASV names represent the relative abundance of the sum of ASV contributions per sample against total sum (i.e. Z = 0 matches reported percentage). Unclassified ASV contribution were not pooled.
FIGURE 12
FIGURE 12
Average of total bacterial contributions to dye decolorizing peroxidase (DyP) for each datapoint triplicate. Statistical significance was assessed by Friedman test followed by Fisher LSD post-hoc test with Benjamini–Hochberg FDR corrected for multiple comparisons. Group labels represent statistical significance at α = 0.05. Groups sharing one or more letters are not significantly dissimilar.

Similar articles

Cited by

References

    1. Altschul S. F., Madden T. L., Schäffer A. A., Zhang J., Zhang Z., Miller W., et al. (1997). Gapped BLAST and PSI-BLAST: a new generation of protein database search programs. Nucleic Acids Res. 25 3389–3402. 10.1093/nar/25.17.3389 - DOI - PMC - PubMed
    1. Arora P. K. (2020). Bacilli-mediated degradation of xenobiotic compounds and heavy metals. Front. Bioeng. Biotechnol. 8:570307. 10.3389/fbioe.2020.570307 - DOI - PMC - PubMed
    1. Bacosa H. P., Inoue C. (2015). Polycyclic aromatic hydrocarbons (PAHs) biodegradation potential and diversity of microbial consortia enriched from tsunami sediments in Miyagi. Japan. J. Hazard. Mater. 283 689–697. 10.1016/j.jhazmat.2014.09.068 - DOI - PubMed
    1. Bai Y., Huang X., Zhou X., Xiang Q., Zhao K., Yu X., et al. (2019). Variation in the nitrous oxide reductase gene (nosZ)-denitrifying bacterial community in different primary succession stages in the Hailuogou Glacier retreat area, China. PeerJ 7:e7356. 10.7717/peerj.7356 - DOI - PMC - PubMed
    1. Baldrian P. (2004). Increase of laccase activity during interspecific interactions of white-rot fungi. FEMS Microbiol. Ecol. 50 245–253. 10.1016/j.femsec.2004.07.005 - DOI - PubMed