

Early-Life Intervention Using Exogenous Fecal Microbiota Alleviates Gut Injury and Reduce Inflammation Caused by Weaning Stress in Piglets
- PMID: 34177852
- PMCID: PMC8222923
- DOI: 10.3389/fmicb.2021.671683
Early-Life Intervention Using Exogenous Fecal Microbiota Alleviates Gut Injury and Reduce Inflammation Caused by Weaning Stress in Piglets
Abstract
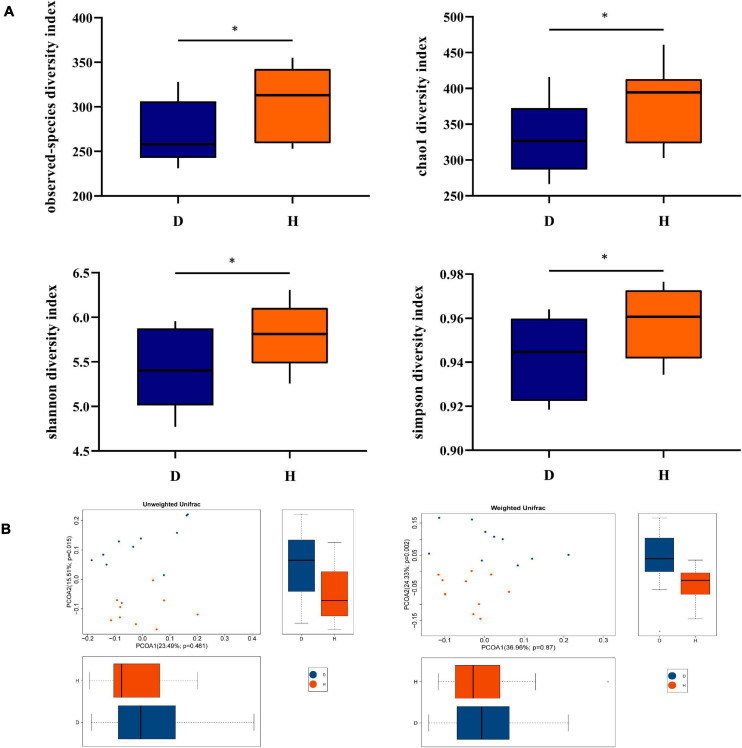
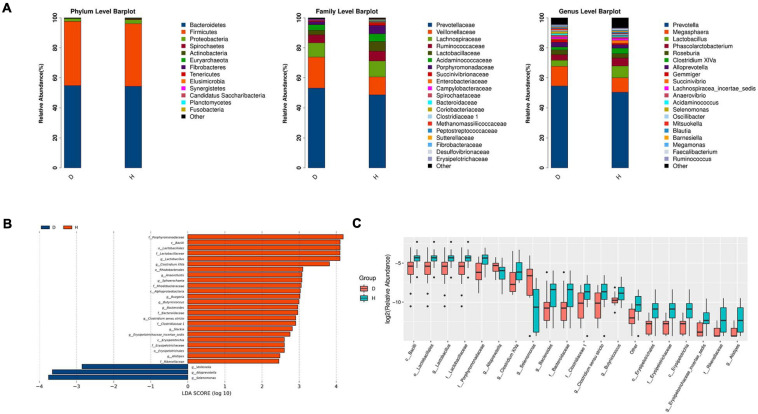
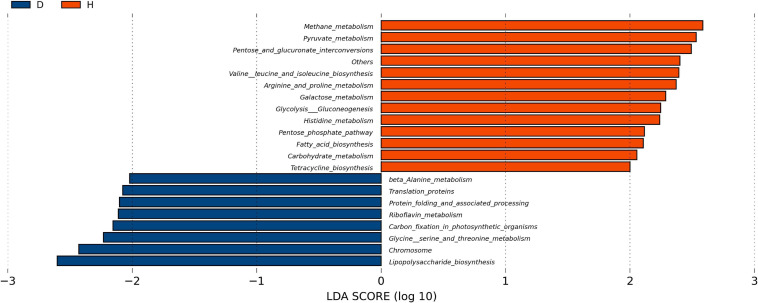
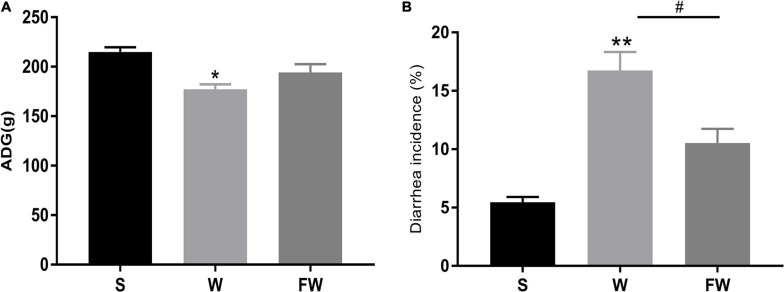
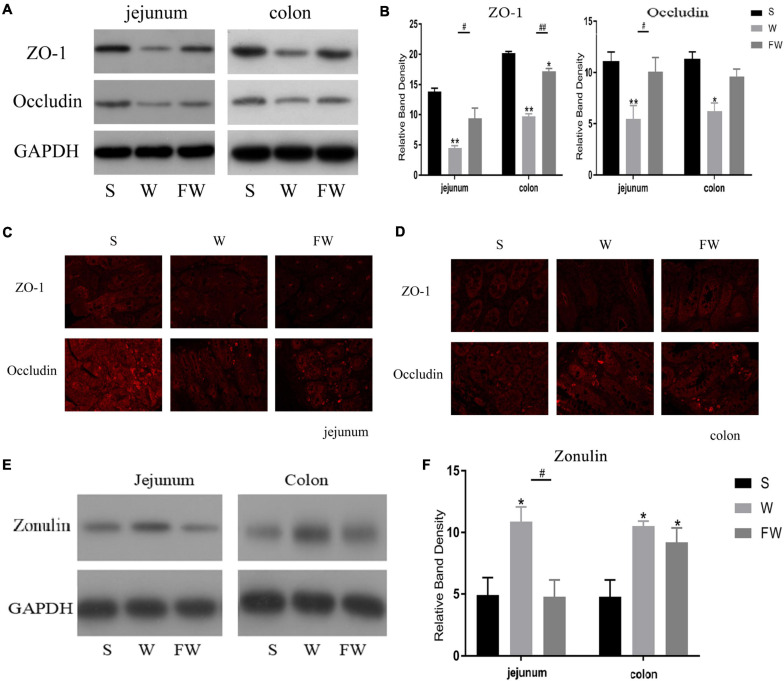
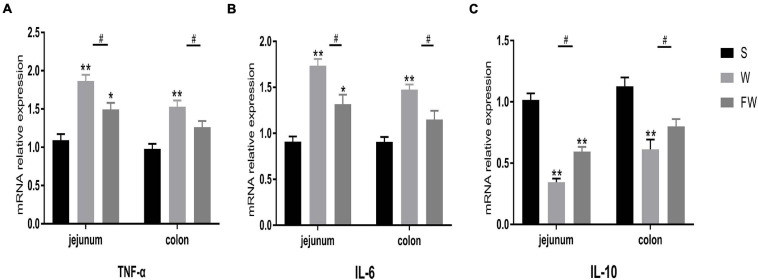
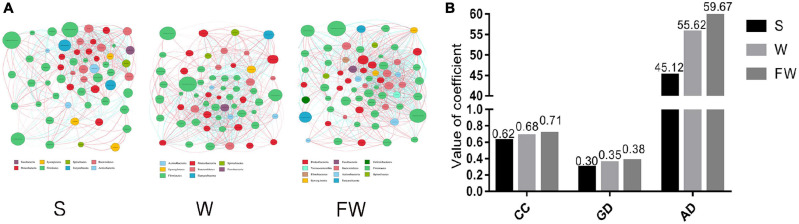
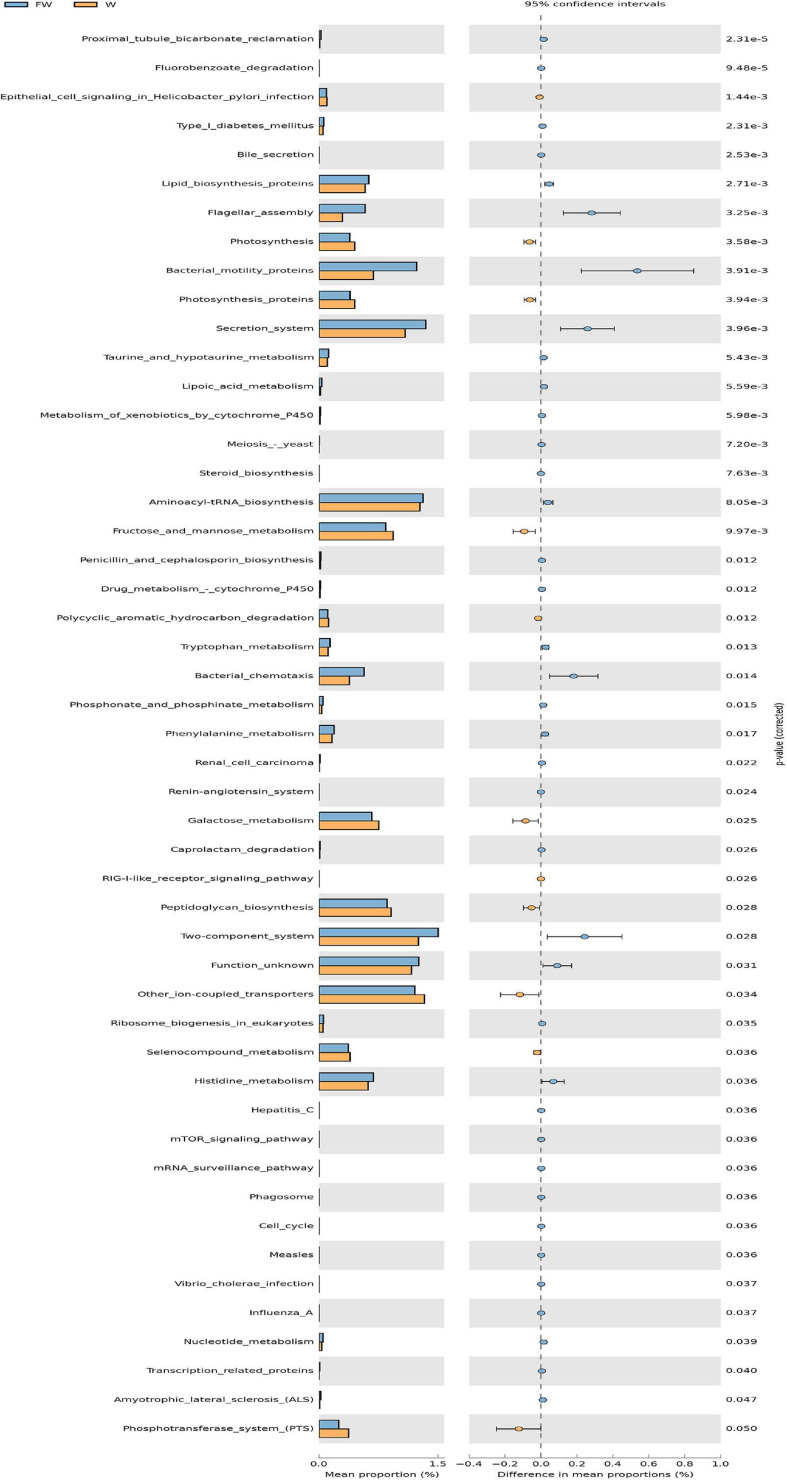
Fecal microbiota transplantation (FMT) could shape the structure of intestinal microbiota in animals. This study was conducted to explore the changes that happen in the structure and function of microbiota caused by weaning stress, and whether early-life FMT could alleviate weaning stress through modifying intestinal microbiota in weaned piglets. Diarrheal (D) and healthy (H) weaned piglets were observed, and in the same farm, a total of nine litters newborn piglets were randomly allocated to three groups: sucking normally (S), weaned at 21 d (W), and early-life FMT + weaned at 21 d (FW). The results demonstrated that differences of fecal microbiota existed in group D and H. Early-life FMT significantly decreased diarrhea incidence of weaned piglets. Intestinal morphology and integrity were improved in the FW group. Both ZO-1 and occludin (tight junction proteins) of jejunum were greatly enhanced, while the zonulin expression was significantly down-regulated through early-life FMT. The expression of IL-6 and TNF-α (intestinal mucosal inflammatory cytokines) were down-regulated, while IL-10 (anti-inflammatory cytokines) was up-regulated by early-life FMT. In addition, early-life FMT increased the variety of the intestinal microbial population and the relative amounts of some beneficial bacteria such as Spirochaetes, Akkermansia, and Alistipes. Functional alteration of the intestinal microbiota revealed that lipid biosynthesis and aminoacyl-tRNA biosynthesis were enriched in the FW group. These findings suggested that alteration of the microbiota network caused by weaning stress induced diarrhea, and early-life FMT alleviated weaning stress in piglets, which was characterized by decreased diarrhea incidence, improved intestinal morphology, reduced intestinal inflammation, and modified intestinal bacterial composition and function.
Keywords: diarrhea; fecal microbiota transplantation; intestinal microbiota; piglets; weaning stress.
Copyright © 2021 Ma, Zhang, Xu, Qian, Yang, Zhan and Han.
Conflict of interest statement
The authors declare that the research was conducted in the absence of any commercial or financial relationships that could be construed as a potential conflict of interest.
Figures


Similar articles
-
Early-Life Intervention Using Fecal Microbiota Combined with Probiotics Promotes Gut Microbiota Maturation, Regulates Immune System Development, and Alleviates Weaning Stress in Piglets.Int J Mol Sci. 2020 Jan 13;21(2):503. doi: 10.3390/ijms21020503. Int J Mol Sci. 2020. PMID: 31941102 Free PMC article.
-
Fecal Microbiota Transplantation Beneficially Regulates Intestinal Mucosal Autophagy and Alleviates Gut Barrier Injury.mSystems. 2018 Oct 9;3(5):e00137-18. doi: 10.1128/mSystems.00137-18. eCollection 2018 Sep-Oct. mSystems. 2018. PMID: 30320222 Free PMC article.
-
Dietary Quercetin Supplementation Attenuates Diarrhea and Intestinal Damage by Regulating Gut Microbiota in Weanling Piglets.Oxid Med Cell Longev. 2021 Dec 13;2021:6221012. doi: 10.1155/2021/6221012. eCollection 2021. Oxid Med Cell Longev. 2021. Retraction in: Oxid Med Cell Longev. 2024 Jan 9;2024:9869280. doi: 10.1155/2024/9869280. PMID: 34950418 Free PMC article. Retracted.
-
Dietary nutrition, intestinal microbiota dysbiosis and post-weaning diarrhea in piglets.Anim Nutr. 2024 Feb 28;17:188-207. doi: 10.1016/j.aninu.2023.12.010. eCollection 2024 Jun. Anim Nutr. 2024. PMID: 38800735 Free PMC article. Review.
-
Weaning stress and intestinal health of piglets: A review.Front Immunol. 2022 Nov 24;13:1042778. doi: 10.3389/fimmu.2022.1042778. eCollection 2022. Front Immunol. 2022. PMID: 36505434 Free PMC article. Review.
Cited by
-
Traditional Chinese medicine prescriptions (XJZ, JSS) ameliorate spleen inflammatory response and antioxidant capacity by synergistically regulating NF-κB and Nrf2 signaling pathways in piglets.Front Vet Sci. 2022 Sep 16;9:993018. doi: 10.3389/fvets.2022.993018. eCollection 2022. Front Vet Sci. 2022. PMID: 36187836 Free PMC article.
-
The Role of Probiotics in Alleviating Postweaning Diarrhea in Piglets From the Perspective of Intestinal Barriers.Front Cell Infect Microbiol. 2022 May 30;12:883107. doi: 10.3389/fcimb.2022.883107. eCollection 2022. Front Cell Infect Microbiol. 2022. PMID: 35711653 Free PMC article. Review.
-
Sheep-Derived Lactobacillus johnsonii M5 Enhances Immunity and Antioxidant Capacity, Alleviates Diarrhea, and Improves Intestinal Health in Early-Weaned Lambs.Microorganisms. 2025 Feb 13;13(2):404. doi: 10.3390/microorganisms13020404. Microorganisms. 2025. PMID: 40005770 Free PMC article.
-
Effects of early-life cecal microbiota transplantation from divergently selected inbred chicken lines on growth, gut serotonin, and immune parameters in recipient chickens.Poult Sci. 2022 Jul;101(7):101925. doi: 10.1016/j.psj.2022.101925. Epub 2022 Apr 22. Poult Sci. 2022. PMID: 35613492 Free PMC article.
-
Oral and Parenteral Vaccination against Escherichia coli in Piglets Results in Different Responses.Animals (Basel). 2022 Oct 14;12(20):2758. doi: 10.3390/ani12202758. Animals (Basel). 2022. PMID: 36290144 Free PMC article.
References
-
- Allen H. K., Trachsel J., Looft T., Casey T. A. (2014). Finding alternatives toantibiotics. Ann. N. Y. Acad. Sci. 1323 91–100. - PubMed
LinkOut - more resources
Full Text Sources