. 2021 Jun 8:12:638066.
doi: 10.3389/fimmu.2021.638066. eCollection 2021.

Cross-Tissue Transcriptomic Analysis Leveraging Machine Learning Approaches Identifies New Biomarkers for Rheumatoid Arthritis

Affiliations

Cross-Tissue Transcriptomic Analysis Leveraging Machine Learning Approaches Identifies New Biomarkers for Rheumatoid Arthritis

Dmitry Rychkov et al. Front Immunol. .

Abstract

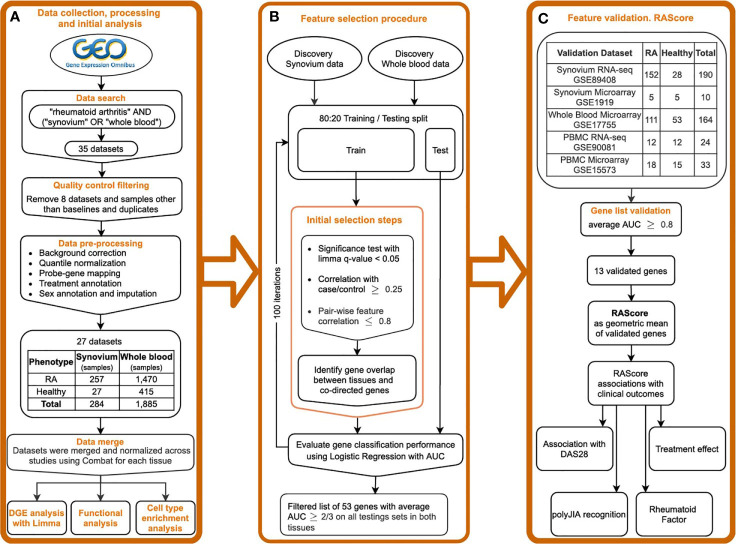
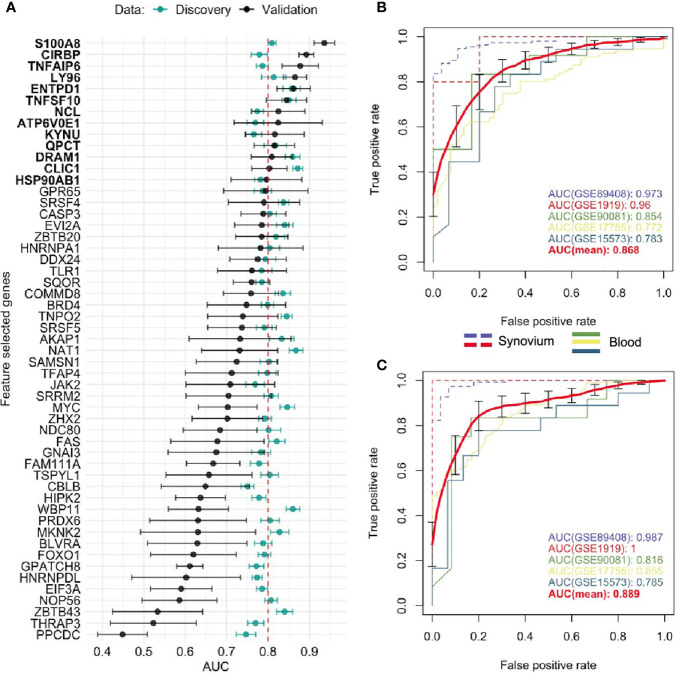
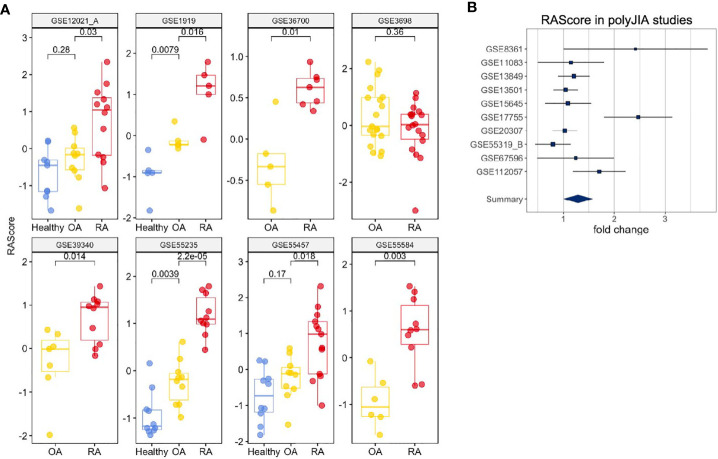
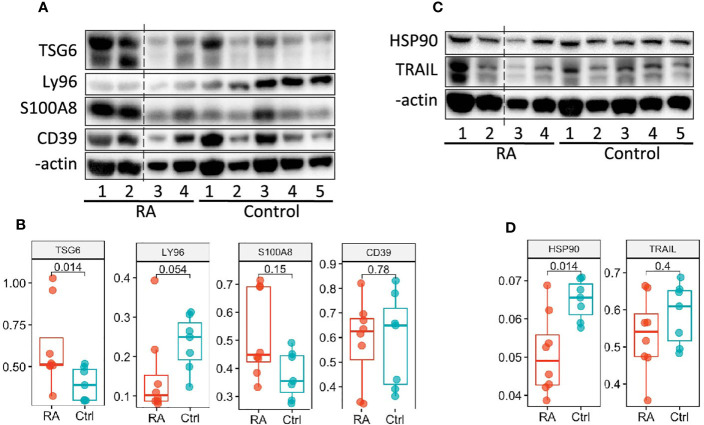
There is an urgent need to identify biomarkers for diagnosis and disease activity monitoring in rheumatoid arthritis (RA). We leveraged publicly available microarray gene expression data in the NCBI GEO database for whole blood (N=1,885) and synovial (N=284) tissues from RA patients and healthy controls. We developed a robust machine learning feature selection pipeline with validation on five independent datasets culminating in 13 genes: TNFAIP6, S100A8, TNFSF10, DRAM1, LY96, QPCT, KYNU, ENTPD1, CLIC1, ATP6V0E1, HSP90AB1, NCL and CIRBP which define the RA score and demonstrate its clinical utility: the score tracks the disease activity DAS28 (p = 7e-9), distinguishes osteoarthritis (OA) from RA (OR 0.57, p = 8e-10) and polyJIA from healthy controls (OR 1.15, p = 2e-4) and monitors treatment effect in RA (p = 2e-4). Finally, the immunoblotting analysis of six proteins on an independent cohort confirmed two proteins, TNFAIP6/TSG6 and HSP90AB1/HSP90.

Keywords: biomarker; blood; gene expression; machine learning; rheumatoid arthritis; synovium.


Conflict of interest statement

The authors declare that the research was conducted in the absence of any commercial or financial relationships that could be construed as a potential conflict of interest.

Figures

Figure 1
Figure 1
Study overview. (A) Public data collection, processing and DGE analysis. (B) Feature selection pipeline. (C) Gene list validation on the independent datasets. Introducing the RA Score as a geometric mean of validated genes and its association with clinical outcomes.
Figure 2
Figure 2
DE genes overlapped between synovium and whole blood tissues. Top Reactome common and different pathways for (A) Up-regulated and (B) downregulated genes. (C) Venn diagram of up- and down-regulated genes in synovium and blood: 29 common up-regulated genes (p =3e-09) and 4 common downregulated genes (p = 0.28). (D) Comparison scatter plot of fold changes between common genes in synovium and blood. Heatmap and PCA plots of common genes in (E, F) synovium and (G, H) blood. Vertical bars in the heatmap plots represent the color-coded coefficients of variation, Pearson correlations and log2 fold changes.
Figure 3
Figure 3
Cell type enrichment analysis for synovium and whole blood tissues. 30 cell types were significant (BH adj p-values < 0.05) in synovium and 20 were significant in whole blood with 11 common cell types between the tisuues. Heatmap plots of significantly enriched cell types in (A) synovium and (B) blood. The scatter plots comparing log10 transformed fold changes of significant cell types between synovium and blood in (C) discovery and (D) validation cohorts. The scatter plots comparing log10 transformed fold changes of significant cell types between discovery and validation cohorts in (E) synovium and (F) blood tissues, with Pearson correlation coefficient and it's p-value.
Figure 4
Figure 4
Feature selected genes. (A) Mean AUC performance with standard error for each feature selected gene on testing synovium and blood datasets (green) and on five independent validation datasets (black). 13 genes with AUC greater than 0.8 on validation datasets were chosen as the best performing genes. Mean AUC performance with standard errors of a RF model trained on discovery blood data with (B) common DE genes and (C) feature selected genes on five independent validation datasets. The discovery-based classifiers were held fixed and used once on each validation dataset.
Figure 5
Figure 5
Clinical Interpretation of the RA Score. (A) The RA Score distinguishes Healthy, OA and RA samples in synovium. (B) The RA Score distinguishes Healthy and polyJIA samples. The p-values were obtained using Student’s t-test.
Figure 6
Figure 6
Validation of the RA Score proteins. (A, C) Immunoblot analysis of 6 RA Score proteins in unstimulated PBMC lysates from subjects with RA (n=4) and healthy controls (n=5). Data representative of 2 immunoblots. (B, D) Box plots are quantification of RA Score protein levels normalized to GAPDH pooled from 2 immunoblot experiments [as shown in (A, C) and Supplemental Figure 8 ]; RA (n=8) and healthy control (n=7) samples. Significance determined by Mann-Whitney-Wilcoxon test, (B, D). Dotted line represents lanes removed from non-RA subjects, otherwise immunoblots a and d are montages of the same western blot.

References

    1. Battisha A, Sawalha K, Altibi AM, Madoukh B, Al-Akchar M, Patel B. Cardiogenic Shock in Autoimmune Rheumatologic Diseases: An Insight on Etiologies, Management, and Treatment Outcomes. Heart Fail Rev (2020). 10.1007/s10741-020-09990-4 - DOI - PubMed
    1. Lai C-H, Hsieh C-Y, Barnado A, Huang L-C, Chen S-C, Tsai L-M, et al. . Outcomes of Acute Cardiovascular Events in Rheumatoid Arthritis and Systemic Lupus Erythematosus: A Population-Based Study. Rheumatol (Oxford) (2020) 59:1355–63. 10.1093/rheumatology/kez456 - DOI - PMC - PubMed
    1. Bergstra SA, Van Der Pol JA, Riyazi N, Goekoop-Ruiterman YPM, Kerstens PJSM, Lems W, et al. . Earlier is Better When Treating Rheumatoid Arthritis: But Can We Detect a Window of Opportunity? RMD Open (2020) 6:e001242. 10.1136/rmdopen-2020-001242 - DOI - PMC - PubMed
    1. Burgers LE, Raza K, van der Helm-van Mil AH. Window of Opportunity in Rheumatoid Arthritis - Definitions and Supporting Evidence: From Old to New Perspectives. RMD Open (2019) 5:e000870. 10.1136/rmdopen-2018-000870 - DOI - PMC - PubMed
    1. Coffey CM, Crowson CS, Myasoedova E, Matteson EL, Davis JM. Evidence of Diagnostic and Treatment Delay in Seronegative Rheumatoid Arthritis: Missing the Window of Opportunity. Mayo Clin Proc (2019) 94:2241–8. 10.1016/j.mayocp.2019.05.023 - DOI - PMC - PubMed

Publication types

MeSH terms