

Transcriptional and Microenvironmental Landscape of Macrophage Transition in Cancer: A Boolean Analysis
- PMID: 34177892
- PMCID: PMC8222808
- DOI: 10.3389/fimmu.2021.642842
Transcriptional and Microenvironmental Landscape of Macrophage Transition in Cancer: A Boolean Analysis
Abstract
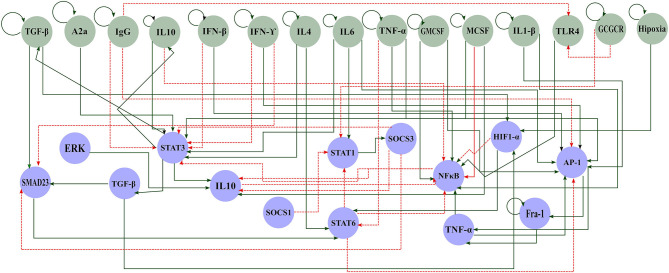
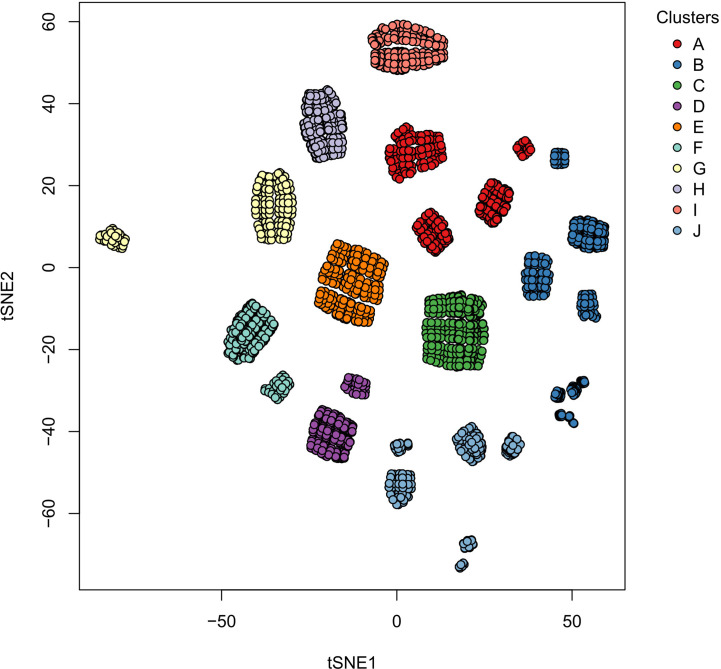
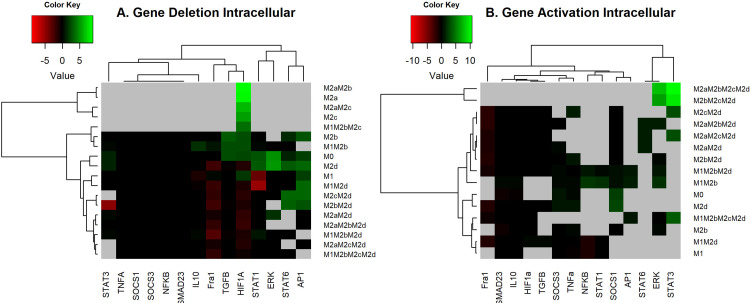
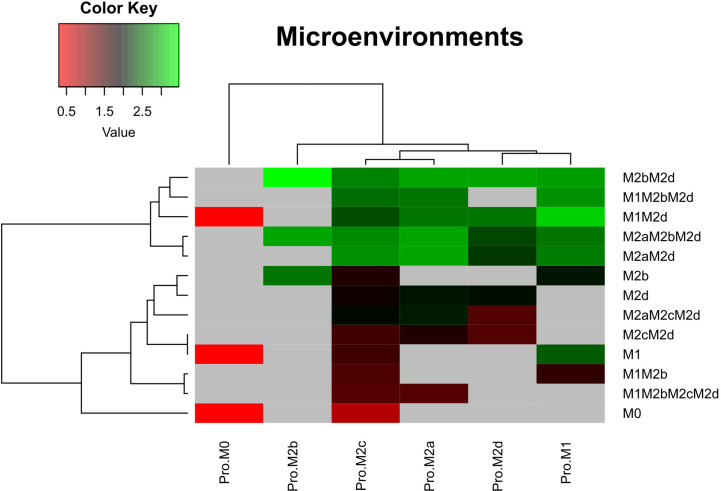
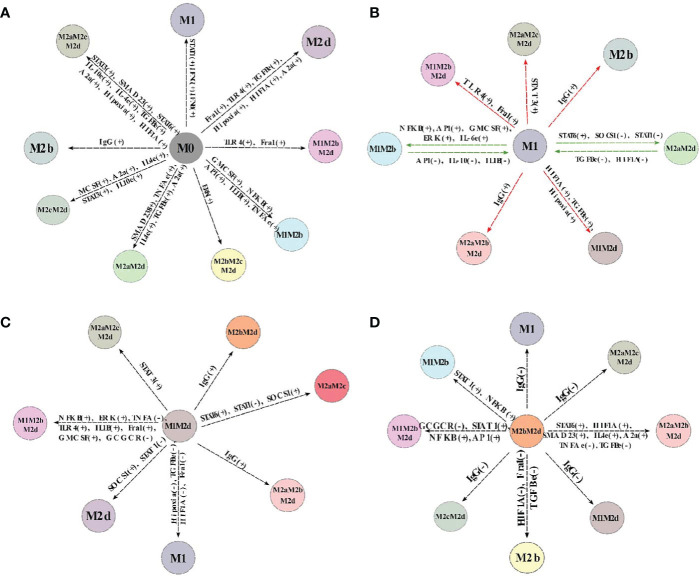
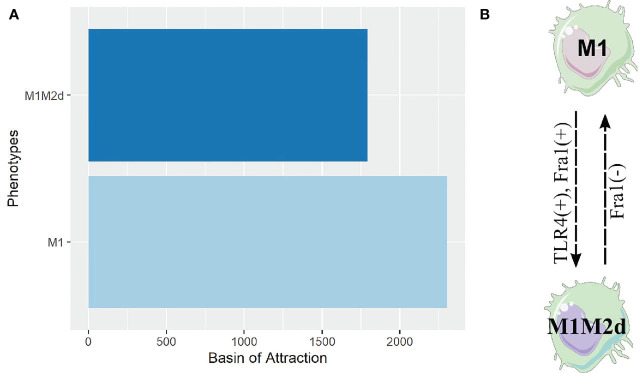
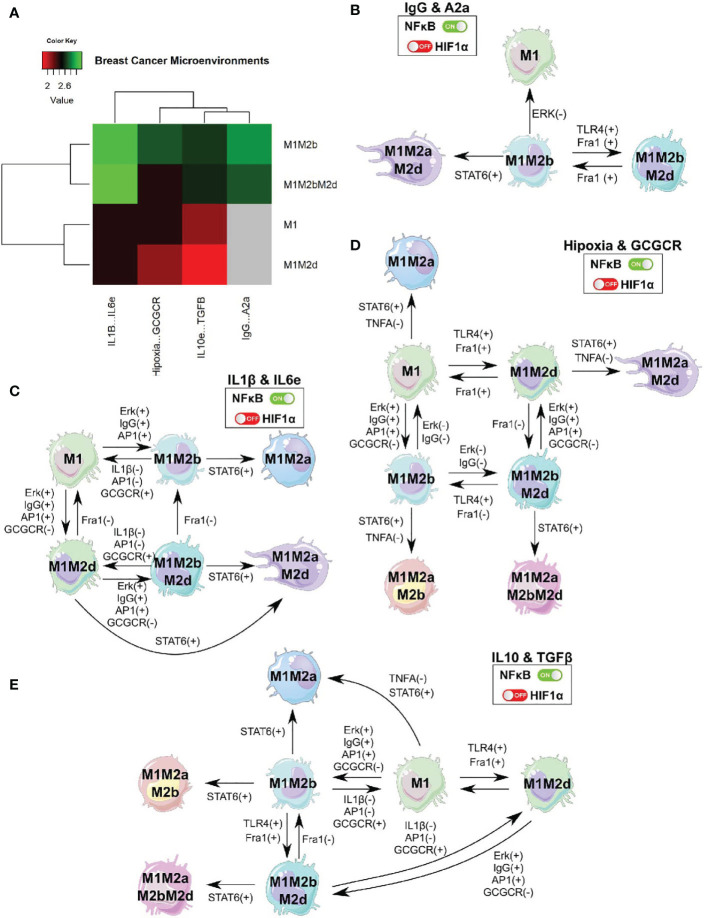
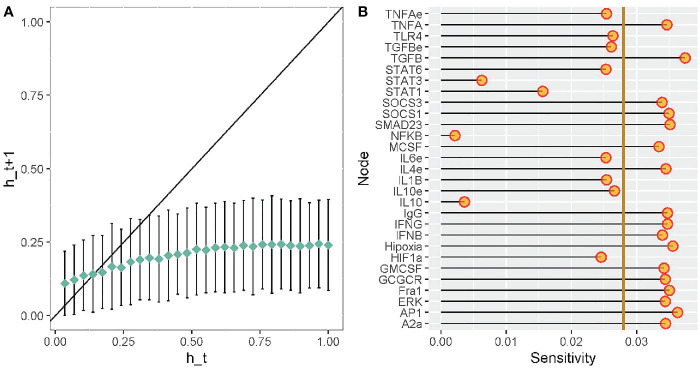
The balance between pro- and anti-inflammatory immune system responses is crucial to face and counteract complex diseases such as cancer. Macrophages are an essential population that contributes to this balance in collusion with the local tumor microenvironment. Cancer cells evade the attack of macrophages by liberating cytokines and enhancing the transition to the M2 phenotype with pro-tumoral functions. Despite this pernicious effect on immune systems, the M1 phenotype still exists in the environment and can eliminate tumor cells by liberating cytokines that recruit and activate the cytotoxic actions of TH1 effector cells. Here, we used a Boolean modeling approach to understand how the tumor microenvironment shapes macrophage behavior to enhance pro-tumoral functions. Our network reconstruction integrates experimental data and public information that let us study the polarization from monocytes to M1, M2a, M2b, M2c, and M2d subphenotypes. To analyze the dynamics of our model, we modeled macrophage polarization in different conditions and perturbations. Notably, our study identified new hybrid cell populations, undescribed before. Based on the in vivo macrophage behavior, we explained the hybrid macrophages' role in the tumor microenvironment. The in silico model allowed us to postulate transcriptional factors that maintain the balance between macrophages with anti- and pro-tumoral functions. In our pursuit to maintain the balance of macrophage phenotypes to eliminate malignant tumor cells, we emulated a theoretical genetically modified macrophage by modifying the activation of NFκB and a loss of function in HIF1-α and discussed their phenotype implications. Overall, our theoretical approach is as a guide to design new experiments for unraveling the principles of the dual host-protective or -harmful antagonistic roles of transitional macrophages in tumor immunoediting and cancer cell fate decisions.
Keywords: boolean models; cancer immunology; gene regulatory network; macrophage; phenotype; systems immunology.
Copyright © 2021 Avila-Ponce de León, Vázquez-Jiménez, Matadamas-Guzman, Pelayo and Resendis-Antonio.
Conflict of interest statement
The authors declare that the research was conducted in the absence of any commercial or financial relationships that could be construed as a potential conflict of interest.
Figures
Similar articles
-
Uncoding the interdependency of tumor microenvironment and macrophage polarization: insights from a continuous network approach.Front Immunol. 2023 May 22;14:1150890. doi: 10.3389/fimmu.2023.1150890. eCollection 2023. Front Immunol. 2023. PMID: 37283734 Free PMC article.
-
Boolean modeling reveals that cyclic attractors in macrophage polarization serve as reservoirs of states to balance external perturbations from the tumor microenvironment.Front Immunol. 2022 Dec 5;13:1012730. doi: 10.3389/fimmu.2022.1012730. eCollection 2022. Front Immunol. 2022. PMID: 36544764 Free PMC article.
-
Gene Regulatory Network Modeling of Macrophage Differentiation Corroborates the Continuum Hypothesis of Polarization States.Front Physiol. 2018 Nov 27;9:1659. doi: 10.3389/fphys.2018.01659. eCollection 2018. Front Physiol. 2018. PMID: 30546316 Free PMC article.
-
Dissection of pro-tumoral macrophage subtypes and immunosuppressive cells participating in M2 polarization.Inflamm Res. 2024 Sep;73(9):1411-1423. doi: 10.1007/s00011-024-01907-3. Epub 2024 Jun 27. Inflamm Res. 2024. PMID: 38935134 Free PMC article. Review.
-
Tumor-Associated Macrophage Subsets: Shaping Polarization and Targeting.Int J Mol Sci. 2023 Apr 19;24(8):7493. doi: 10.3390/ijms24087493. Int J Mol Sci. 2023. PMID: 37108657 Free PMC article. Review.
Cited by
-
The Contribution of Macrophage Plasticity to Inflammatory Arthritis and Their Potential as Therapeutic Targets.Cells. 2024 Sep 20;13(18):1586. doi: 10.3390/cells13181586. Cells. 2024. PMID: 39329767 Free PMC article. Review.
-
Cyclic Attractors Are Critical for Macrophage Differentiation, Heterogeneity, and Plasticity.Front Mol Biosci. 2022 Apr 11;9:807228. doi: 10.3389/fmolb.2022.807228. eCollection 2022. Front Mol Biosci. 2022. PMID: 35480895 Free PMC article.
-
Ferroptosis Driver SOCS1 and Suppressor FTH1 Independently Correlate With M1 and M2 Macrophage Infiltration in Head and Neck Squamous Cell Carcinoma.Front Cell Dev Biol. 2021 Aug 30;9:727762. doi: 10.3389/fcell.2021.727762. eCollection 2021. Front Cell Dev Biol. 2021. PMID: 34527677 Free PMC article.
-
Proteomic characterization of four subtypes of M2 macrophages derived from human THP-1 cells.J Zhejiang Univ Sci B. 2022 May 15;23(5):407-422. doi: 10.1631/jzus.B2100930. J Zhejiang Univ Sci B. 2022. PMID: 35557041 Free PMC article.
-
Macrophage Boolean networks in the time of SARS-CoV-2.Front Immunol. 2022 Oct 17;13:997434. doi: 10.3389/fimmu.2022.997434. eCollection 2022. Front Immunol. 2022. PMID: 36325317 Free PMC article. No abstract available.
References
Publication types
MeSH terms
Substances
LinkOut - more resources
Full Text Sources
Medical