

Non-Invasive Diagnosis for Acute Rejection Using Urinary mRNA Signature Reflecting Allograft Status in Kidney Transplantation
- PMID: 34177898
- PMCID: PMC8222723
- DOI: 10.3389/fimmu.2021.656632
Non-Invasive Diagnosis for Acute Rejection Using Urinary mRNA Signature Reflecting Allograft Status in Kidney Transplantation
Erratum in
-
Corrigendum: Non-Invasive Diagnosis for Acute Rejection Using Urinary mRNA Signature Reflecting Allograft Status in Kidney Transplantation.Front Immunol. 2022 Jan 6;12:825243. doi: 10.3389/fimmu.2021.825243. eCollection 2021. Front Immunol. 2022. PMID: 35069605 Free PMC article.
Abstract
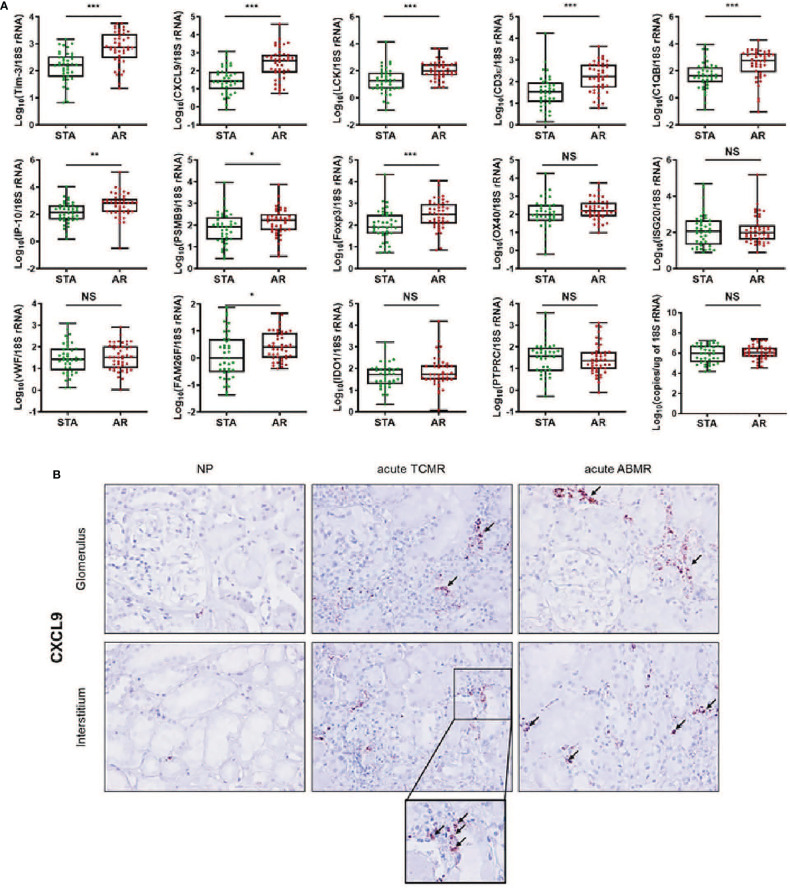
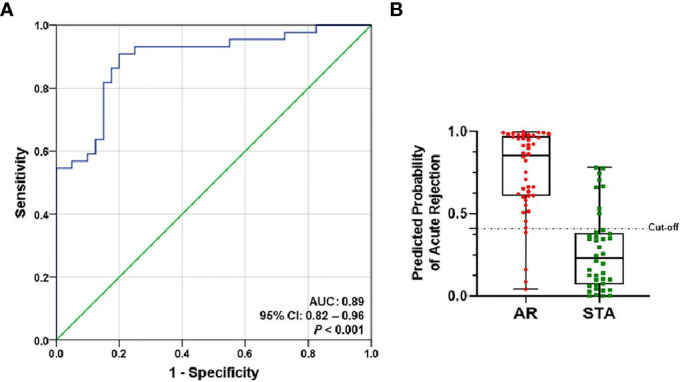
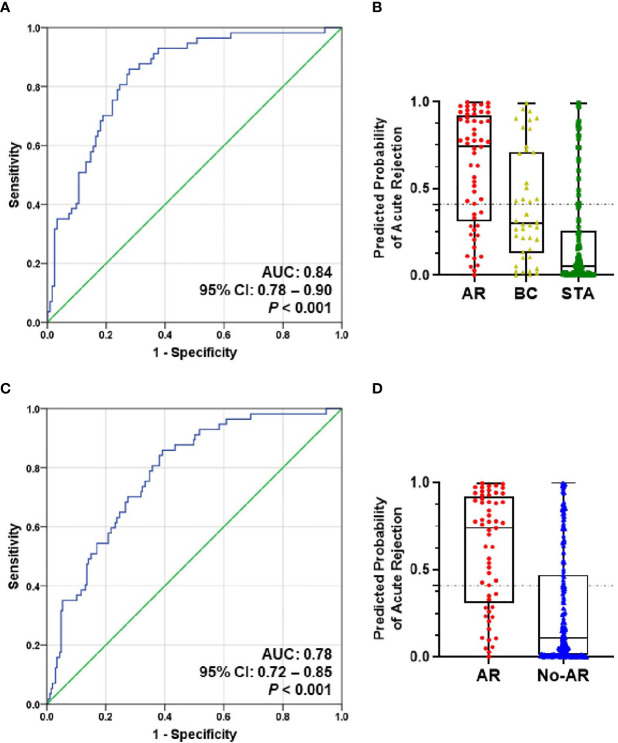
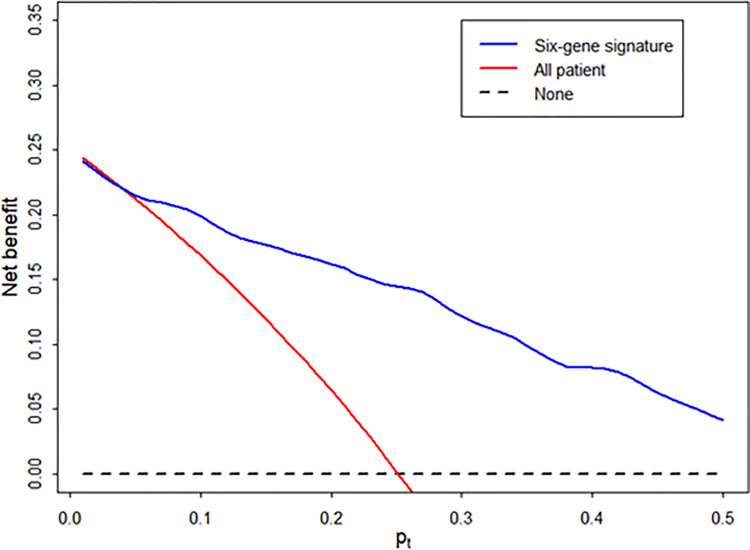
Urine has been regarded as a good resource based on the assumption that urine can directly reflect the state of the allograft or ongoing injury in kidney transplantation. Previous studies, suggesting the usefulness of urinary mRNA as a biomarker of acute rejection, imply that urinary mRNA mirrors the transcriptional activity of the kidneys. We selected 14 data-driven candidate genes through a meta-analysis and measured the candidate genes using quantitative PCR without pre-amplification in the cross-sectional specimens from Korean kidney transplant patients. Expression of 9/14 genes (CXCL9, CD3ϵ, IP-10, LCK, C1QB, PSMB9, Tim-3, Foxp3, and FAM26F) was significantly different between acute rejection and stable graft function with normal pathology and long-term graft survival in 103 training samples. CXCL9 was also distinctly expressed in allografts with acute rejection in in situ hybridization analysis. This result, consistent with the qPCR result, implies that urinary mRNA could reflect the magnitude of allograft injury. We developed an AR prediction model with the urinary mRNAs by a binary logistic regression and the AUC of the model was 0.89 in the training set. The model was validated in 391 independent samples, and the AUC value yielded 0.84 with a fixed manner. In addition, the decision curve analysis indicated a range of reasonable threshold probabilities for biopsy. Therefore, we suggest the urine mRNA signature could be used as a non-invasive monitoring tool of acute rejection for clinical application and could help determine whether to perform a biopsy in a recipient with increased creatinine.
Keywords: acute rejection; kidney; non-invasive diagnosis; transplantation; urinary mRNA.
Copyright © 2021 Seo, Lee, Tae, Park, Moon, Jeong, Kim, Chung, Park, Kim, Seok, Joo, Lee, Lee and Lee.
Conflict of interest statement
The authors declare that the research was conducted in the absence of any commercial or financial relationships that could be construed as a potential conflict of interest.
Figures
Similar articles
-
Urinary Cell mRNA Profiles Predictive of Human Kidney Allograft Status.Clin J Am Soc Nephrol. 2021 Oct;16(10):1565-1577. doi: 10.2215/CJN.14010820. Epub 2021 Apr 27. Clin J Am Soc Nephrol. 2021. PMID: 33906907 Free PMC article. Review.
-
A universal urinary cell gene signature of acute rejection in kidney allografts.J Immunol Methods. 2024 Sep;532:113714. doi: 10.1016/j.jim.2024.113714. Epub 2024 Jun 25. J Immunol Methods. 2024. PMID: 38936464
-
Urinary-cell mRNA profile and acute cellular rejection in kidney allografts.N Engl J Med. 2013 Jul 4;369(1):20-31. doi: 10.1056/NEJMoa1215555. N Engl J Med. 2013. PMID: 23822777 Free PMC article.
-
Development and validation of a peripheral blood mRNA assay for the assessment of antibody-mediated kidney allograft rejection: A multicentre, prospective study.EBioMedicine. 2019 Aug;46:463-472. doi: 10.1016/j.ebiom.2019.07.028. Epub 2019 Aug 1. EBioMedicine. 2019. PMID: 31378695 Free PMC article.
-
Urine biomarkers informative of human kidney allograft rejection and tolerance.Hum Immunol. 2018 May;79(5):343-355. doi: 10.1016/j.humimm.2018.01.006. Epub 2018 Jan 31. Hum Immunol. 2018. PMID: 29366869 Review.
Cited by
-
Urinary mRNA Signatures as Predictors of Renal Function Decline in Patients With Biopsy-Proven Diabetic Kidney Disease.Front Endocrinol (Lausanne). 2021 Nov 9;12:774436. doi: 10.3389/fendo.2021.774436. eCollection 2021. Front Endocrinol (Lausanne). 2021. PMID: 34858345 Free PMC article.
-
Omics-based biomarkers for diagnosis and prediction of kidney allograft rejection.Korean J Intern Med. 2022 May;37(3):520-533. doi: 10.3904/kjim.2021.518. Epub 2022 Apr 15. Korean J Intern Med. 2022. PMID: 35417937 Free PMC article. Review.
-
Evolution of human kidney allograft pathology diagnostics through 30 years of the Banff classification process.World J Transplant. 2023 Sep 18;13(5):221-238. doi: 10.5500/wjt.v13.i5.221. World J Transplant. 2023. PMID: 37746037 Free PMC article. Review.
-
Development and validation of urinary exosomal microRNA biomarkers for the diagnosis of acute rejection in kidney transplant recipients.Front Immunol. 2023 May 9;14:1190576. doi: 10.3389/fimmu.2023.1190576. eCollection 2023. Front Immunol. 2023. PMID: 37228607 Free PMC article.
-
Efficacy of Integrated Risk Score Using Omics-Based Biomarkers for the Prediction of Acute Rejection in Kidney Transplantation: A Randomized Prospective Pilot Study.Int J Mol Sci. 2024 May 9;25(10):5139. doi: 10.3390/ijms25105139. Int J Mol Sci. 2024. PMID: 38791177 Free PMC article. Clinical Trial.
References
-
- Sugiyama K, Tsukaguchi M, Toyama A, Satoh H, Saito K, Nakagawa Y, et al. . Immune Monitoring With a Lymphocyte Adenosine Triphosphate Assay in Kidney Transplant Recipients Treated With a Calcineurin Inhibitor. Exp Clin Transplant (2014) 12(3):195–9. - PubMed
-
- Boix F, Bolarin JM, Eguia J, Gonzalez-Martinez G, de la Pena J, Galian JA, et al. . Pretransplant CD28 Biomarker (Levels of Expression and Quantification of Molecules Per Cell) in Peripheral Cd4(+) T Cells Predicts Acute Rejection Episodes in Liver and Kidney Recipients. Transplant Proc (2016) 48(9):2987–9. doi: 10.1016/j.transproceed.2016.09.028 - DOI - PubMed
Publication types
MeSH terms
Substances
LinkOut - more resources
Full Text Sources
Medical
Research Materials
Miscellaneous