. 2021 Jun 10:12:666953.
doi: 10.3389/fimmu.2021.666953. eCollection 2021.

Highly Sensitive Flow Cytometry Allows Monitoring of Changes in Circulating Immune Cells in Blood After Tdap Booster Vaccination

Affiliations

Highly Sensitive Flow Cytometry Allows Monitoring of Changes in Circulating Immune Cells in Blood After Tdap Booster Vaccination

Annieck M Diks et al. Front Immunol. .

Abstract

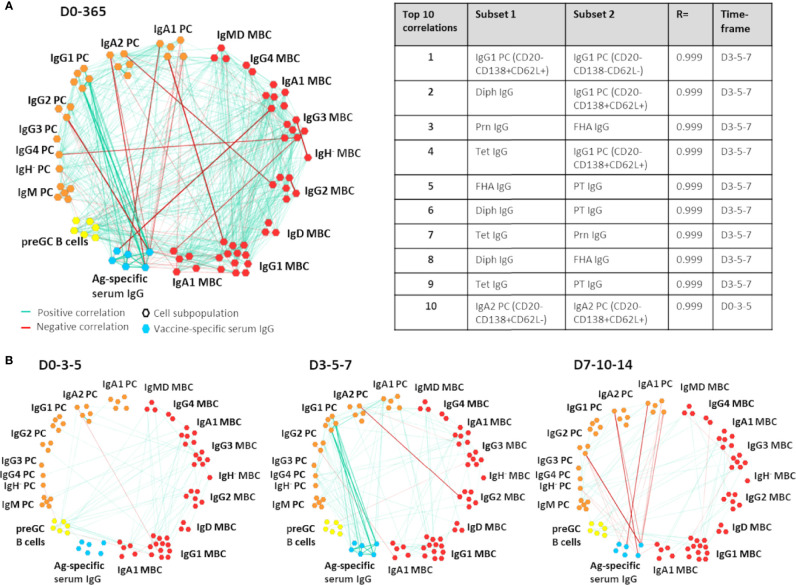
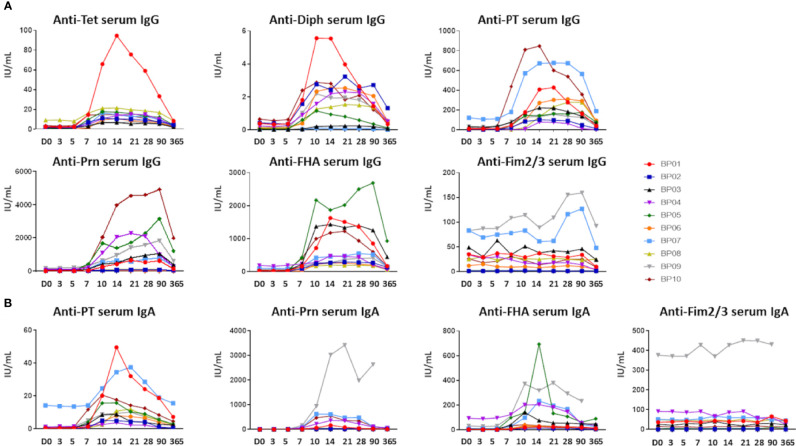
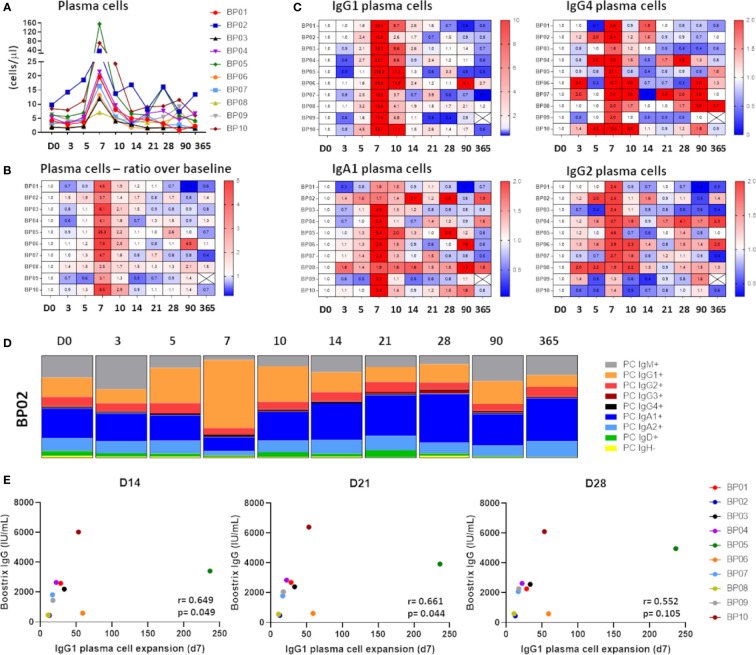
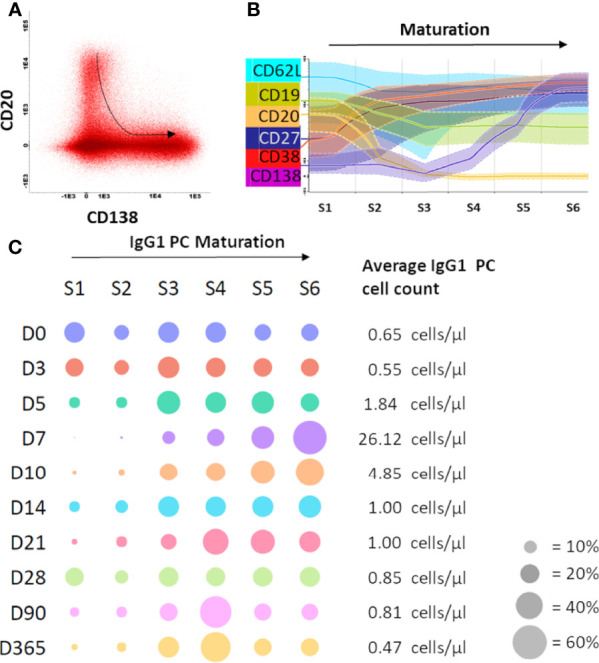
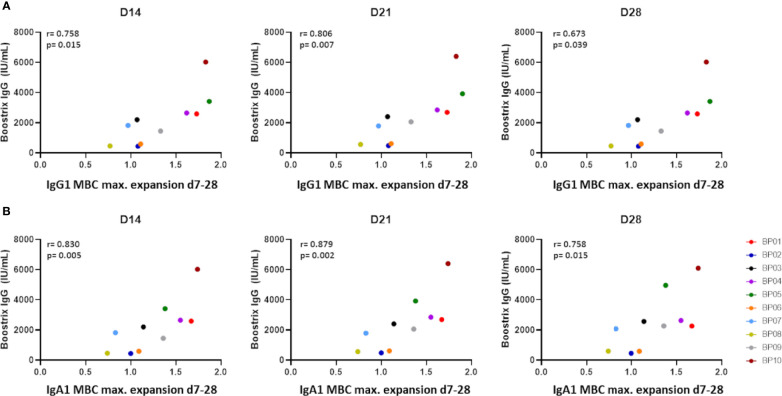
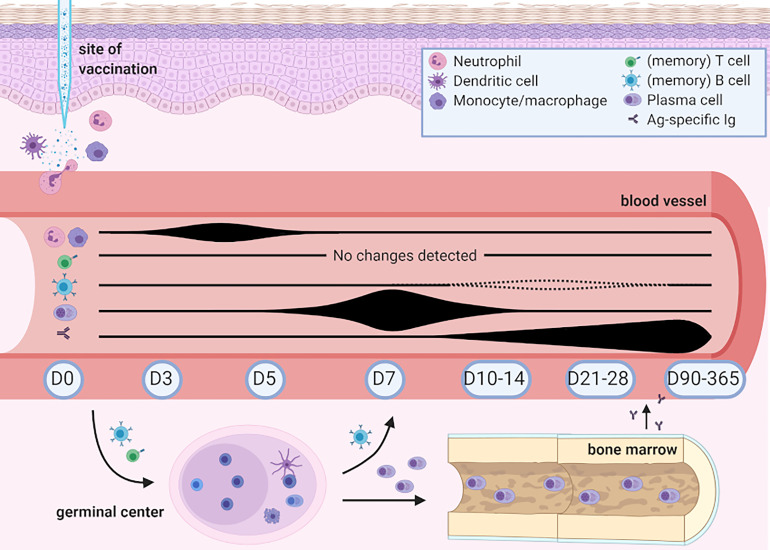
Antigen-specific serum immunoglobulin (Ag-specific Ig) levels are broadly used as correlates of protection. However, in several disease and vaccination models these fail to predict immunity. In these models, in-depth knowledge of cellular processes associated with protective versus poor responses may bring added value. We applied high-throughput multicolor flow cytometry to track over-time changes in circulating immune cells in 10 individuals following pertussis booster vaccination (Tdap, Boostrix®, GlaxoSmithKline). Next, we applied correlation network analysis to extensively investigate how changes in individual cell populations correlate with each other and with Ag-specific Ig levels. We further determined the most informative cell subsets and analysis time points for future studies. Expansion and maturation of total IgG1 plasma cells, which peaked at day 7 post-vaccination, was the most prominent cellular change. Although these cells preceded the increase in Ag-specific serum Ig levels, they did not correlate with the increase of Ig levels. In contrast, strong correlation was observed between Ag-specific IgGs and maximum expansion of total IgG1 and IgA1 memory B cells at days 7 to 28. Changes in circulating T cells were limited, implying the need for a more sensitive approach. Early changes in innate immune cells, i.e. expansion of neutrophils, and expansion and maturation of monocytes up to day 5, most likely reflected their responses to local damage and adjuvant. Here we show that simultaneous monitoring of multiple circulating immune subsets in blood by flow cytometry is feasible. B cells seem to be the best candidates for vaccine monitoring.

Keywords: correlation networks; flow cytometry; immune monitoring; pertussis vaccine; plasma cells.


Conflict of interest statement

AD, CT, JD, AO, MP-A and MB report inventorship of the patent “Means and methods for multiparameter cytometry-based leukocyte subsetting” (NL2844751, filing date 5 November 2019) (21), owned by the EuroFlow Consortium. The remaining authors declare that the research was conducted in the absence of any commercial or financial relationships that could be construed as a potential conflict of interest.

Figures

Figure 1
Figure 1
Example of Cytoscape network analysis between B-cell subsets and/or antigen-specific serum IgGs. In this example, correlations between and within the B-cell compartment and Ag-specific serum IgGs are shown. All positive and negative correlations with an R>0.90 or R<-0.90 over 3 sequential time points and present in at least 8/10 donors were visualized. Only subsets that had at least 1 correlation were shown in the network. For ease of interpretation, subset names have been removed and group names have been added. Of note, the most informative correlation networks found in this study were visualized in the Gephi software and are added as supplemental movies to this manuscript. MBC, Memory B cells (red); PC, plasma cells (orange); preGC B cells, pre-germinal center B cells (yellow); Ag-specific serum IgG, antigen-specific serum IgG (blue); D, Days after vaccination. (A) All correlations found within and between the B-cell compartment and Ag-specific serum IgGs at all time points. The table presents an overview of the 10 strongest correlations of the visualized network. (B) The most relevant correlations visualized per timeframe.
Figure 2
Figure 2
Ag-specific serum Ig levels prior to and post-aP booster vaccination. (A) Ag-specific serum IgG levels (IU/mL) directed against the 5 vaccine components (Diphtheria toxoid (Diph), tetanus toxoid (Tet), PT, FHA and Prn). Fim2/3 was not present in the vaccine and considered a negative control in (A, B). (B) Ag-specific serum IgA levels (IU/mL) directed against the Bp vaccine components (PT, FHA, Prn). For Diph and Tet no quantitative read-out was available. D, Days after vaccination.
Figure 3
Figure 3
Kinetics in the plasma cell compartment upon immunization with aP booster. (A) Maximum expansion of plasma cells at day 7 (up to 156 cells/µl). Expansion started at day 5, peaked at day 7 and returned to baseline afterwards. (B) Heatmap representing the expansion of plasma cells in ratio over baseline. (C) Heatmaps representing the expansion of different plasma cell subsets. Only the most prominent expansions were visualized: IgG1 plasma cells (11-236x), IgG4 plasma cells (2-27x), IgA1 plasma cells (1.6-10.4x) and IgG2 plasma cells (1.3-4.6x). (D) Fluctuations in the distribution of the plasma cell compartment over time. One representative donor is shown. Majority of the expanded plasma cells was of IgG1 phenotype (min-max in donors: 44% -76%). (E) Correlation between maximum plasma cell expansion (day 7) and the level of vaccine-specific IgG (“Boostrix-IgG”) at days 14, 21 and 28 as determined by Spearman’s rank correlation. An FDR-corrected p-value of <0.0075 was considered significant. D, Days after vaccination.
Figure 4
Figure 4
Maturation of IgG1 plasma cells was observed upon immunization with aP booster. (A) Flow cytometry files containing the plasma cells of all donors at all time points were merged in the Infinicyt software to visualize plasma cell maturation. The plasma cell maturation, defined by downregulation of CD20 and upregulation of CD138, is shown in the dot plot. The arrow indicates the direction of the maturation pathway. (B) Based on this CD20-CD138 maturation pathway, the Infinicyt software maturation tool identified 4 additional markers in the flow cytometry panel that were up- or downregulated upon plasma cell maturation. Based on the 6 identified markers (CD19, CD20, CD27, CD62L, CD38, CD138), 6 maturation stages were defined. (C) Per time point the percentage of plasma cells in each maturation stage was plotted (total IgG1 plasma cells of all donors, grouped per time point). The size of the dot indicates the percentage of plasma cells in a given maturation stage (average of 10 donors). Cell count is shown at the right side of the plot (average of 10 donors). The bubble plot was generated using plotly python graphing library. D, Days after vaccination.
Figure 5
Figure 5
Correlation between maximum expansion of memory B-cell subsets and vaccine-specific IgGs as determined by Spearman’s rank correlation. (A) Correlation between the maximum expansion of IgG1 memory B cells (ratio over baseline at days 7-28) and vaccine-specific IgGs (“Boostrix-IgG”) at days 14, 21 and 28. (B) Correlation between the maximum expansion of IgA1 memory B cells (ratio over baseline at days 7-28) and vaccine-specific IgGs at days 14, 21 and 28. An FDR-corrected p-value of <0.0075 was considered significant. D, Days after vaccination.
Figure 6
Figure 6
Overview of changes detected in human peripheral blood post-Boostrix vaccination in this study. Created with BioRender.com. Up to 5 days post-vaccination, fluctuations were found in the levels of circulating neutrophils and monocytes, with a change in total monocyte composition (based on expression of CD14 and CD16, with increased levels of intermediate and non-classical monocytes). Circulating plasma cells started expanding from day 5 onwards with a sharp peak in (predominantly IgG1) plasma cell levels at day 7 simultaneous with plasma cell maturation. Changes in circulating memory B-cell numbers were limited. Increase in Ag-specific IgG serum levels occurred from day 7 onwards and only showed signs of waning at day 365. Despite in-depth analysis, no uniform changes were detected in circulating T-cell subsets. Baseline cell count and Ag-specific serum Ig levels did not seem to influence the levels of Ag-specific IgGs.

References

    1. Plotkin SA. Complex Correlates of Protection After Vaccination. J Clin Infect Dis (2013) 56(10):1458–65. 10.1093/cid/cit048 - DOI - PubMed
    1. Whittle H, Inskip H, Hall A, Mendy M, Downes R, Hoare S. Vaccination Aginst Chronic Viral Carriage in The Gambia. Lancet (1991) 337(8744):747–50. 10.1016/0140-6736(91)91367-4 - DOI - PubMed
    1. Plotkin SA. Correlates of Protection Induced by Vaccination. Clin Vaccine Immunol (2010) 17(7):1055–65. 10.1128/CVI.00131-10 - DOI - PMC - PubMed
    1. Clay TM, Hobeika AC, Mosca PJ, Lyerly HK, Morse MA. Assays for Monitoring Cellular Immune Responses to Active Immunotherapy of Cancer. J Clin Cancer Res (2001) 7(5):1127–35. - PubMed
    1. Sridhar S, Begom S, Bermingham A, Hoschler K, Adamson W, Carman W, et al. . Cellular Immune Correlates of Protection Against Symptomatic Pandemic Influenza. Nat Med (2013) 19(10):1305. 10.1038/nm.3350 - DOI - PubMed

Publication types