. 2021 Jun 10:12:690857.
doi: 10.3389/fpls.2021.690857. eCollection 2021.

Insights Into the Mechanisms Implicated in Pinus pinaster Resistance to Pinewood Nematode

Affiliations

Insights Into the Mechanisms Implicated in Pinus pinaster Resistance to Pinewood Nematode

Inês Modesto et al. Front Plant Sci. .

Abstract

Pine wilt disease (PWD), caused by the plant-parasitic nematode Bursaphelenchus xylophilus, has become a severe environmental problem in the Iberian Peninsula with devastating effects in Pinus pinaster forests. Despite the high levels of this species' susceptibility, previous studies reported heritable resistance in P. pinaster trees. Understanding the basis of this resistance can be of extreme relevance for future programs aiming at reducing the disease impact on P. pinaster forests. In this study, we highlighted the mechanisms possibly involved in P. pinaster resistance to PWD, by comparing the transcriptional changes between resistant and susceptible plants after infection. Our analysis revealed a higher number of differentially expressed genes (DEGs) in resistant plants (1,916) when compared with susceptible plants (1,226). Resistance to PWN is mediated by the induction of the jasmonic acid (JA) defense pathway, secondary metabolism pathways, lignin synthesis, oxidative stress response genes, and resistance genes. Quantification of the acetyl bromide-soluble lignin confirmed a significant increase of cell wall lignification of stem tissues around the inoculation zone in resistant plants. In addition to less lignified cell walls, susceptibility to the pine wood nematode seems associated with the activation of the salicylic acid (SA) defense pathway at 72 hpi, as revealed by the higher SA levels in the tissues of susceptible plants. Cell wall reinforcement and hormone signaling mechanisms seem therefore essential for a resistance response.

Keywords: Bursaphelenchus xylophilus; cell wall lignification; jasmonate; maritime pine; pine wilt disease; resistance genes; secondary metabolism; transcriptome.


Conflict of interest statement

The authors declare that the research was conducted in the absence of any commercial or financial relationships that could be construed as a potential conflict of interest.

Figures
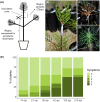
Figure 1
Figure 1
Inoculation, sampling, and symptoms observation. Plants were inoculated in the stem, below the apical region (A,B). Samples of the stem, including the inoculation zone, were collected 72 h post-inoculation (hpi). After debarking, these samples were homogenized and total RNA was extracted. The remaining part of the plant, below the cutting region, was maintained for symptoms observations for 210 days post-inoculation (dpi). Symptoms were evaluated weekly and registered according to a five-level scale based on percentage of brown/wilted needles: 0, 0% (D); 1, 1–25%; 2, 26–50%; 3, 51–75%; 4, 76–100% (C). Symptom progression in selected timepoints is represented in (E). Plants without any visible symptom at the end of the experiment were considered resistant.
Figure 2
Figure 2
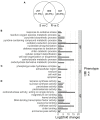
Venn diagram showing overlap of differentially expressed genes in susceptible (S) and resistant (R) samples (A) and gene set enrichment analysis (B–D). (A) Differential expression was calculated by comparing susceptible (S) or resistant (R) samples with controls (C). (B–D) GO terms overrepresented in the upregulated genes in resistant (dark gray) and susceptible (light gray) samples are displayed, separated by (B) biological process (BP), (C) cellular component (CC), and (D) molecular function (MF). The x-axis represents the significance of GO enrichment (–log10 of corrected p-values).
Figure 3
Figure 3
RT-qPCR analysis of 10 DEGs from the RNA-seq results. (A) Bars represent differential expression levels, in log2(fold change), of susceptible (white) and resistant (gray) plants in comparison with controls. Results from both the RNA-seq analysis (filled colors) and the RT-qPCR analysis (stripes) are displayed. Error bars represent the standard error of the biological replicates used for RNA-seq (4–5) and RT-qPCR (3). (B) Correlation of expression levels between RNA-Seq and RT-qPCR.
Figure 4
Figure 4
Pathway enrichment analysis. KEGG pathways overrepresented in the upregulated genes in resistant (dark gray) and susceptible (light gray) samples are depicted in the graph. The x-axis represents the significance of KEGG enrichment (–log10 of corrected p-values).
Figure 5
Figure 5
Lignin biosynthesis pathway. Lignin biosynthesis pathway is represented (adapted from Xie et al., 2018), with the differential expressed genes highlighted in gray. Heatmaps represent log10(TPM) values of differentially expressed genes in the general phenylpropanoid pathway (A) and the lignin specific pathway (B–D). The final steps of lignin synthesis are carried out by laccases (LAC, C) and peroxidases (PER, D). The percentage of acetyl bromide soluble lignin of cell wall (ABSL of CW) measured in control (C), susceptible (S), and resistant (R) plants is represented in (E). Error bars represent the standard error of the mean. Significant differences between control and inoculated plants, using Student's t-test, are indicated by an asterisk (*p-value < 0.05).
Figure 6
Figure 6
Hormone response to PWN inoculation. (A) Levels of jasmonate-Illenine (JA-Ile), (B) abscisic acid (ABA), (C) jasmonic acid (JA), and (D) salicylic acid (SA) (ng per 1 g of plant dry weight) measured in control (C), susceptible (S), and resistant (R) plants. Error bars represent the standard error of the mean. Significant differences between control and inoculated plants, using Student's t-test, are indicated by an asterisk (*p-value < 0.05). (E) Differential expression of hormone responsive genes in resistant (R) and susceptible (S) plants, compared to controls. For each gene annotation, the average of the log2(fold change) is represented. Error bars represent the standard error of the mean. For more details about the genes used and respective functional annotations see Supplementary Table 9.
Figure 7
Figure 7
Differential expression of PR and chitinase genes. For each gene family, the average of the log2(fold change) is represented for resistant (R) and susceptible (S) plants, compared to controls. Error bars represent the standard error of the mean. (A) PR-4, 3 genes; (B) chitinase, 25 genes; (C) PR-5, 16 genes; (D) PR-1, 4 genes. For more details about the genes used and respective functional annotations see Supplementary Table 9.

References

    1. Adie B., Chico J. M., Rubio-Somoza I., Solano R. (2007). Modulation of plant defenses by ethylene. J. Plant Growth Regul. 26, 160–177. 10.1007/s00344-007-0012-6 - DOI
    1. Ahuja I., Kissen R., Bones A. M. (2012). Phytoalexins in defense against pathogens. Trends Plant Sci. 17, 73–90. 10.1016/j.tplants.2011.11.002 - DOI - PubMed
    1. Andreasson E., Jenkins T., Brodersen P., Thorgrimsen S., Petersen N. H. T., Zhu S., et al. . (2005). The MAP kinase substrate MKS1 is a regulator of plant defense responses. EMBO J. 24, 2579–2589. 10.1038/sj.emboj.7600737 - DOI - PMC - PubMed
    1. Andrews S. (2010). FastQC: A Quality Control Tool for High Throughput Sequence Data. Available online at: http://www.bioinformatics.babraham.ac.uk/projects/fastqc
    1. Bodenhausen N., Reymond P. (2007). Signaling pathways controlling induced resistance to insect herbivores in Arabidopsis. Mol. Plant Microbe Interact. 20, 1406–1420. 10.1094/MPMI-20-11-1406 - DOI - PubMed

LinkOut - more resources