Review
. 2021 Jun 11:12:694468.
doi: 10.3389/fgene.2021.694468. eCollection 2021.

Assembling Disease Networks From Causal Interaction Resources

Affiliations
Review

Assembling Disease Networks From Causal Interaction Resources

Gianni Cesareni et al. Front Genet. .

Abstract

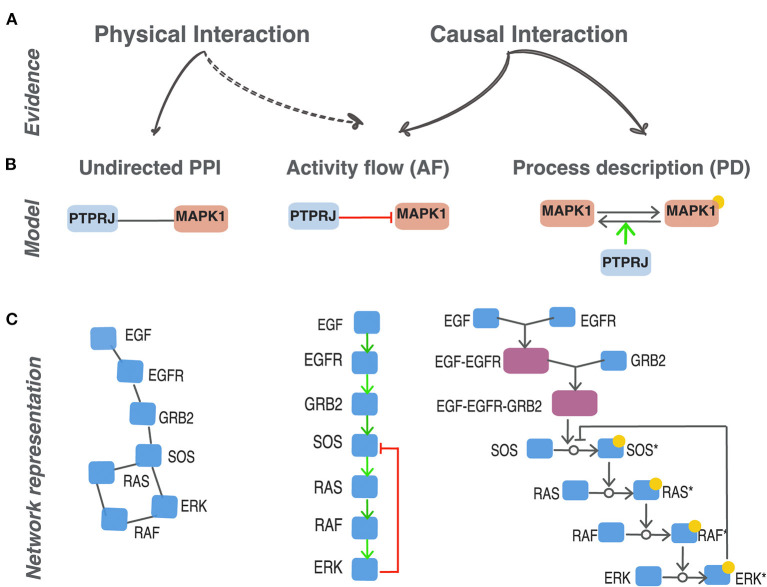
The development of high-throughput high-content technologies and the increased ease in their application in clinical settings has raised the expectation of an important impact of these technologies on diagnosis and personalized therapy. Patient genomic and expression profiles yield lists of genes that are mutated or whose expression is modulated in specific disease conditions. The challenge remains of extracting from these lists functional information that may help to shed light on the mechanisms that are perturbed in the disease, thus setting a rational framework that may help clinical decisions. Network approaches are playing an increasing role in the organization and interpretation of patients' data. Biological networks are generated by connecting genes or gene products according to experimental evidence that demonstrates their interactions. Till recently most approaches have relied on networks based on physical interactions between proteins. Such networks miss an important piece of information as they lack details on the functional consequences of the interactions. Over the past few years, a number of resources have started collecting causal information of the type protein A activates/inactivates protein B, in a structured format. This information may be represented as signed directed graphs where physiological and pathological signaling can be conveniently inspected. In this review we will (i) present and compare these resources and discuss the different scope in comparison with pathway resources; (ii) compare resources that explicitly capture causality in terms of data content and proteome coverage (iii) review how causal-graphs can be used to extract disease-specific Boolean networks.

Keywords: causal interactions; causality resources; logic modeling; network medicine; prior knowledge network.


Conflict of interest statement

The authors declare that the research was conducted in the absence of any commercial or financial relationships that could be construed as a potential conflict of interest.

Figures

Figure 1
Figure 1
Different representations of protein interactions. (A) Experimental methods can either provide evidence that support a physical contact between two proteins to form a complex (physical interaction) or a modulation of the activity of a target protein caused by the activity of a parent protein (causal interaction). (B) Different graphical representation of the same biological statement: PTPRJ dephosphorylates and inhibits MAPK1 (Sacco et al., 2009). Three distinct models to represent protein relationships supported by different experimental evidence: undirected PPI, activity-flow and process description. (C) The EGFR signaling pathway represented as an undirected protein-protein interaction network (PPI), as activity-flow network (AF) and a process-description network (PD). *indicates the modified form of a given protein node.
Figure 2
Figure 2
Classification of causality resources. Resources can be grouped according to the model adopted to represent causality in AF or PD (see Figure 1) and according to the organization of the information in “interaction databases” or “pathway databases.” In interaction databases relationships are annotated separately and not necessarily in the context of higher-level organizational structures, such as pathways. In “pathway databases” interactions are exclusively shown in the context of the pathway they participate in.
Figure 3
Figure 3
Comparison of AF Databases. (A) UpSet Plot showing the overlaps between four primary AF resources: SIGNOR (in yellow), KEGG (in red), PhosphoSitePlus (in purple) and SignaLink (in green). The vertical bars show the number of intersecting protein pairs (regulator-target) between resources, identified as connected colored circles below the histogram. The length of the horizontal bars is proportional to the dataset size of each resource. As an example, PhosphoSitePlus, SIGNOR and KEGG share 210 interactions. (B) Proportional Venn diagrams showing the overlap between the datasets of the four primary AF resources and OmniPath: SIGNOR (in yellow), KEGG (in red), PhosphoSitePlus (in purple), SignaLink (in green) and OmniPath (dark purple). Individual set sizes are in parenthesis. (C) Matrix of bar plots showing the number of interactions between pairs of proteins whose effect, up- down-regulation is annotated in an opposite way in each pair of primary resources. Agreement and disagreement are shown in red and blue, respectively.
Figure 4
Figure 4
Violin plots illustrating the size distribution of the disease-networks that can be assembled by linking disease genes via causal interactions annotated in AF Databases. Disease-networks were assembled by using gene-disease associations (GDAs) downloaded from the Cancer Gene Census (left panel) (Sondka et al., 2018) and from DisGeNET selecting GDAs with score > 0.5 (right panel) (Piñero et al., 2020). The disease-networks also include proteins that directly connect disease gene products (bridge proteins) (Lo Surdo et al., 2018). Only diseases with at least two GDAs were considered in this analysis. Each dot represents a disease network and its size (y-axis) is defined as the number of edges that can be extracted from the five AF resources: SIGNOR (in yellow), KEGG (in red), PhosphoSitePlus (in purple), SignaLink (in green) and OmniPath (dark purple); and from a network derived by taking into considerations all the relationships annotated in at least one resource, combined (black). On top of each violin the total number of disease-networks that can be assembled by using the annotated causal relationships from each corresponding resource is displayed. In brackets we show the average size of the network, also indicated by a horizontal black bar.
Figure 5
Figure 5
A prior knowledge network (PKN) associated with the “Gray Platelet syndrome.” (A) Strategy to derive the networks from the causal data in each resource. Thirty six gene-disease associations for the Gray Platelet syndrome were downloaded from MalaCards (Rappaport et al., 2017). Disease genes are used as seeds (orange nodes) to assemble the networks by searching causal resources for connecting relationships. To implement this strategy, we searched data from primary resources, from OmniPath; and from a virtual resource integrating all the datasets. Up - or down-regulations are illustrated in the graphs as green arrows and red t-shaped edges, respectively. We also included bridge proteins (gray nodes). Bridge proteins are proteins that connect at least two seed proteins (Lo Surdo et al., 2018). We were not able to obtain a significant network (>2 interactions) from KEGG, PhosphoSitePlus and SignaLink. (B) Network extracted from OmniPath: 18 nodes and 27 edges. (C) Network extracted from SIGNOR: 29 nodes and 53 edges. The purple node corresponds to the phenotype “platelet alpha granule formation,” annotated in SIGNOR (Licata et al., 2020). (D) Network that can be derived by combining the datasets annotated by the five combined resources: 41 nodes and 96 edges.

Similar articles

Cited by

References

    1. Acuner Ozbabacan S. E., Engin H. B., Gursoy A., Keskin O. (2011). Transient protein-protein interactions. Protein Eng. Des. Sel. PEDS 24, 635–648. 10.1093/protein/gzr025 - DOI - PubMed
    1. Aghamiri S. S., Singh V., Naldi A., Helikar T., Soliman S., Niarakis A. (2020). Automated inference of Boolean models from molecular interaction maps using CaSQ. Bioinforma. Oxf. Engl. 36, 4473–4482. 10.1093/bioinformatics/btaa484 - DOI - PMC - PubMed
    1. Barabási A.-L., Gulbahce N., Loscalzo J. (2011). Network medicine: a network-based approach to human disease. Nat. Rev. Genet. 12, 56–68. 10.1038/nrg2918 - DOI - PMC - PubMed
    1. Béal J., Montagud A., Traynard P., Barillot E., Calzone L. (2018). Personalization of logical models with multi-omics data allows clinical stratification of patients. Front. Physiol. 9:1965. 10.3389/fphys.2018.01965 - DOI - PMC - PubMed
    1. Boué S., Talikka M., Westra J. W., Hayes W., Di Fabio A., Park J., et al. . (2015). Causal biological network database: a comprehensive platform of causal biological network models focused on the pulmonary and vascular systems. Database J. Biol. Databases Curation 2015:bav030. 10.1093/database/bav030 - DOI - PMC - PubMed