

Glycine insertion modulates the fluorescence properties of Aequorea victoria green fluorescent protein and its variants in their ambient environment
- PMID: 34178565
- PMCID: PMC8214926
- DOI: 10.2142/biophysico.bppb-v18.016
Glycine insertion modulates the fluorescence properties of Aequorea victoria green fluorescent protein and its variants in their ambient environment
Abstract
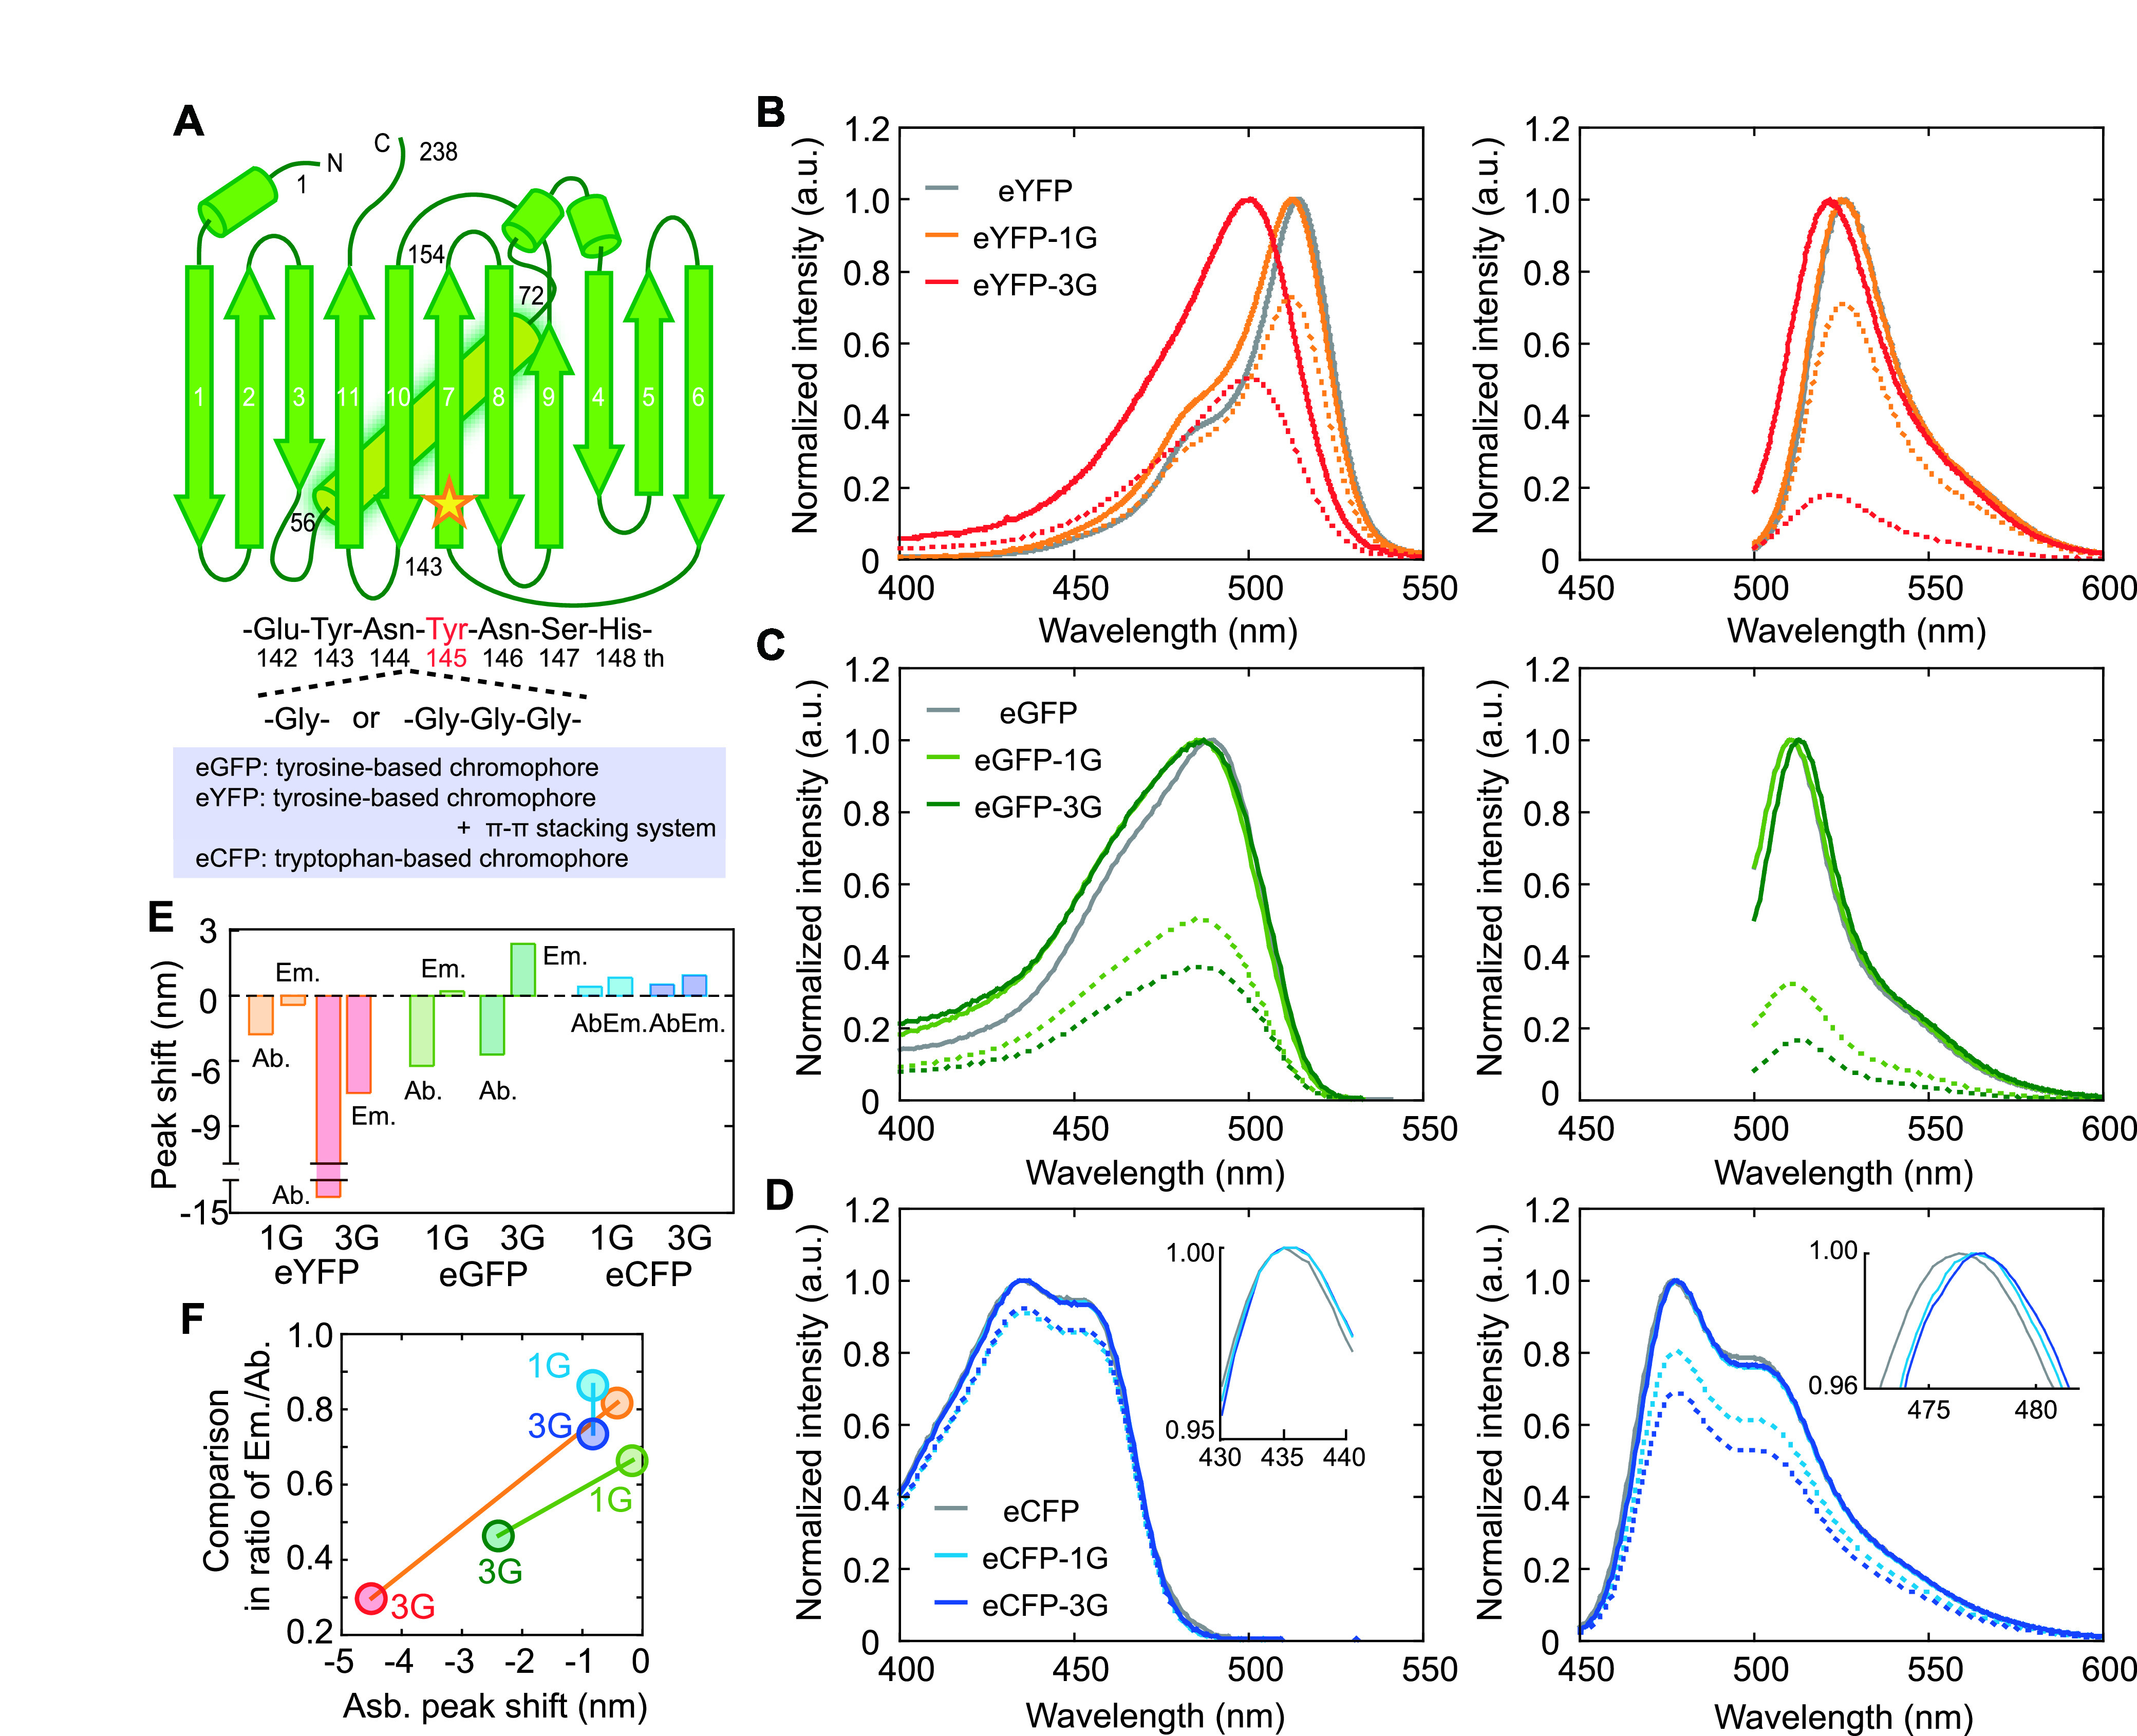
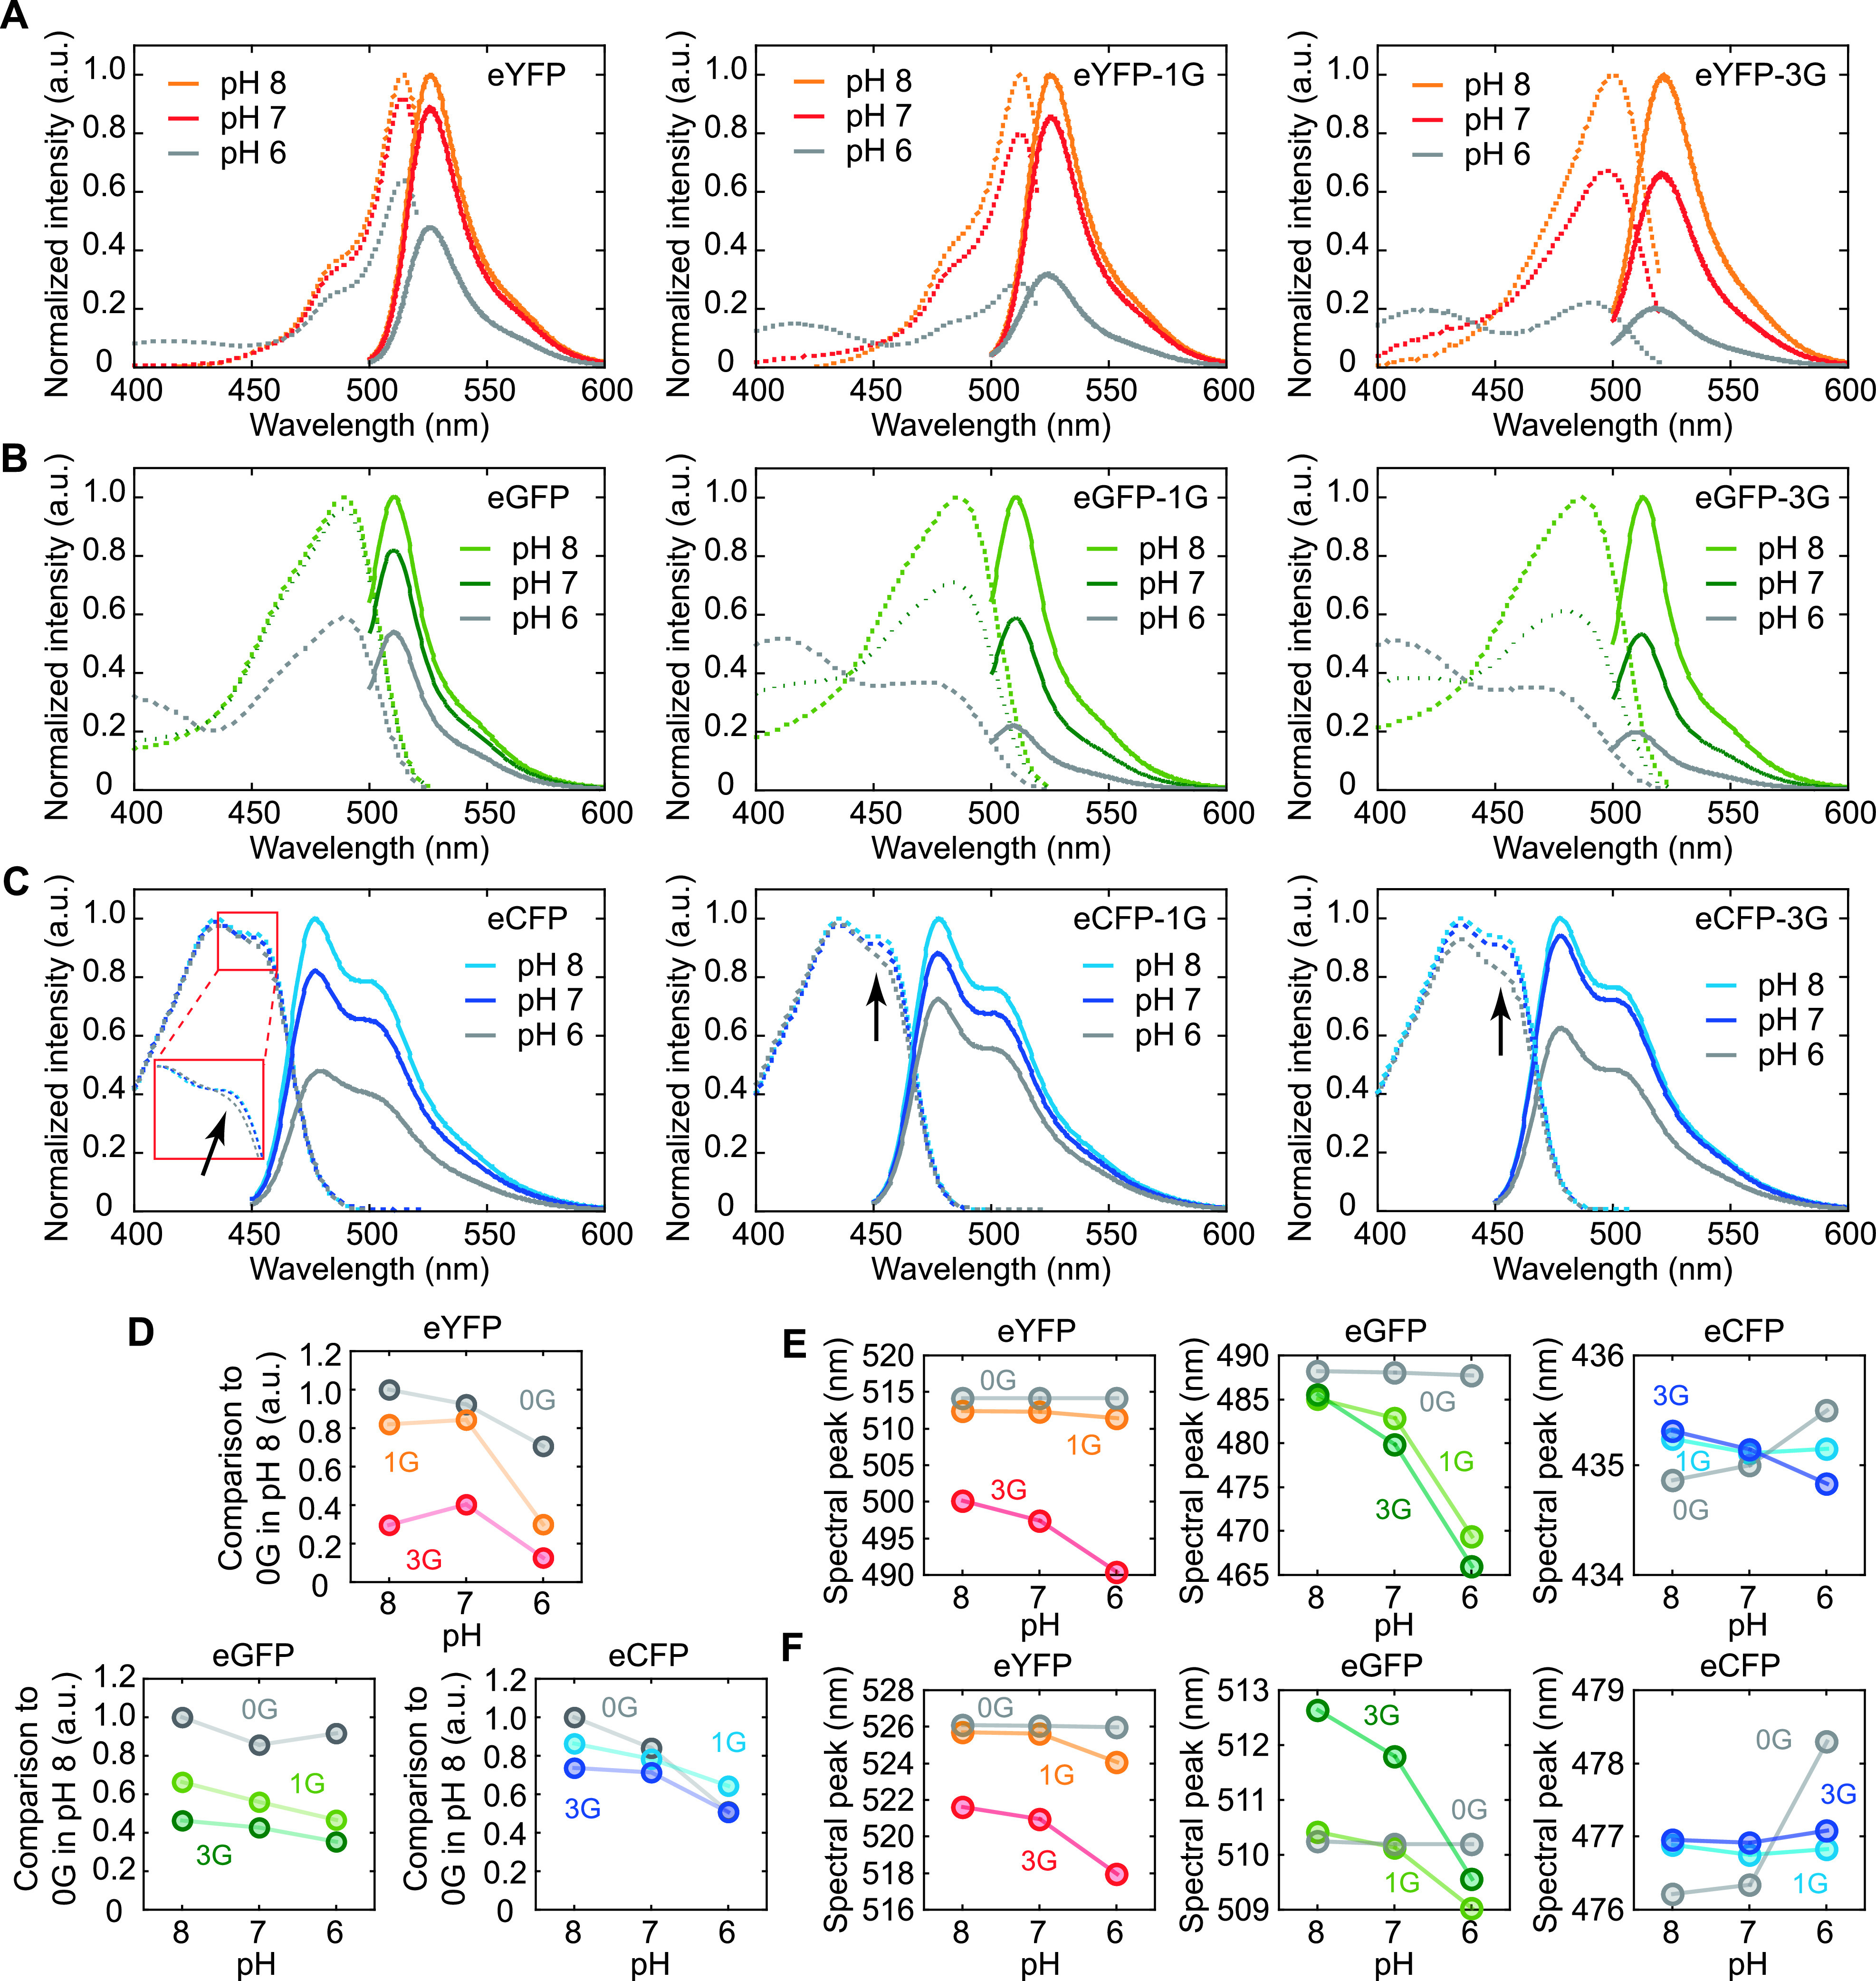
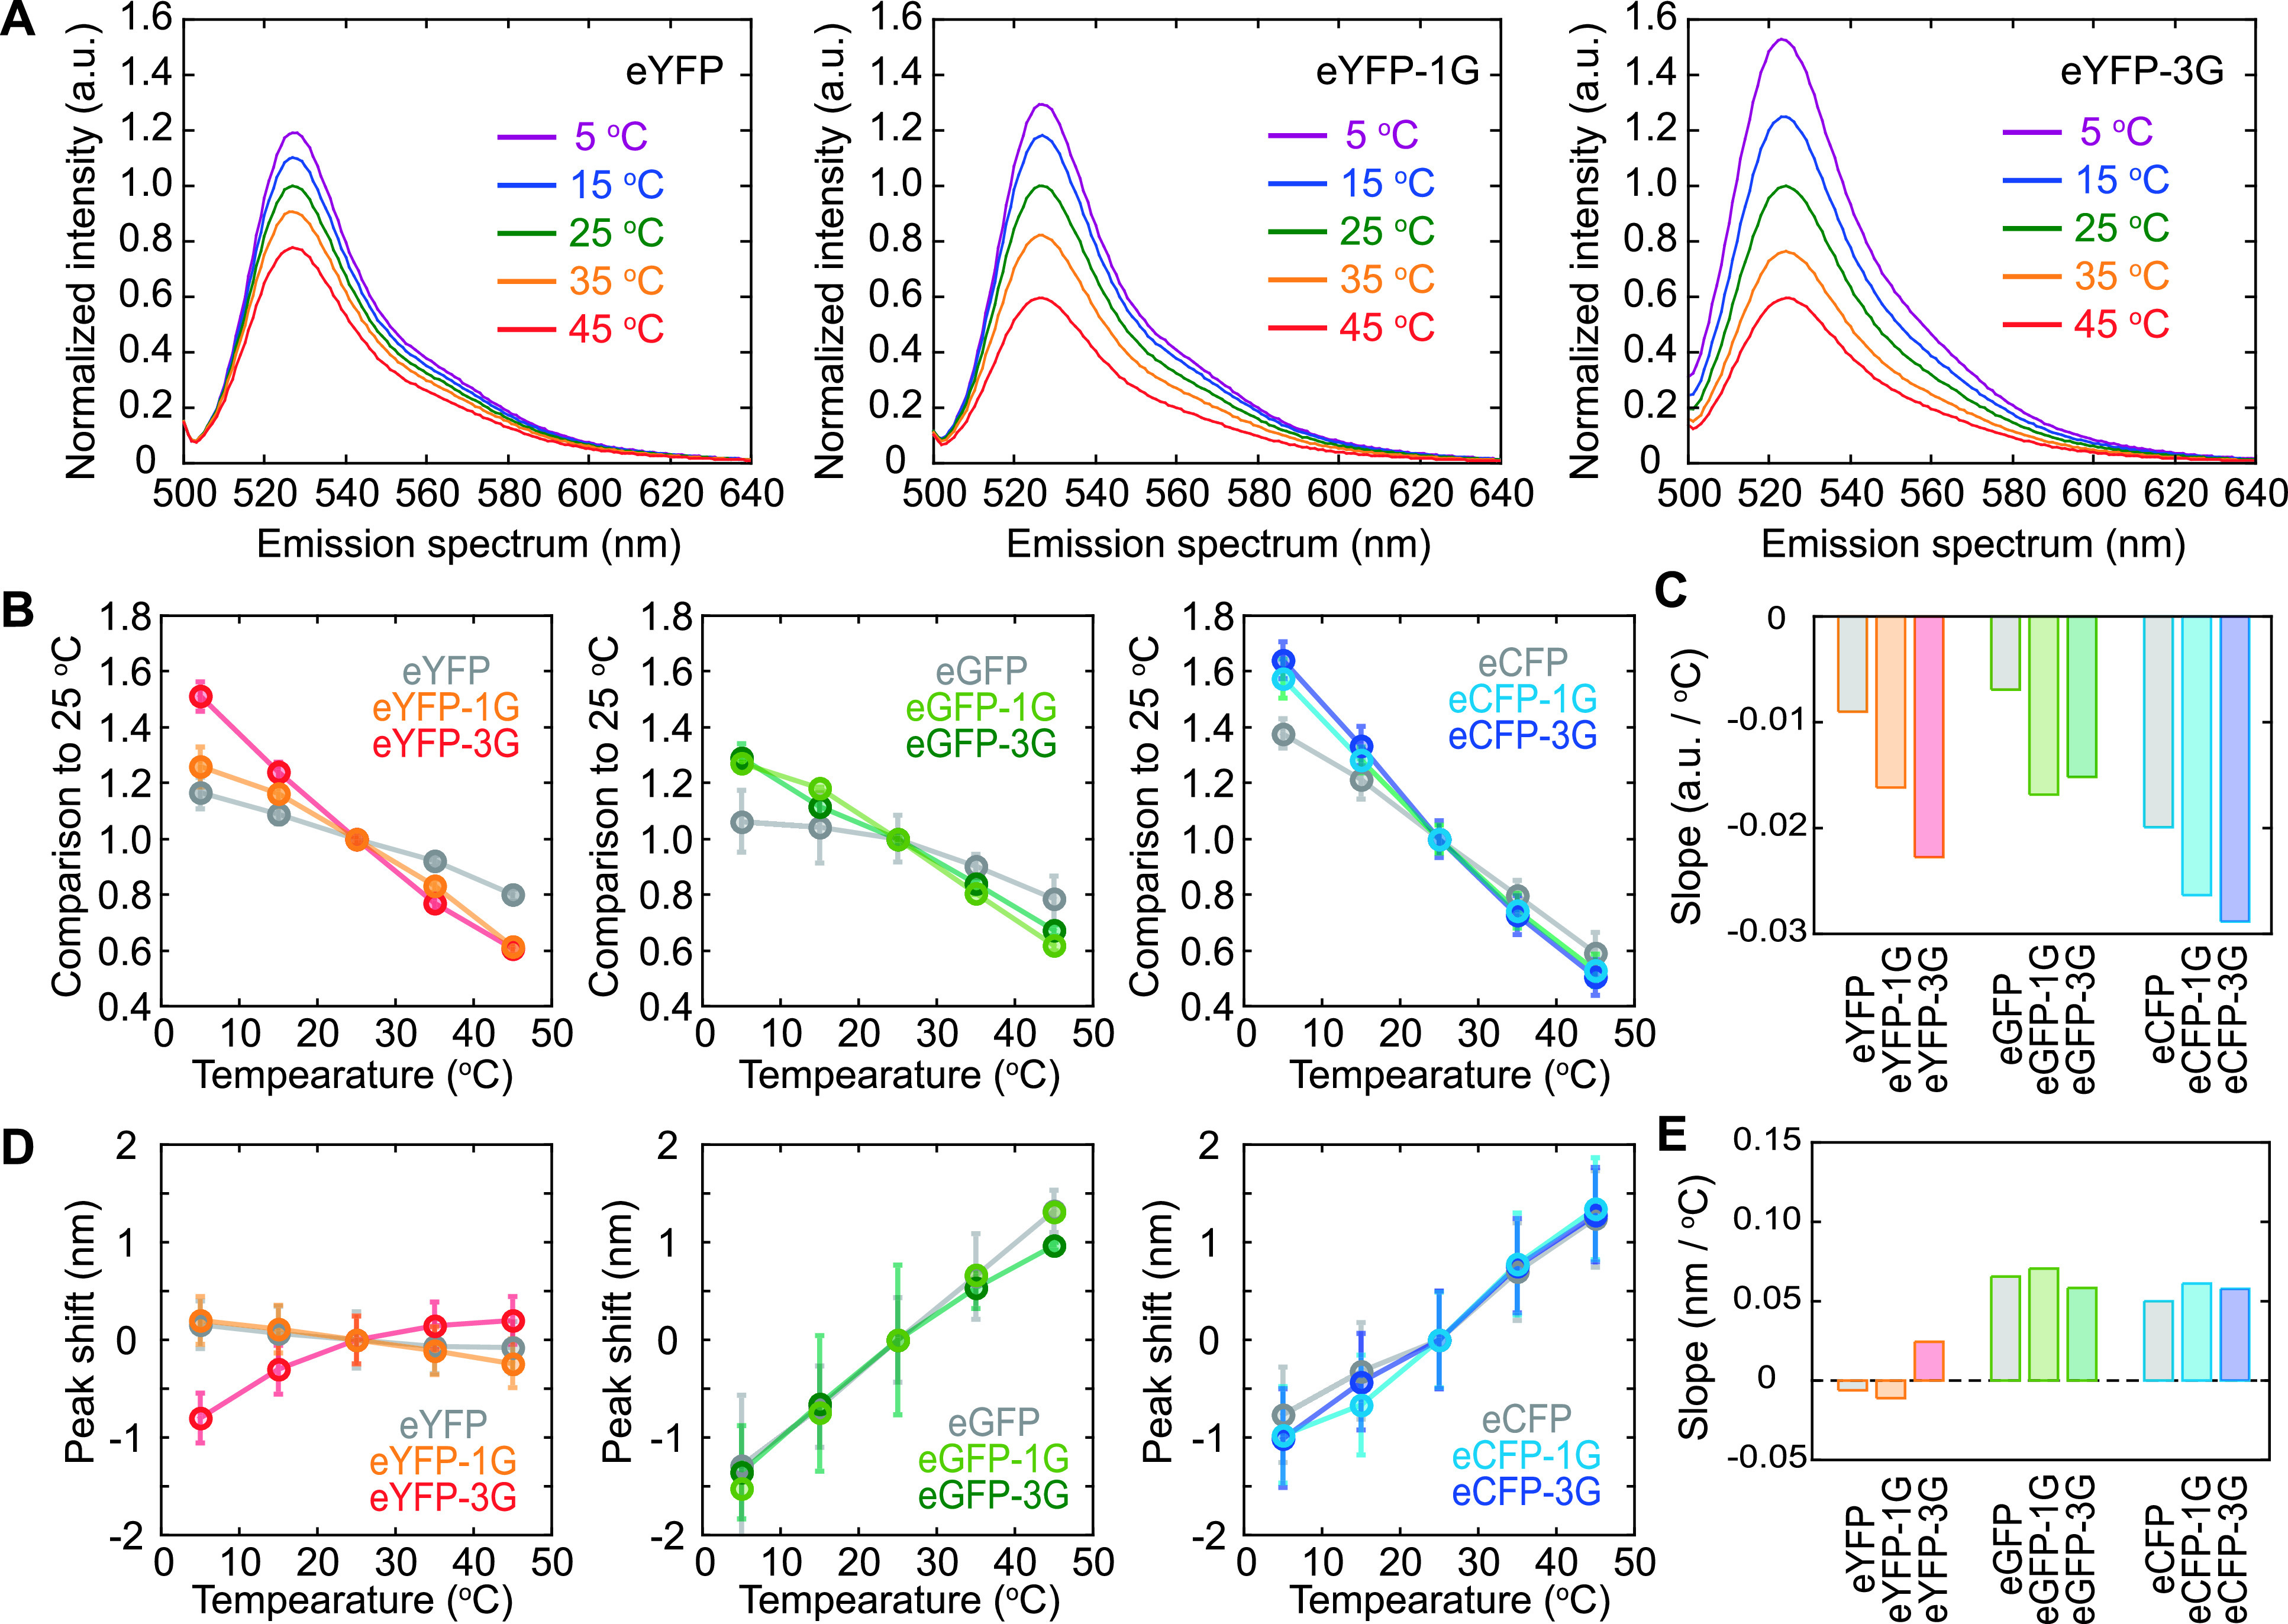
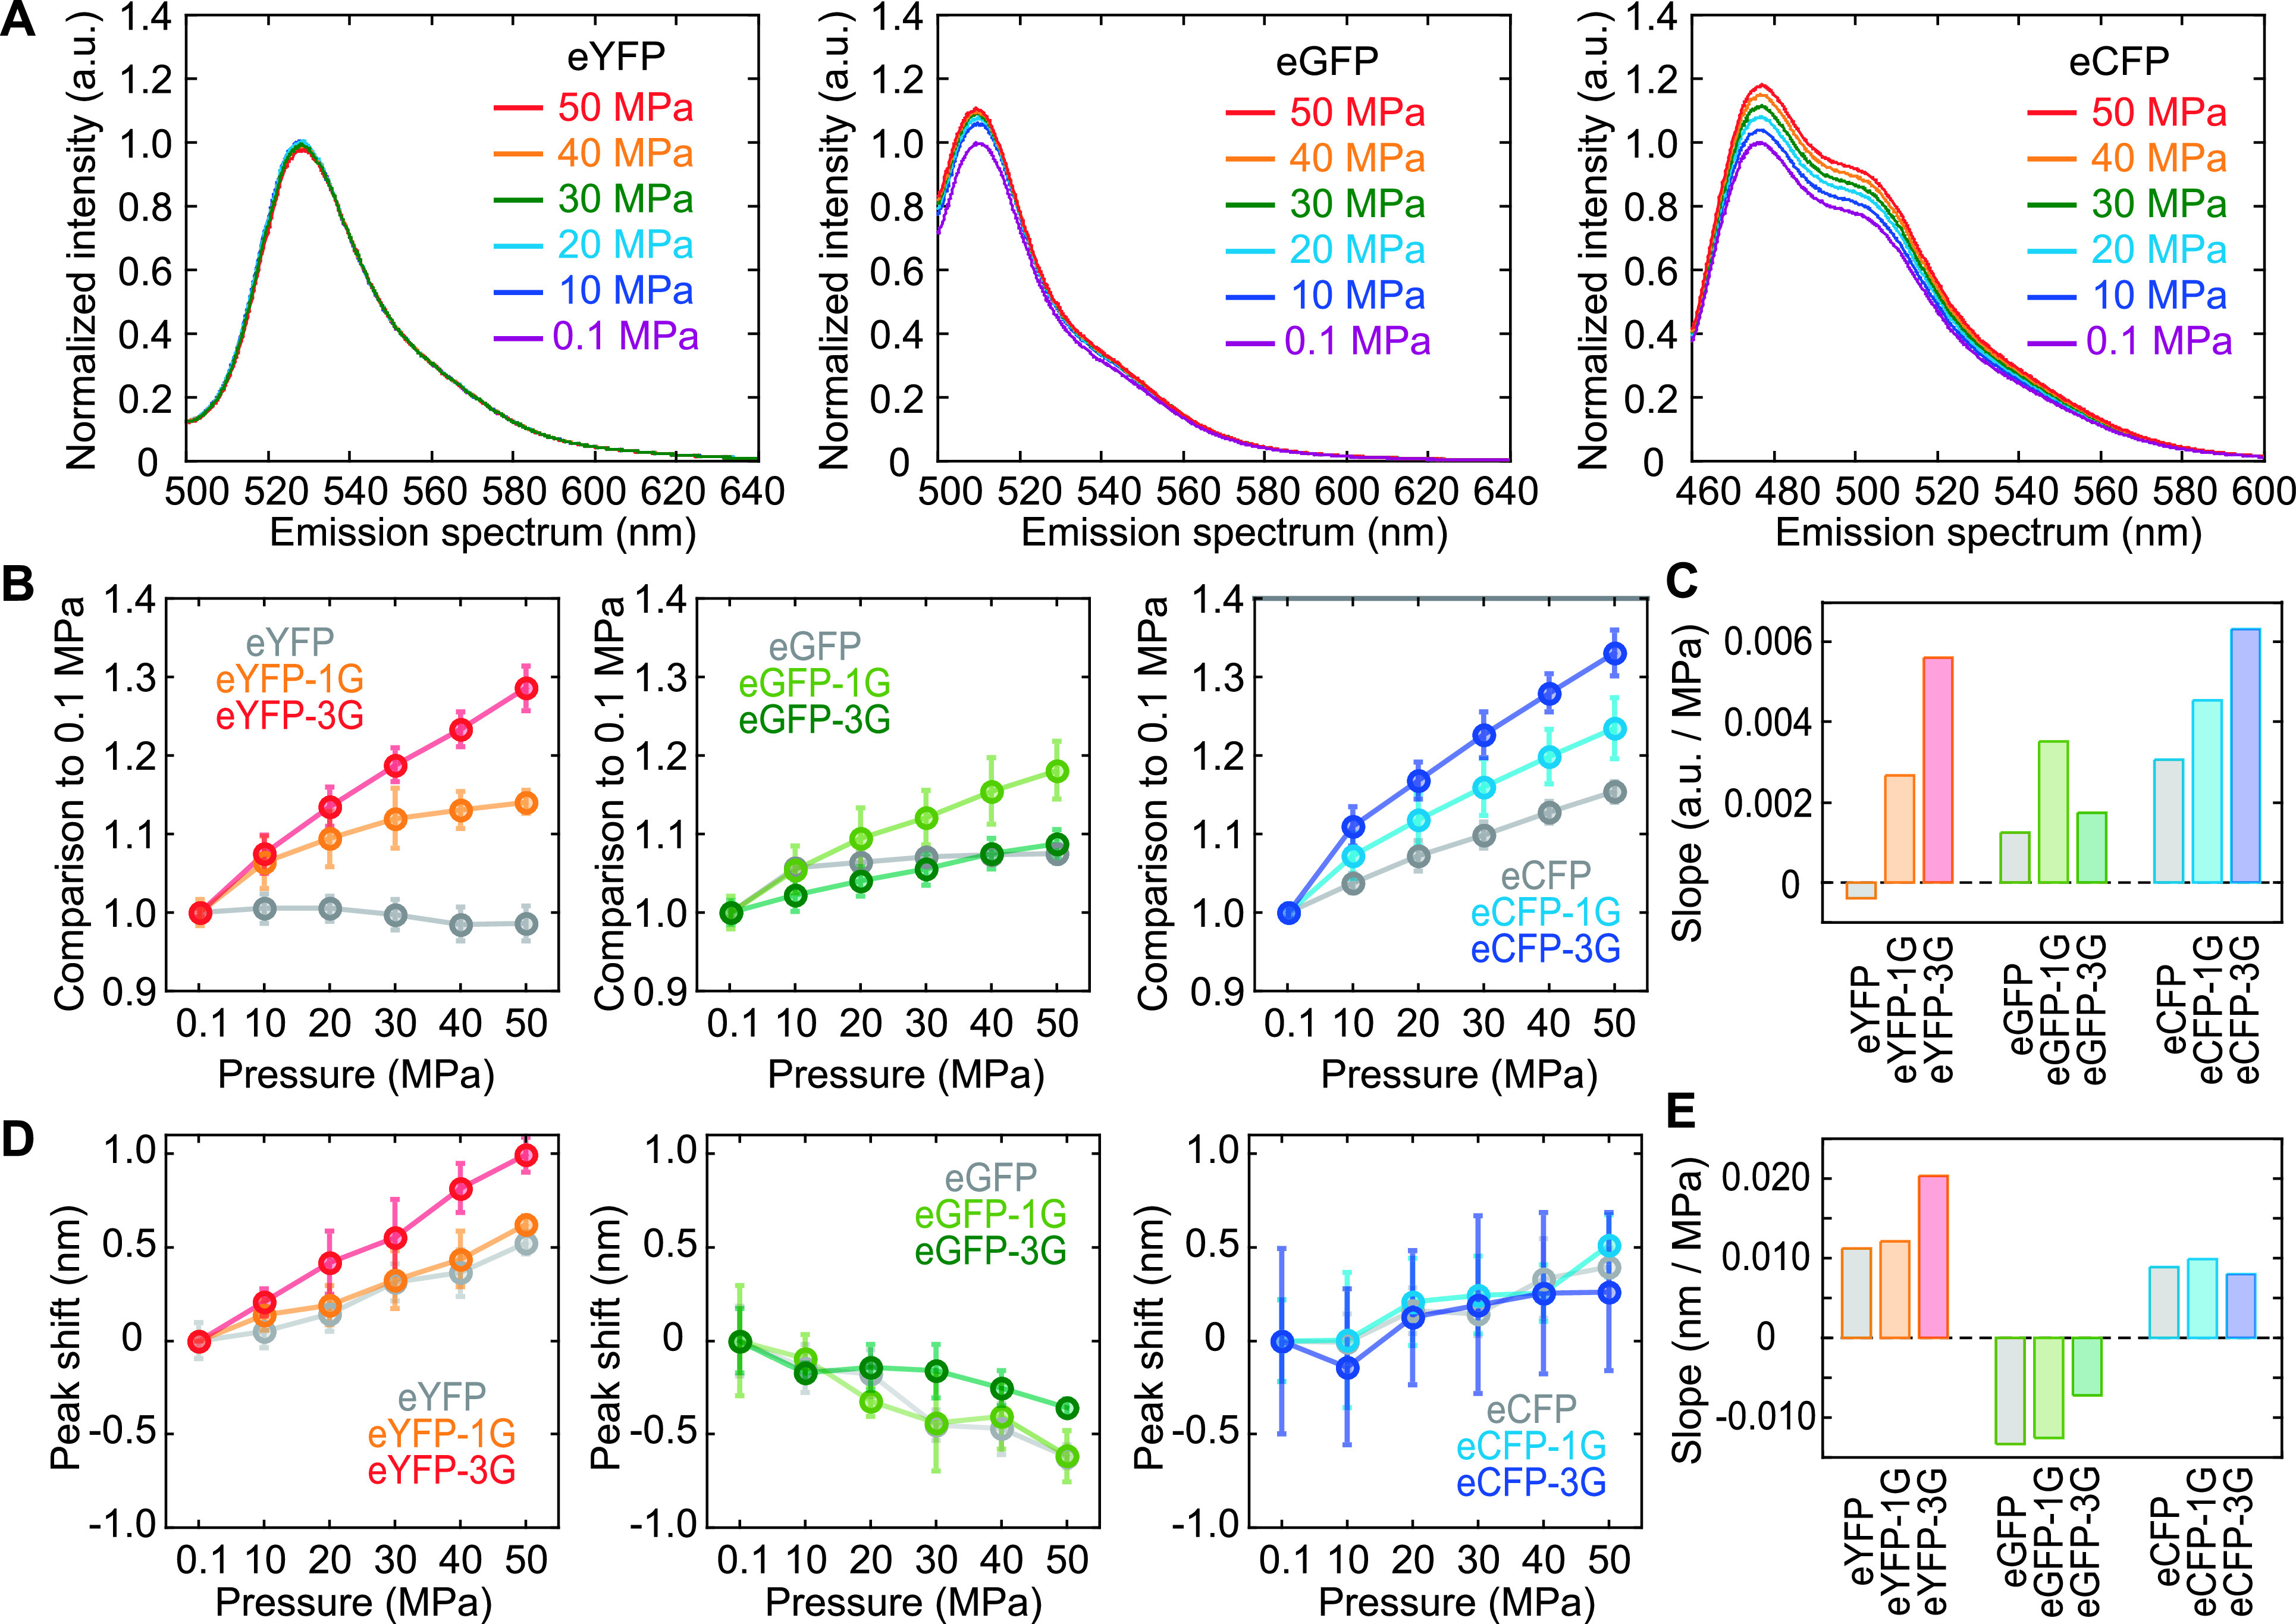
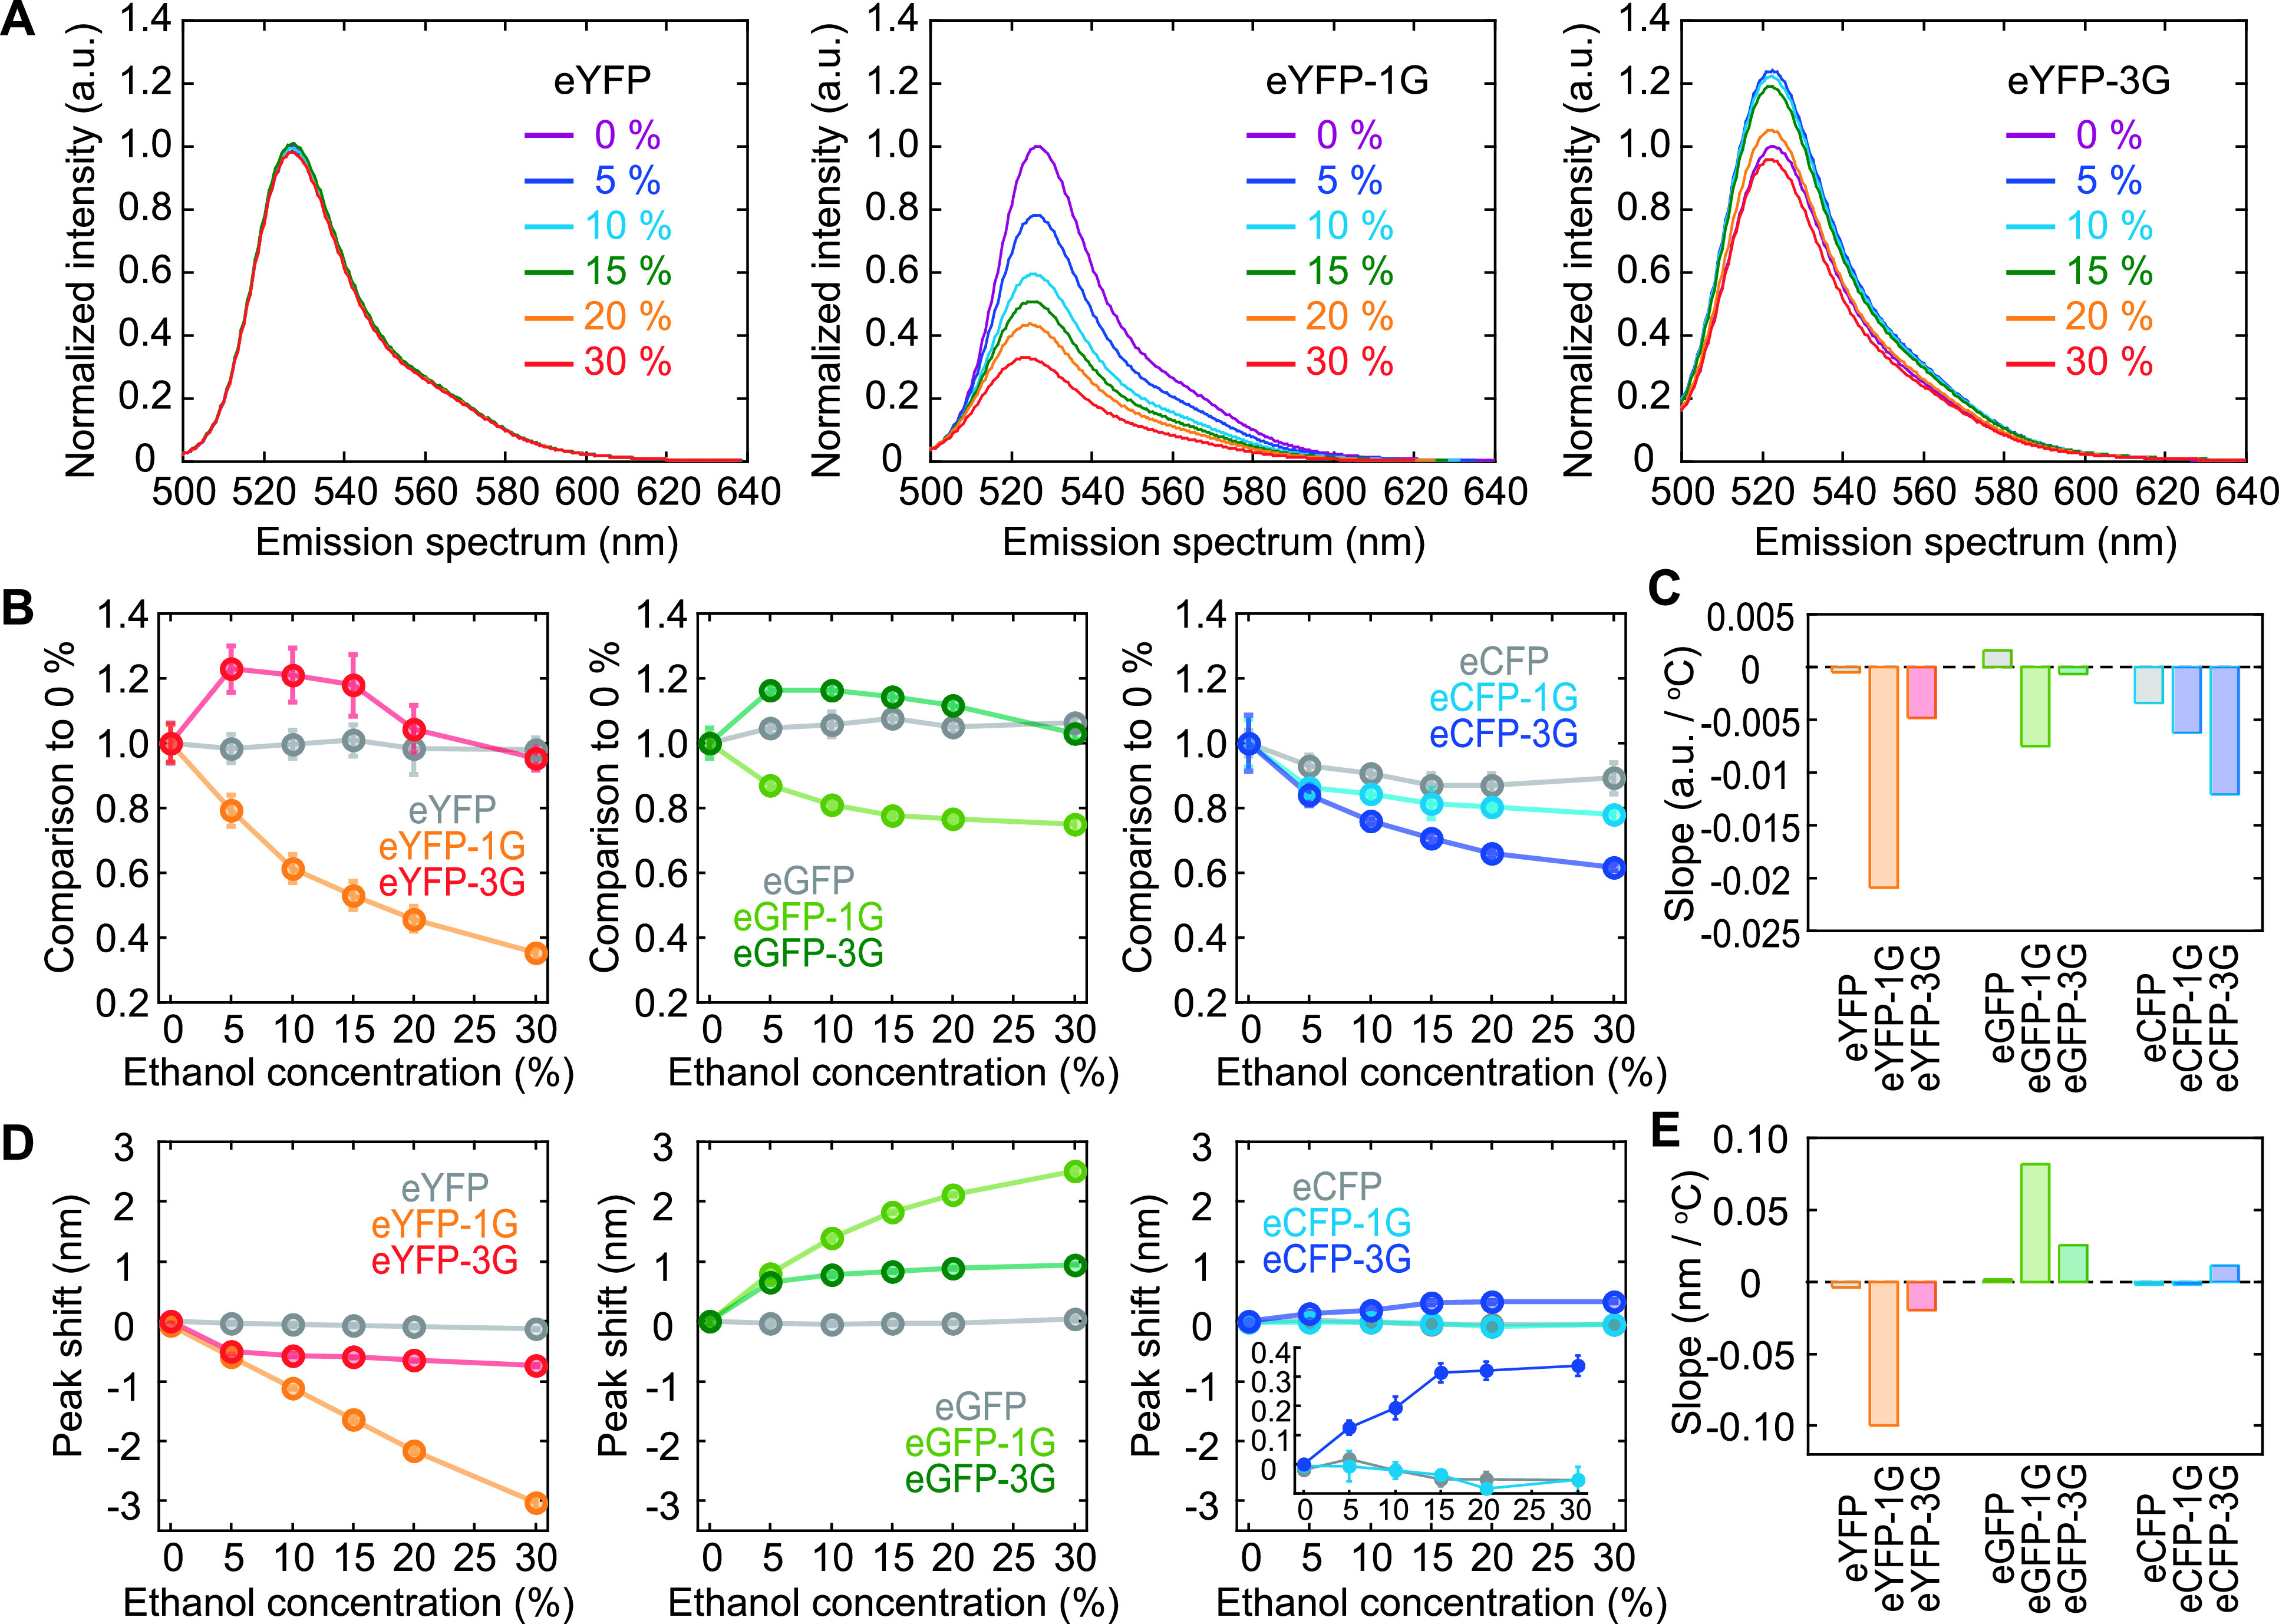
The green fluorescent protein (GFP) derived from Pacific Ocean jellyfish is an essential tool in biology. GFP-solvent interactions can modulate the fluorescent property of GFP. We previously reported that glycine insertion is an effective mutation in the yellow variant of GFP, yellow fluorescent protein (YFP). Glycine insertion into one of the β-strands comprising the barrel structure distorts its structure, allowing water molecules to invade near the chromophore, enhancing hydrostatic pressure or solution hydrophobicity sensitivity. However, the underlying mechanism of how glycine insertion imparts environmental sensitivity to YFP has not been elucidated yet. To unveil the relationship between fluorescence and β-strand distortion, we investigated the effects of glycine insertion on the dependence of the optical properties of GFP variants named enhanced-GFP (eGFP) and its yellow (eYFP) and cyan (eCFP) variants with respect to pH, temperature, pressure, and hydrophobicity. Our results showed that the quantum yield decreased depending on the number of inserted glycines in all variants, and the dependence on pH, temperature, pressure, and hydrophobicity was altered, indicating the invasion of water molecules into the β-barrel. Peak shifts in the emission spectrum were observed in glycine-inserted eGFP, suggesting a change of the electric state in the excited chromophore. A comparative investigation of the spectral shift among variants under different conditions demonstrated that glycine insertion rearranged the hydrogen bond network between His148 and the chromophore. The present results provide important insights for further understanding the fluorescence mechanism in GFPs and suggest that glycine insertion could be a potent approach for investigating the relationship between water molecules and the intra-protein chromophore.
Keywords: Fluorescence spectroscopy; ethanol concentration-dependence; pH-dependence; pressure-dependence; temperature-dependence.
2021 THE BIOPHYSICAL SOCIETY OF JAPAN.
Figures
Similar articles
-
Amino acid residue at the 165th position tunes EYFP chromophore maturation. A structure-based design.Comput Struct Biotechnol J. 2021 May 11;19:2950-2959. doi: 10.1016/j.csbj.2021.05.017. eCollection 2021. Comput Struct Biotechnol J. 2021. PMID: 34136094 Free PMC article.
-
Structural basis of spectral shifts in the yellow-emission variants of green fluorescent protein.Structure. 1998 Oct 15;6(10):1267-77. doi: 10.1016/s0969-2126(98)00127-0. Structure. 1998. PMID: 9782051
-
Glycine insertion makes yellow fluorescent protein sensitive to hydrostatic pressure.PLoS One. 2013 Aug 27;8(8):e73212. doi: 10.1371/journal.pone.0073212. eCollection 2013. PLoS One. 2013. PMID: 24014139 Free PMC article.
-
Green fluorescent protein.Photochem Photobiol. 1995 Oct;62(4):651-6. doi: 10.1111/j.1751-1097.1995.tb08712.x. Photochem Photobiol. 1995. PMID: 7480149 Review.
-
The color of mice: in the light of GFP-variant reporters.Histochem Cell Biol. 2001 Jan;115(1):49-58. doi: 10.1007/s004180000233. Histochem Cell Biol. 2001. PMID: 11219608 Review.
Cited by
-
High hydrostatic pressure induces slow contraction in mouse cardiomyocytes.Biophys J. 2022 Sep 6;121(17):3286-3294. doi: 10.1016/j.bpj.2022.07.016. Epub 2022 Jul 14. Biophys J. 2022. PMID: 35841143 Free PMC article.
References
-
- Shimomura, O., Johnson, F. H. & Saiga, Y.. Extraction, purification and properties of aequorin, a bioluminescent protein from the luminous hydromedusan. Aequorea. J. Cell. Comp. Physiol. 59, 223–239 (1962). DOI: 10.1002/jcp.1030590302 - PubMed
-
- Prasher, D. C., Eckenrode, V. K., Ward, W. W., Prendergast, F. G. & Cormier, M. J.. Primary structure of the Aequorea victoria green-fluorescent protein. Gene 111, 229–233 (1992). DOI: 10.1016/0378-1119(92)90691-H - PubMed
-
- Cubitt, A. B., Heim, R., Adams, S. R., Boyd, A. E., Gross, L. A. & Tsien, R. Y.. Understanding, improving and using green fluorescent proteins. Trends Biochem. Sci. 20, 448–455 (1995). DOI: 10.1016/S0968-0004(00)89099-4 - PubMed
-
- Tsien, R. Y. The green fluorescent protein. Annu. Rev. Biochem. 67, 509–544 (1998). DOI: 10.1146/annurev.biochem.67.1.509 - PubMed