

Construction and Validation of a Universal Applicable Prognostic Signature for Gastric Cancer Based on Seven Immune-Related Gene Correlated With Tumor Associated Macrophages
- PMID: 34178625
- PMCID: PMC8226085
- DOI: 10.3389/fonc.2021.635324
Construction and Validation of a Universal Applicable Prognostic Signature for Gastric Cancer Based on Seven Immune-Related Gene Correlated With Tumor Associated Macrophages
Abstract
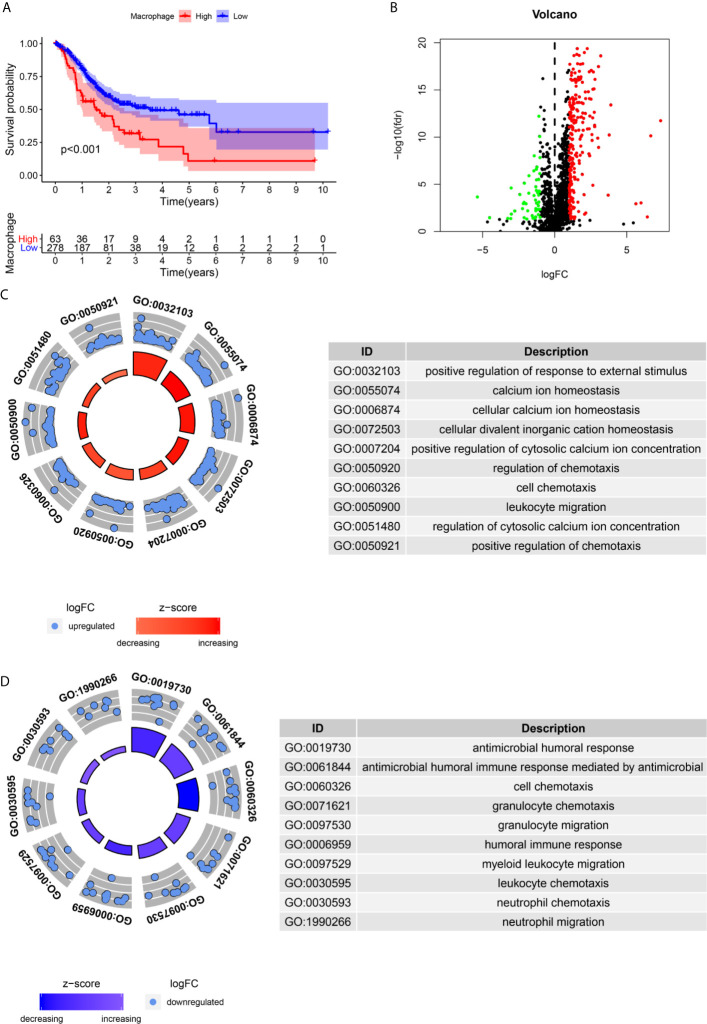
Background: Tumor-associated macrophages (TAMs) play a critical role in the progression of malignant tumors, but the detailed mechanism of TAMs in gastric cancer (GC) is still not fully explored.
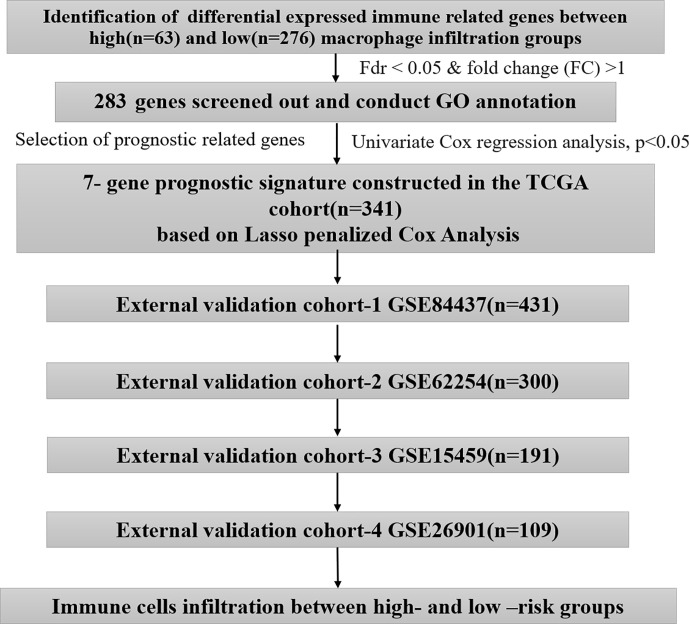
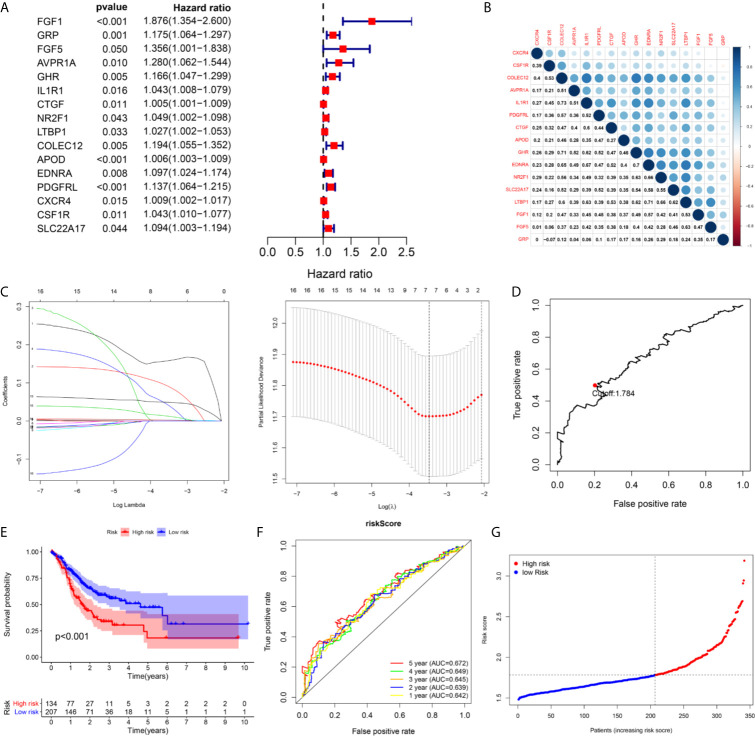
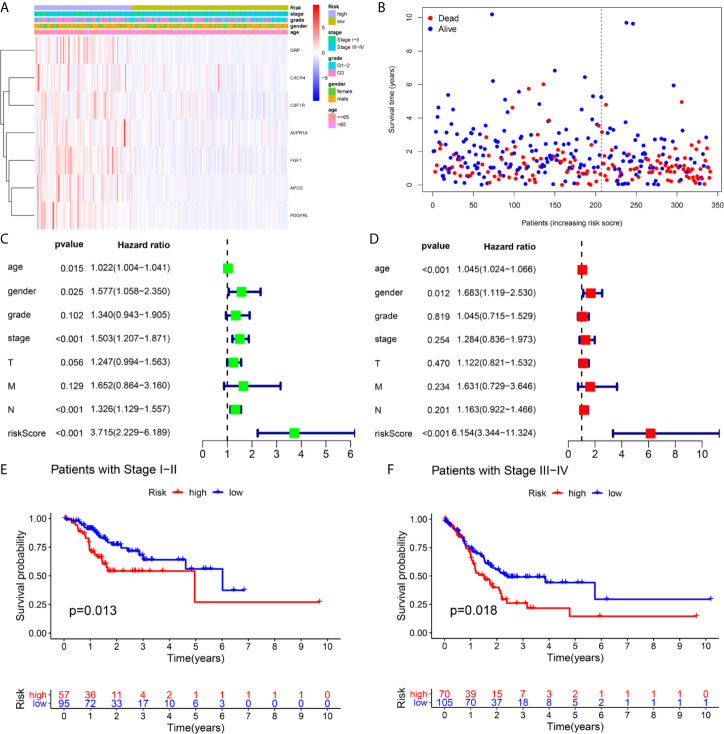
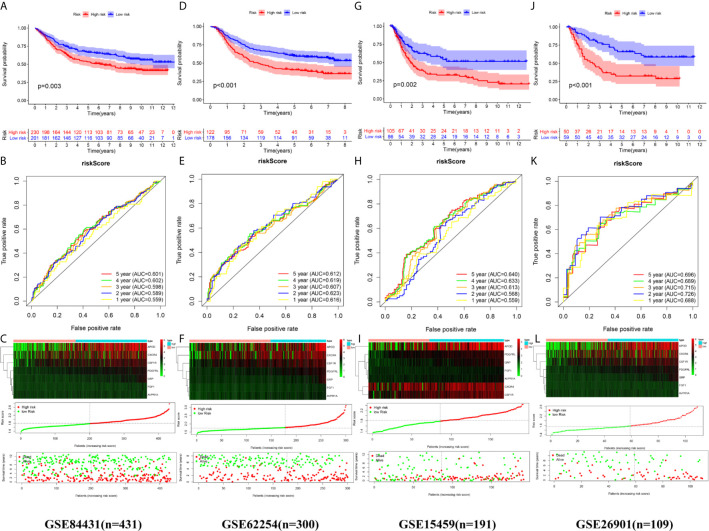
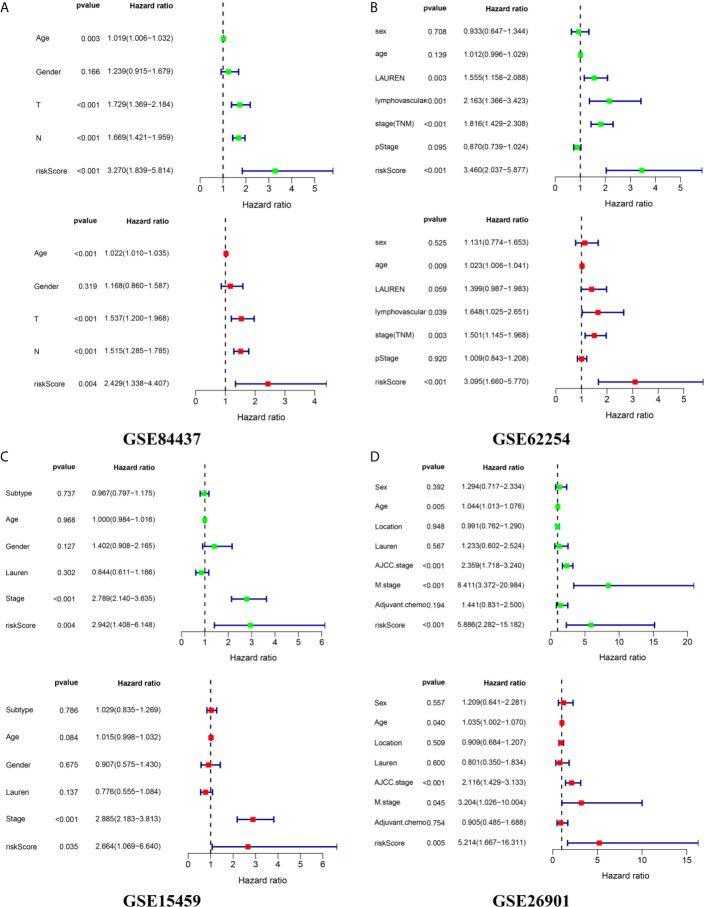
Methods: We identified differentially expressed immune-related genes (DEIRGs) between GC samples with high and low macrophage infiltration in The Cancer Genome Atlas datasets. A risk score was constructed based on univariate Cox analysis and Lasso penalized Cox regression analysis in the TCGA cohort (n=341). The optimal cutoff determined by the 5-year time-dependent receiver operating characteristic (ROC) curve was considered to classify patients into groups with high and low risk. We conducted external validation of the prognostic signature in four independent cohorts (GSE84437, n=431; GSE62254, n=300; GSE15459, n=191; and GSE26901, n=109) from the Gene Expression Omnibus (GEO) database.
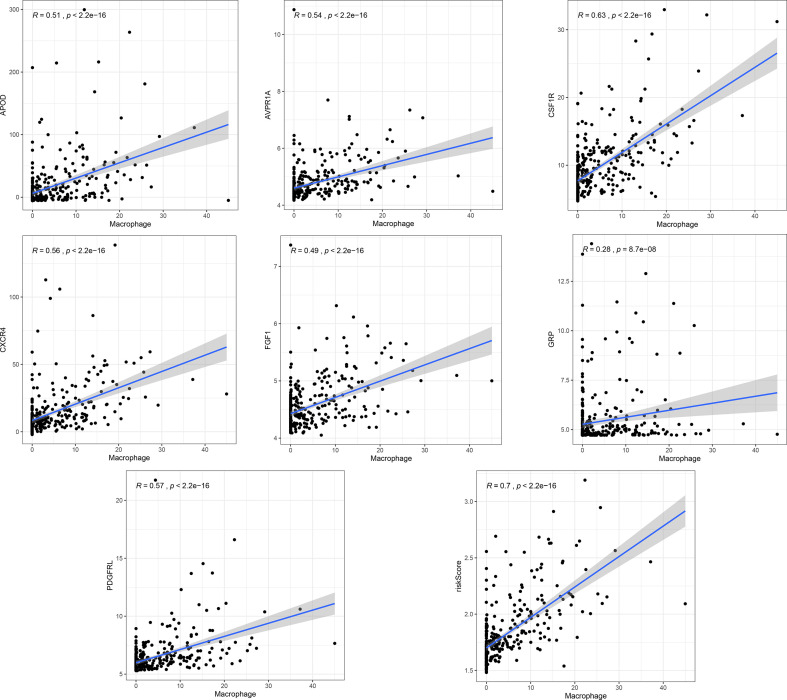
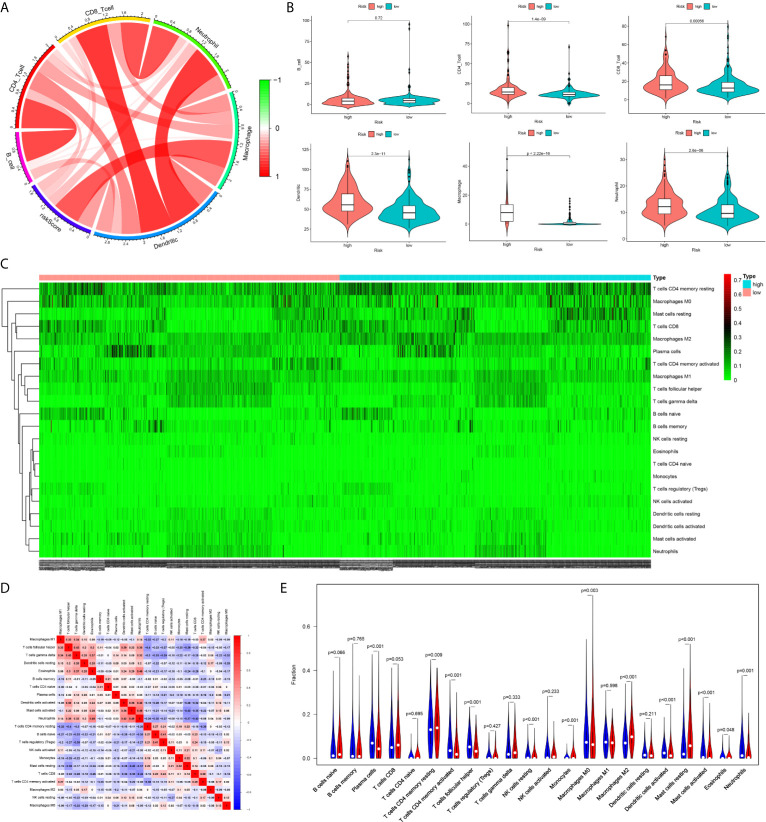
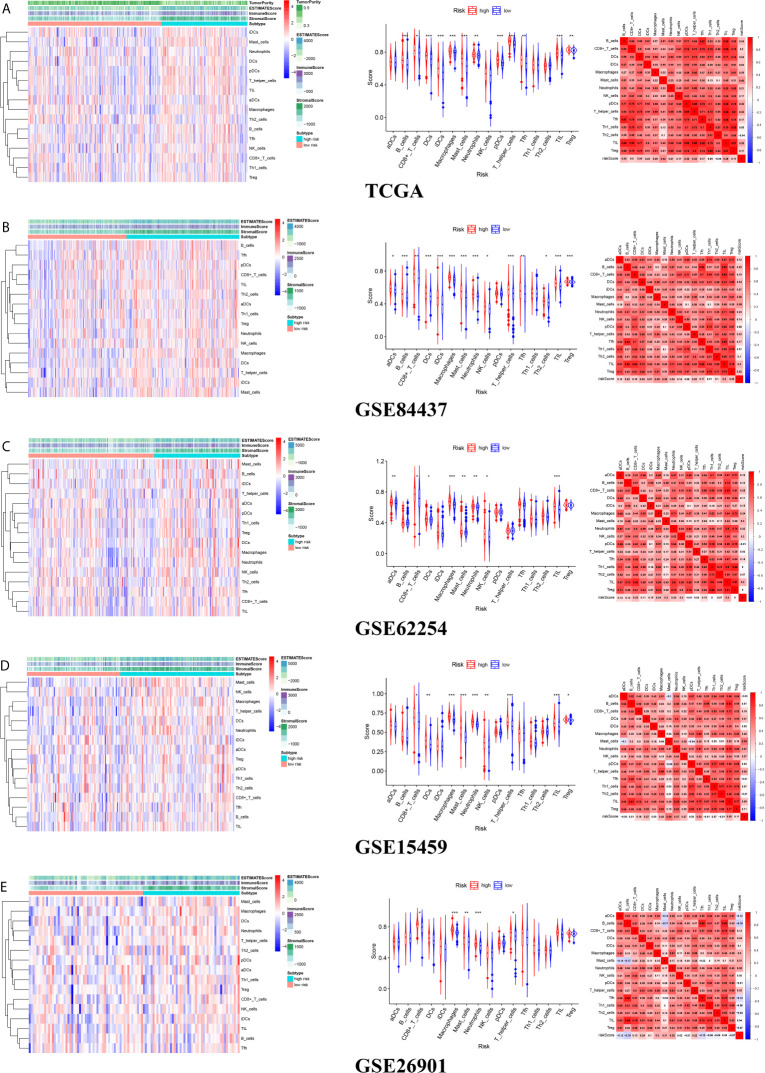
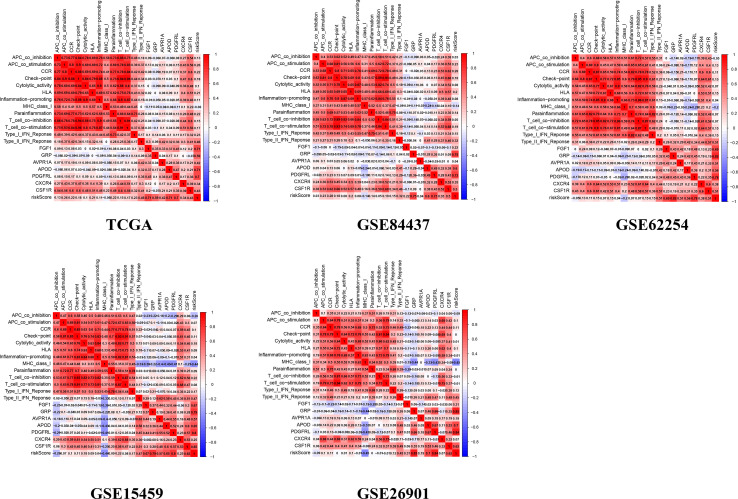
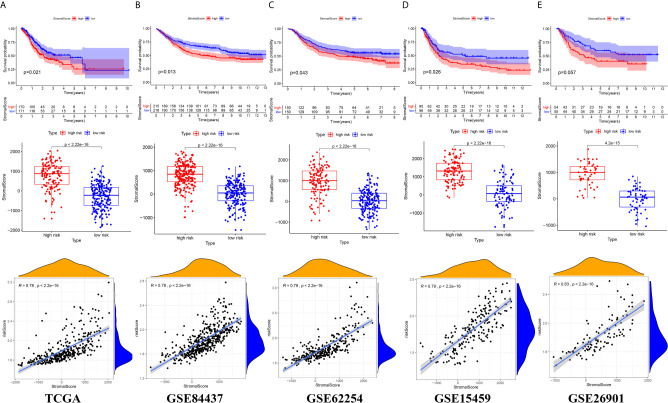
Results: The signature consisting of 7 genes (FGF1, GRP, AVPR1A, APOD, PDGFRL, CXCR4, and CSF1R) showed good performance in predicting overall survival (OS) in the 5 independent cohorts. The risk score presented an obviously positive correlation with macrophage abundance (cor=0.7, p<0.001). A significant difference was found between the high- and low-risk groups regarding the overall survival of GC patients. The high-risk group exhibited a higher infiltration level of M2 macrophages estimated by the CIBERSORT algorithm. In the five independent cohorts, the risk score was highly positively correlated with the stromal cell score, suggesting that we can also evaluate the infiltration of stromal cells in the tumor microenvironment according to the risk score.
Conclusion: Our study developed and validated a general applicable prognostic model for GC from the perspective of TAMs, which may help to improve the precise treatment strategy of GC.
Keywords: gastric cancer; immune; macrophages; prognostic; signature.
Copyright © 2021 Huo, Wu and Zang.
Conflict of interest statement
The authors declare that the research was conducted in the absence of any commercial or financial relationships that could be construed as a potential conflict of interest.
Figures
Similar articles
-
A novel necroptosis-related gene index for predicting prognosis and a cold tumor immune microenvironment in stomach adenocarcinoma.Front Immunol. 2022 Oct 27;13:968165. doi: 10.3389/fimmu.2022.968165. eCollection 2022. Front Immunol. 2022. PMID: 36389725 Free PMC article. Review.
-
Integrated analysis of 1804 samples of six centers to construct and validate a robust immune-related prognostic signature associated with stromal cell abundance in tumor microenvironment for gastric cancer.World J Surg Oncol. 2022 Jan 5;20(1):4. doi: 10.1186/s12957-021-02485-y. World J Surg Oncol. 2022. PMID: 34983559 Free PMC article.
-
Development and Validation of a Robust Immune-Related Prognostic Signature for Gastric Cancer.J Immunol Res. 2021 Apr 30;2021:5554342. doi: 10.1155/2021/5554342. eCollection 2021. J Immunol Res. 2021. PMID: 34007851 Free PMC article.
-
Eleven immune-gene pairs signature associated with TP53 predicting the overall survival of gastric cancer: a retrospective analysis of large sample and multicenter from public database.J Transl Med. 2021 Apr 29;19(1):183. doi: 10.1186/s12967-021-02846-x. J Transl Med. 2021. PMID: 33926488 Free PMC article.
-
Metabolism reprogramming signature associated with stromal cells abundance in tumor microenvironment improve prognostic risk classification for gastric cancer.BMC Gastroenterol. 2022 Jul 30;22(1):364. doi: 10.1186/s12876-022-02451-2. BMC Gastroenterol. 2022. PMID: 35907819 Free PMC article.
Cited by
-
Constructing and Validating a Pyroptosis-Related Genes Prognostic Signature for Stomach Adenocarcinoma and Immune Infiltration: Potential Biomarkers for Predicting the Overall Survival.J Oncol. 2022 Sep 26;2022:3102743. doi: 10.1155/2022/3102743. eCollection 2022. J Oncol. 2022. PMID: 36199800 Free PMC article.
-
Identification and validation of a novel immune-related signature associated with macrophages and CD8 T cell infiltration predicting overall survival for hepatocellular carcinoma.BMC Med Genomics. 2021 Sep 20;14(1):232. doi: 10.1186/s12920-021-01081-z. BMC Med Genomics. 2021. PMID: 34544391 Free PMC article.
-
Correlation between dyslipidaemia and gastric cancer: pathogenesis to prevention and treatment strategies.Lipids Health Dis. 2025 Jun 7;24(1):204. doi: 10.1186/s12944-025-02625-3. Lipids Health Dis. 2025. PMID: 40483484 Free PMC article. Review.
-
N6-methylandenosine-related immune genes correlate with prognosis and immune landscapes in gastric cancer.Front Oncol. 2022 Nov 29;12:1009881. doi: 10.3389/fonc.2022.1009881. eCollection 2022. Front Oncol. 2022. PMID: 36523987 Free PMC article.
-
A novel necroptosis-related gene index for predicting prognosis and a cold tumor immune microenvironment in stomach adenocarcinoma.Front Immunol. 2022 Oct 27;13:968165. doi: 10.3389/fimmu.2022.968165. eCollection 2022. Front Immunol. 2022. PMID: 36389725 Free PMC article. Review.
References
-
- Salmaninejad A, Valilou SF, Soltani A, Ahmadi S, Abarghan YJ, Rosengren RJ, et al. . Tumor-Associated Macrophages: Role in Cancer Development and Therapeutic Implications. Cell Oncol (Dordr) (2019) 42(5):1–18. - PubMed
LinkOut - more resources
Full Text Sources
Miscellaneous