. 2021 Feb:8:606664.
doi: 10.3389/fphy.2020.606664. Epub 2021 Feb 15.

Shear wave dispersion as a potential biomarker for cervical remodeling during pregnancy: evidence from a non-human primate model

Affiliations

Shear wave dispersion as a potential biomarker for cervical remodeling during pregnancy: evidence from a non-human primate model

Abel Torres et al. Front Phys. 2021 Feb.

Abstract

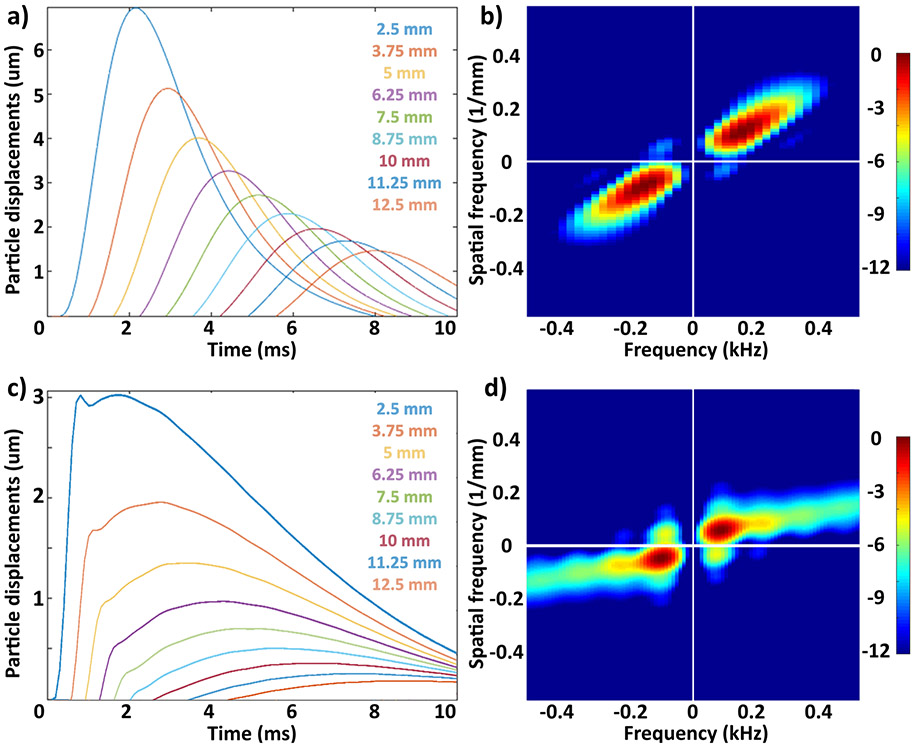
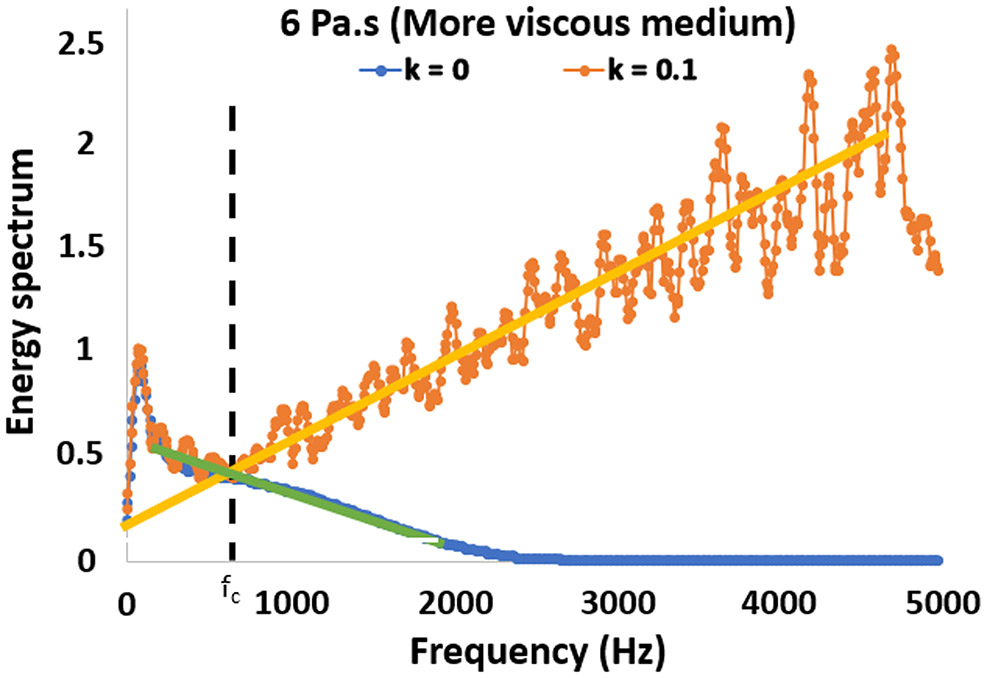
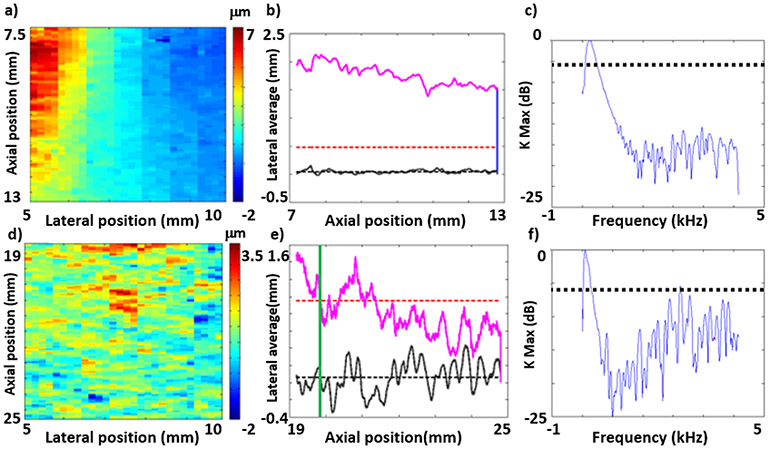
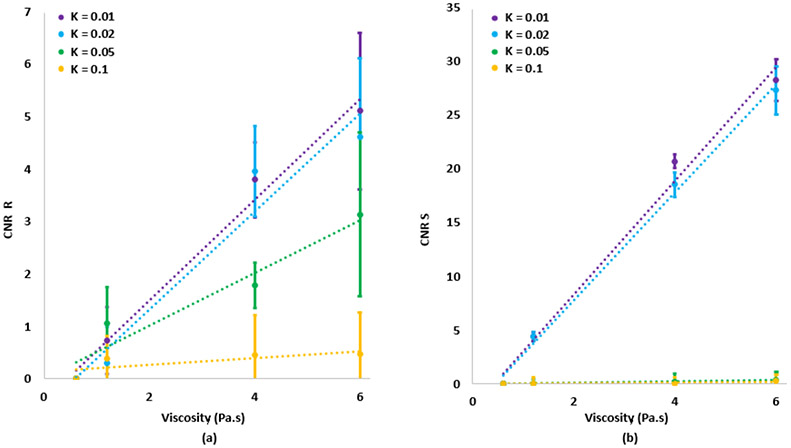
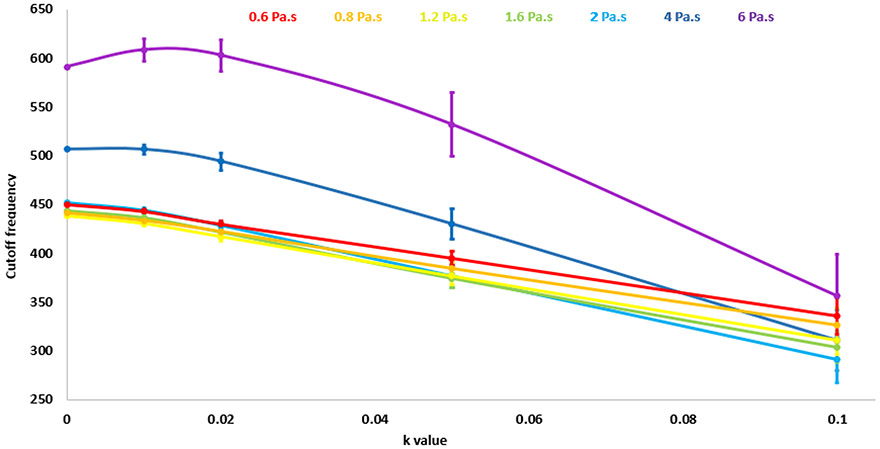
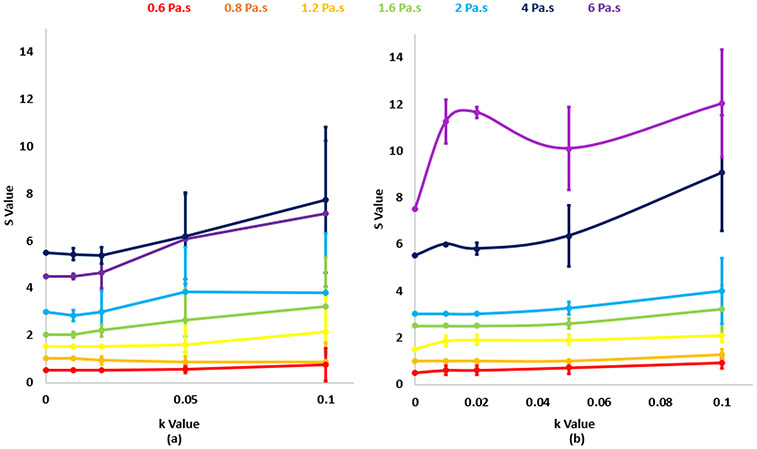
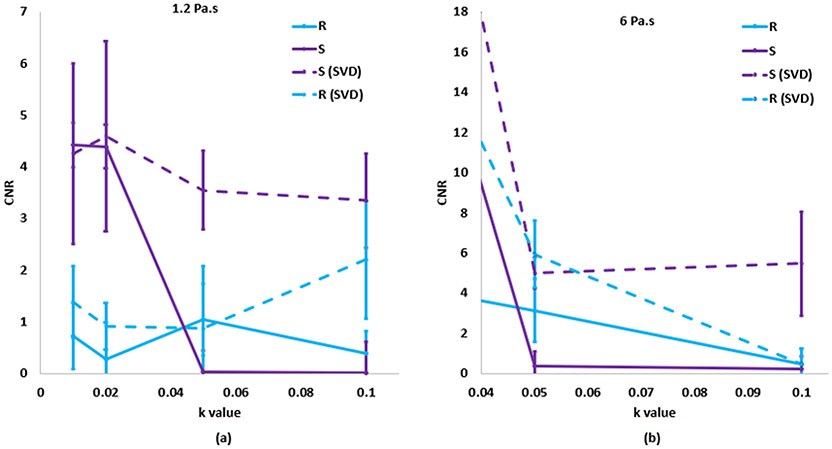
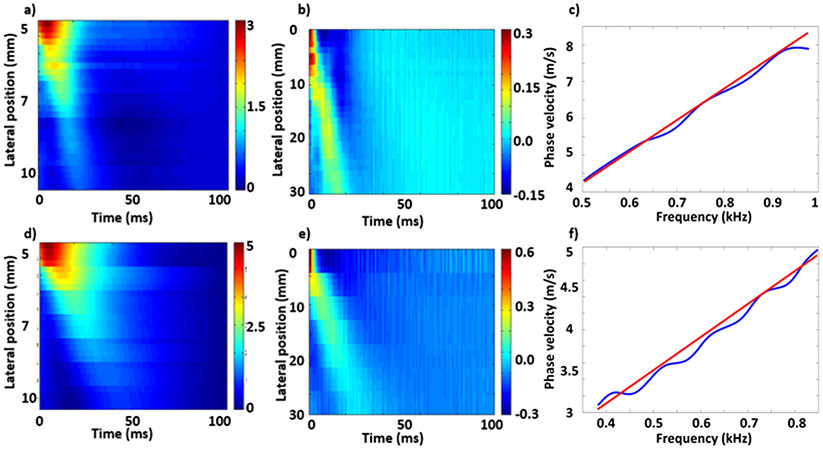
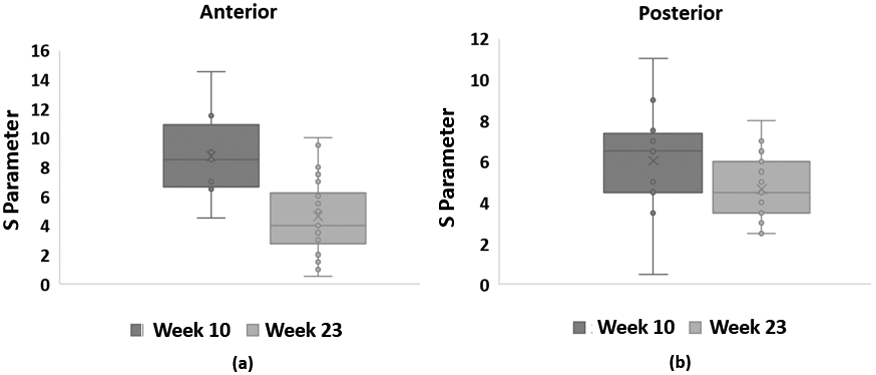
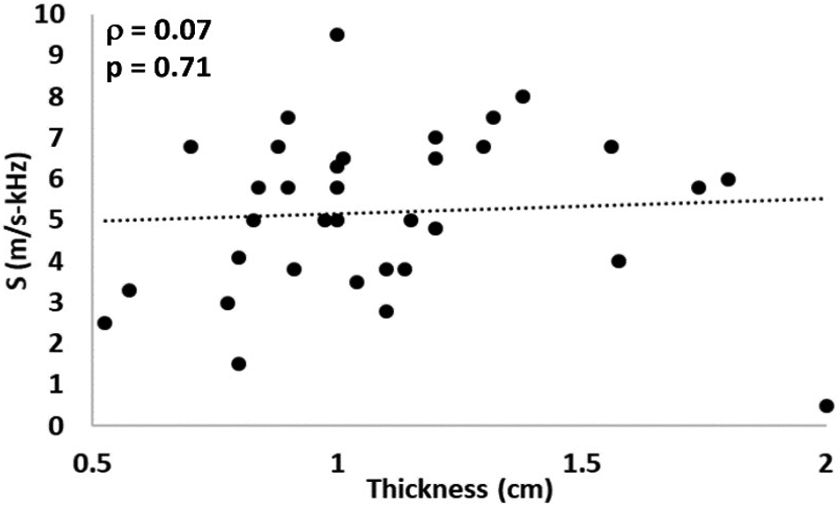
Shear wave dispersion (variation of phase velocity with frequency) occurs in tissues with layered and anisotropic microstructure and viscous components, such as the uterine cervix. This phenomenon, mostly overlooked in previous applications of cervical Shear Wave Elasticity Imaging (SWEI) for preterm birth risk assessment, is expected to change drastically during pregnancy due to cervical remodeling. Here we demonstrate the potential of SWEI-based descriptors of dispersion as potential biomarkers for cervical remodeling during pregnancy. First, we performed a simulation-based pre-selection of two SWEI-based dispersion descriptors: the ratio R of group velocities computed with particle-velocity and particle-displacement, and the slope S of the phase velocity vs. frequency. The pre-selection consisted of comparing the contrast-to-noise ratio (CNR) of dispersion descriptors in materials with different degrees of dispersion with respect to a low-dispersive medium. Shear waves induced in these media by SWEI were simulated with a finite-element model of Zener viscoelastic solids. The pre-selection also considered two denoising strategies to improve CNR: a low-pass filter with automatic frequency cutoff determination, and singular value decomposition of shear wave displacements. After pre-selection, the descriptor-denoising combination that produced the largest CNR was applied to SWEI cervix data from 18 pregnant Rhesus macaques acquired at weeks 10 (mid-pregnancy stage) and 23 (late pregnancy stage) of the 24.5-week full pregnancy. A maximum likelihood linear mixed-effects model (LME) was used to evaluate the dependence of the dispersion descriptor on pregnancy stage, maternal age, parity and other experimental factors. The pre-selection study showed that descriptor S combined with singular value decomposition produced a CNR 11.6 times larger than the other descriptor and denoising strategy combinations. In the Non-Human Primates (NHP) study, the LME model showed that descriptor S significantly decreased from mid to late pregnancy (-0.37 ± 0.07 m/s-kHz per week, p <0.00001) with respect to the base value of 15.5 ± 1.9 m/s-kHz. This change was more significant than changes in other SWEI features such as the group velocity previously reported. Also, S varied significantly between the anterior and posterior portions of the cervix (p =0.02) and with maternal age (p =0.008). Given the potential of shear wave dispersion to track cervical remodeling, we will extend its application to ongoing longitudinal human studies.

Keywords: Cervix; Rhesus macaque; group velocity; phase velocity; pregnancy; shear wave elasticity imaging; singular value decomposition.


Figures

Figure 1.
Figure 1.
(a) and (c) Particle displacements as a function of time induced in the simulated viscoelastic media with 0.6 and 6 Pa.s viscosity, respectively. Labels indicate the distance from the center of the ARF stimulus. (b) y (d) Fourier spectra for the same media. The spectrum peak occurs within a frequency range from 100 to 200 Hz.
Figure 2.
Figure 2.
Projected particle velocity spectrum of a viscoelastic solid with 6.0 Pa s viscosity and a k = 0.1 noise level (orange curve). The green and yellow lines are linear fits to the noisy spectrum at low (0.1kHz-0.5kHz) and high frequencies (1kHz-5kHz), respectively. The intersection of both fits allows determination of the cutoff frequency fc. The blue curve shows the noise-free case to demonstrate the agreement of the fit over noisy data to the noiseless case.
Figure 3.
Figure 3.
Examples of data that was included (A,B,C) and rejected (D,E,F) based on the quality criteria defined for the longitudinal study in Rhesus macaques.
Figure 4.
Figure 4.
Contrast-to-noise ratio for either R and S parámeters in function of the viscosity for different leveles of noise. Error bars represent standard deviations over twenty repetitions.
Figure 5.
Figure 5.
Cutoff frequency values obtained through the automatic method as a function of the noise parameter K. Each curve corresponds to a different viscosity degree.
Figure 6.
Figure 6.
CTER values of the S parameter as a function of the cutoff eigenvalue for the most viscous medium (6 Pa.s) and the less viscous (0.8 Pa.s).
Figure 7.
Figure 7.
S parameter calculated with the automated low-pass filter (A) and the singular value decomposition filter (B) as a function of the noise level k. Each curve corresponds to a different degree of viscosity η.
Figure 8.
Figure 8.
Comparison of the contrast-to-noise ratio as a function of the noise level for the highest and lowest degrees of viscosity before and after apply the singular value decomposition filter.
Figure 9.
Figure 9.
Particle displacements (A, D), particle velocities (B, E) and dispersion curves (C, F) for the filtered data in the early (A, B, C) and late (D, E, F) week of gestation in the longitudinal study. In the dispersion curves, the blue line is the value of the phase velocity measured at the maximum power at each temporal frequency, and the red line is the linear fit.
Figure 10.
Figure 10.
Box plots for the S parameter estimated from in vivo NHP SWEI data at weeks 10 and 23 of pregnancy. The central line and cross indicate the median and mean, the top and bottom limits of the box represent the interquarrtile range, the wiskers indicate the range defined as 1.95 times the interquartile range above and below the 25 and 75 percentiles, and the circles indicate values for each subject.
Figure 11.
Figure 11.
Shear wave dispersion parameter S vs. cervical thickness in the NHP model. Pearson’s correlation values was ρ=0.07 (p=0.71).

Similar articles

Cited by

References

    1. Vogel JP, Chawanpaiboon S, Watananirun K, Lumbiganon P, Petzold M, Moller AB, et al. Global, regional and national levels and trends of preterm birth rates for 1990 to 2014: protocol for development of world health organization estimates. Reproductive health 13 (2016) 76. - PMC - PubMed
    1. Feltovich H Cervical evaluation: from ancient medicine to precision medicine. Obstetrics and gynecology 130 (2017) 51. - PMC - PubMed
    1. Feltovich H, Hall TJ, Berghella V. Beyond cervical length: emerging technologies for assessing the pregnant cervix. American journal of obstetrics and gynecology 207 (2012) 345–354. - PMC - PubMed
    1. Yellon SM. Immunobiology of cervix ripening. Frontiers in Immunology 10 (2019). - PMC - PubMed
    1. Akgul Y, Holt R, Mummert M, Word A, Mahendroo M. Dynamic changes in cervical glycosaminoglycan composition during normal pregnancy and preterm birth. Endocrinology 153 (2012)3493–3503. - PMC - PubMed

LinkOut - more resources