. 2020 Feb 1;8(4):493-508.
doi: 10.1016/j.gendis.2020.01.015. eCollection 2021 Jul.

ITGA2 promotes expression of ACLY and CCND1 in enhancing breast cancer stemness and metastasis

Affiliations

ITGA2 promotes expression of ACLY and CCND1 in enhancing breast cancer stemness and metastasis

Valery Adorno-Cruz et al. Genes Dis. .

Abstract

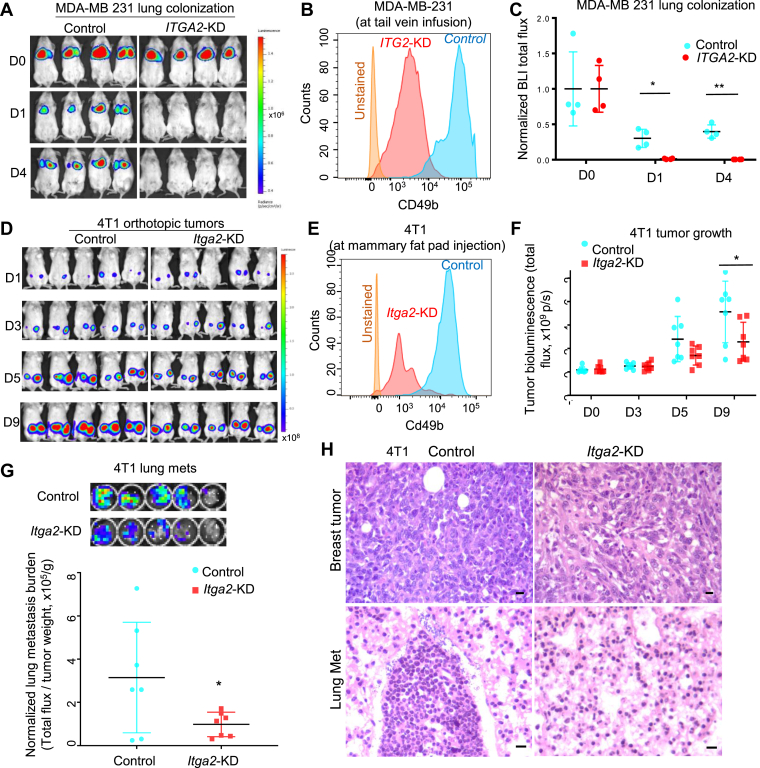
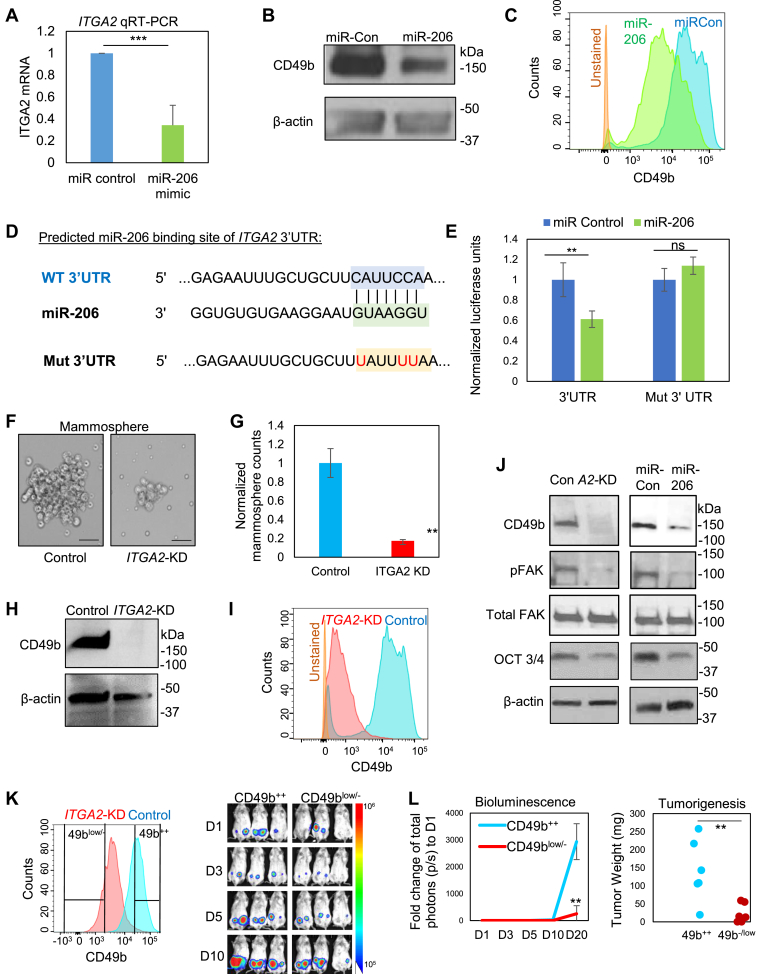
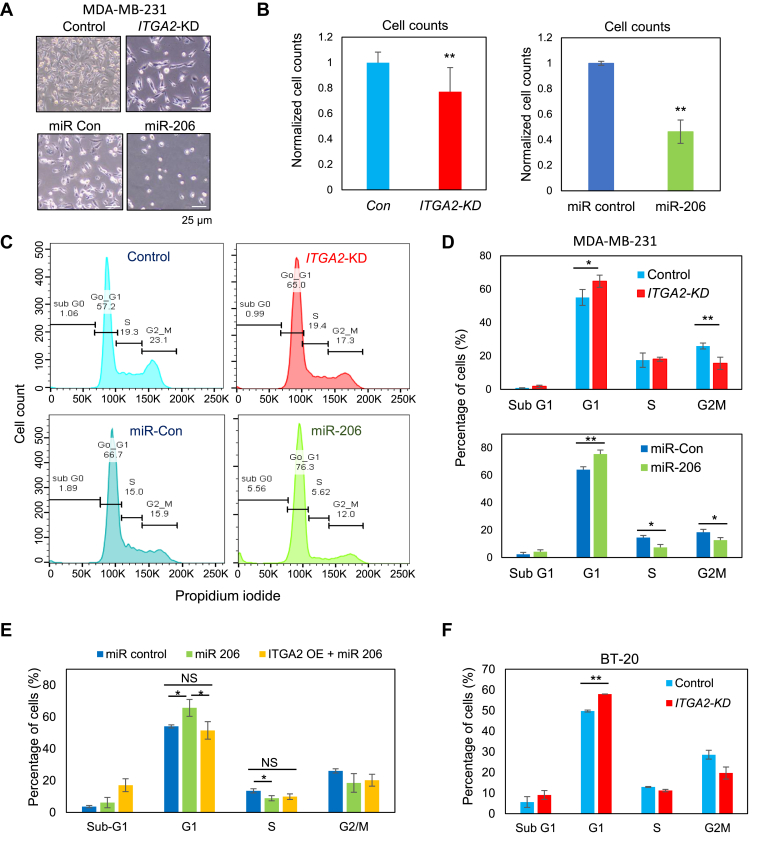
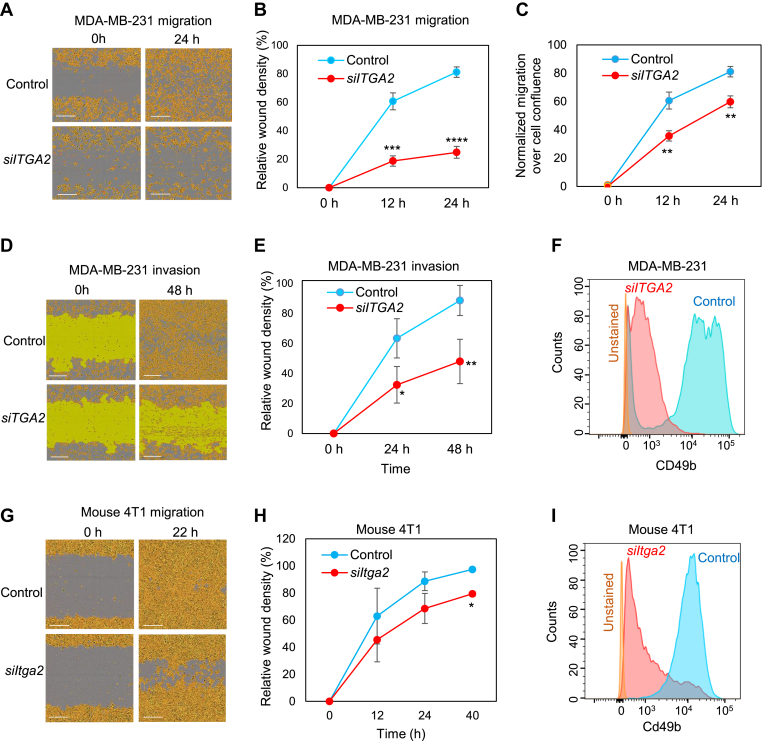
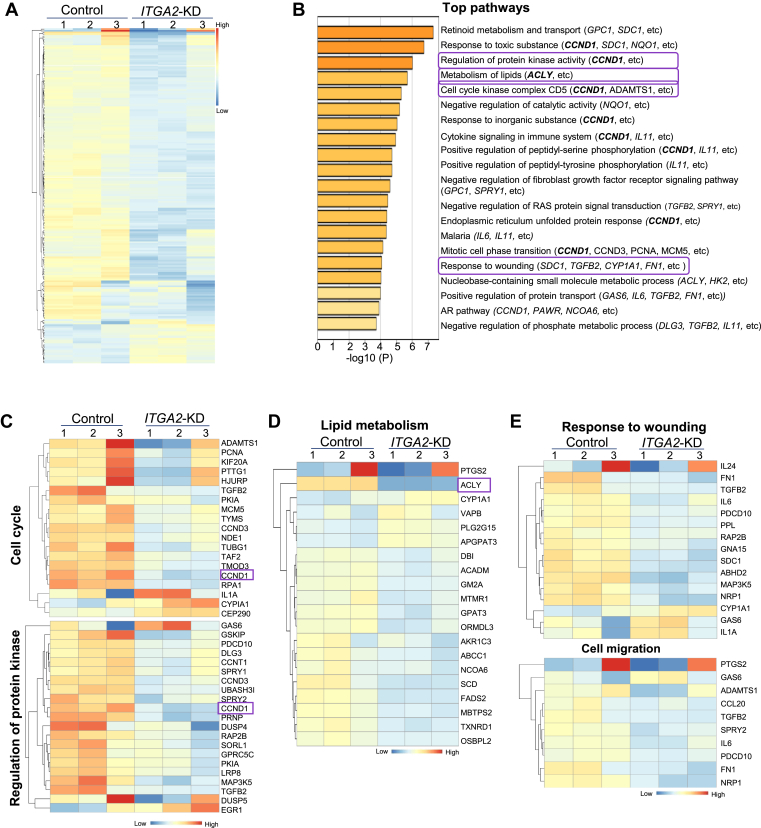
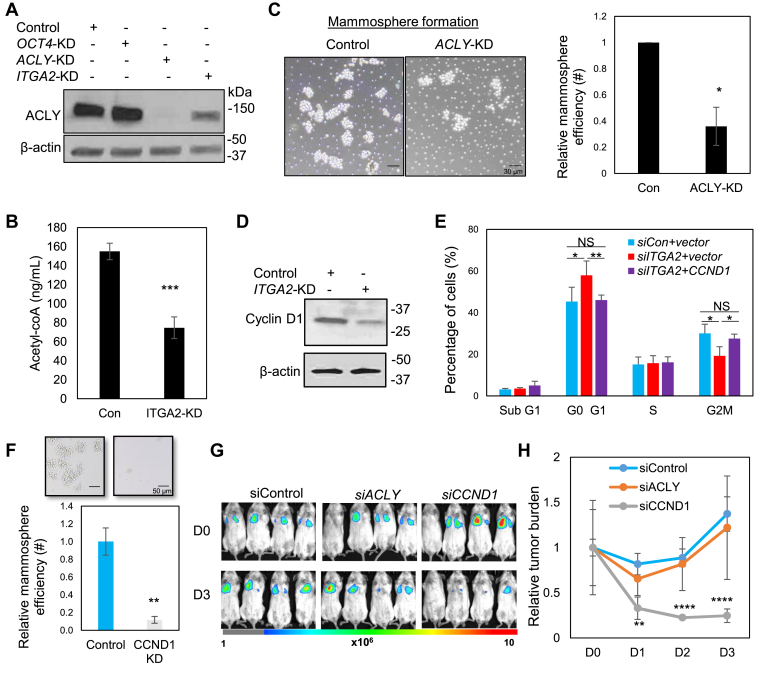
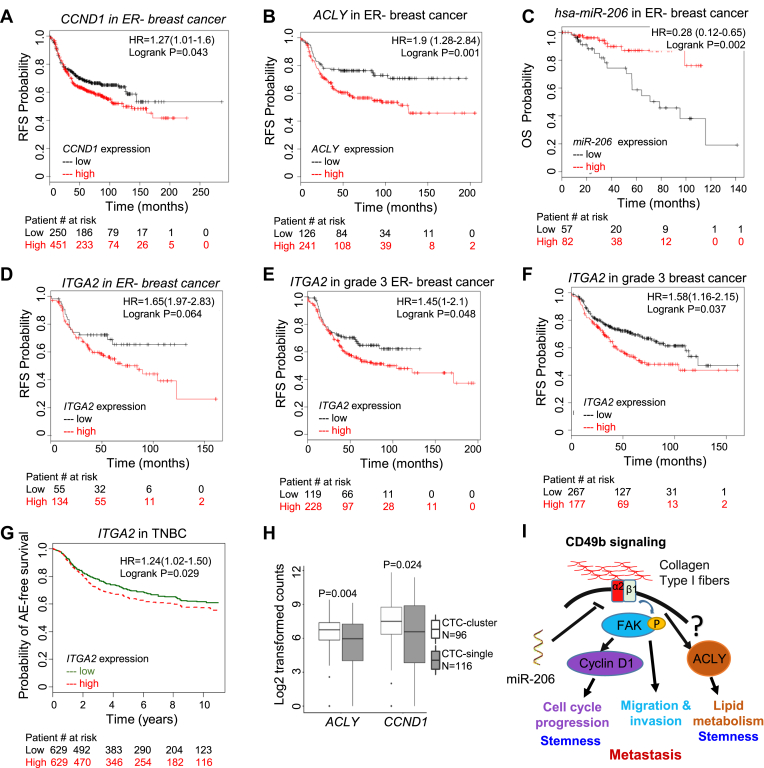
Cancer metastasis is largely incurable and accounts for 90% of breast cancer deaths, especially for the aggressive basal-like or triple negative breast cancer (TNBC). Combining patient database analyses and functional studies, we examined the association of integrin family members with clinical outcomes as well as their connection with previously identified microRNA regulators of metastasis, such as miR-206 that inhibits stemness and metastasis of TNBC. Here we report that the integrin receptor CD49b-encoding ITGA2, a direct target of miR-206, promotes breast cancer stemness and metastasis. ITGA2 knockdown suppressed self-renewal related mammosphere formation and pluripotency marker expression, inhibited cell cycling, compromised migration and invasion, and therefore decreased lung metastasis of breast cancer. ITGA2 overexpression reversed miR-206-caused cell cycle arrest in G1. RNA sequencing analyses revealed that ITGA2 knockdown inhibits genes related to cell cycle regulation and lipid metabolism, including CCND1 and ACLY as representative targets, respectively. Knockdown of CCND1 or ACLY inhibits mammosphere formation of breast cancer cells. Overexpression of CCND1 rescues the phenotype of ITGA2 knockdown-induced cell cycle arrest. ACLY-encoded ATP citrate lyase is essential to maintain cellular acetyl-CoA levels. CCND1 knockdown further mimics ITGA2 knockdown in abolishing lung colonization of breast cancer cells. We identified that the low levels of miR-206 as well as high expression levels of ITGA2, ACLY and CCND1 are associated with an unfavorable relapse-free survival of the patients with estrogen receptor-negative or high grade breast cancer, especially basal-like or TNBC, possibly serving as potential biomarkers of cancer stemness and therapeutic targets of breast cancer metastasis.

Keywords: ACLY; Breast cancer; CCND1; CD49b; ITGA2; Integrins; Metastasis; Stemness.


Figures

Figure 1
Figure 1
ITGA2 knockdown inhibits lung colonization and metastasis. (A-C) Bioluminescence images (a), CD49b flow analyses (b), and normalized lung colonization signals (c, ratio of the total flux compared to D0) of NOD/Scid mice on day 0 (D0), 1 (D1), and 4 (D4) post tail vein infusion of L2T/L2G-labeled MDA-MB-231 cells, control and ITGA2-KD. n = 4, *P = 0.02 (D1) and **P = 0.004 (D4) for paired comparisons (t-test). Error bars represent S.D. values. (D) Bioluminescence images of tumor growth signals of mouse 4T1 cells, the control and Itga2 KD, on day 1 (D1), 3 (D3), 5 (D5), and 9 (D9) post orthotopic implantation into the 4th mammary fat pads of BALB/c mice. (E) Flow analyses of mouse Cd49b levels in 4T1 cells ± Itga2-KD prior to implantation. (F) 4T1 tumor growth analyses (tumor burden) (total flux p/s, n = 7, *t-test P< 0.01). Error bars represent S.D. values. (G) Bioluminescence images (top panels) and normalized lung metastasis by primary tumor burden (total flux/tumor weight) of the mouse lungs bearing 4T1 spontaneous metastases on D9, n = 7, t-test P = 0.05. Error bars represent S.D. values. (H) H & E staining images of 4T1 breast tumors and spontaneous lung metastases (present in the control group and absent in the Itga2 KD group) on day 9 post orthotopic implantations shown in d. Scale bars = 20 μm.
Figure 2
Figure 2
ITGA2 is a target of miR-206 and promotes mammosphere formation and stemness factor expression. (A–B) ITGA2 mRNA (top panel) and protein (bottom panel) levels are reduced by transfected miR-206 in MDA-MB-231 cells, measured by qRT-PCR and immunoblotting, respectively. ***t-test P < 0.001. Error bars represent S.D. values. (C) CD49b surface protein expression inhibited by miR-206 in MDA-MB-231 cells, evaluated by flow cytometry. (D) Predicted binding sites between the complementary sequences of ITGA2 3’UTR (WT) and miR-206. The bottom line shows the mutated C to T (U, in red) within the interaction site of 3’UTR. (E) 3’UTR luciferase assay shows direct regulation of ITGA2 by miR-206, n = 3, **t-test P = 0.005. (F-G) Images (F) and quantified counts (G) of breast cancer cell-derived mammospheres upon siITGA2 knockdown. **t-test P < 0.01. Error bars represent S.D. values. Scale bars = 25 μm (H-I) siITGA2 transfection depletes CD49b protein expression, measured by immunoblotting (H) and flow cytometry analyses (I). (J) Immunoblots to detect reduced expression of CD49b, phosphorylated FAK (pFAK), and OCT3/4 levels without affecting total FAK levels upon ITGA2 KD or miR-206 upregulation. (K) Left panel: Flow histogram of CD49b expression in control and siITGA2-transfected cells and gated sorting of CD49b++ and CD49blow/- populations, respectively. Right panel: Bioluminescent images of CD49b++ and CD49blow/- implants of 100–1000 cells from day 1–10 (D1-D10). (L) Left panel: Fold change of tumor burden (total photons) to Day 1 (D1) from D1-D20. ** t-test P = 0.007 on D20. Error bars represent S.D. values. Right panel: Weight of tumors derived from CD49b++ and CD49b−/low cells, orthotopically implanted at 100–1000 cells (t-test **P = 0.008).
Figure 3
Figure 3
ITGA2 knockdown inhibits cell cycle. (A-B) Images (A) and cell counts (B) of MDA-MB-231 cells 48 h after transfections with siITGA2 (ITGA2-KD) or miR-206 mimic. Cell number was measured via hemocytometer counting (B), n = 12, P = 0.002 (ITGA2-KD), and n = 3, P = 0.0012 (miR-206) (t-test). Error bars represent S.D. values. (C) Representative flow cytometry analyses of cell cycle with phases of subG1, G1, S, and G2M using propidium iodide upon ITGA2-KD and miR-206 overexpression in MDA-MB-231 cells. (D) Quantified percentage of MDA-MB-231 cells in each cell cycle phase as shown in (C) Top panel: siITGA2 mediated ITGA2-KD and control, n = 4 biological replicates; P = 0.03 (G1); P = 0.004 (G2M) (t-test). Bottom panel: miR-206 overexpression and control, n = 3 biological replicates; P = 0.01 (G1), 0.02 (S), 0.04 (G2M) (t-test). Error bars represent S.D. values. (E) Percentage of MDA-MB-231 cells in each cell cycle phase upon ITGA2 cDNA-mediated rescue of G1 arrest in miR-206 transfected cells (gated GFP+ cells with ITGA2 overexpression). P < 0.05 (t-test). NS = not significantly different. Error bars represent S.D. values. (F) Percentage of BT20 cells in each cell cycle phase upon ITGA2-KD. P < 0.01 (t-test). Error bars represent S.D. values.
Figure 4
Figure 4
ITGA2 knockdown reduces migration and invasion of TNBC cells in the presence of collagen. (A) Images of migratory MDA-MB-231 cells with human siITGA2 smart pool-mediated knockdown (ITGA2-KD) and siRNA controls (Con), at 0 and 24 h (h) following scratched wounding. Cells were plated on collagen I-coated plates. (B) Quantification of relative cell density filled by ITGA2-KD and control cells in wounded areas, n = 3; P = 0.0002 (12 h), 0.0001 (24 h) (t-test). Error bars represent S.D. values. (C) Normalized migration over confluence of MDA-MB-231 cells during wound healing. P < 0.01 (t-test). Error bars represent S.D. values. (D-E) Images (D) and relative cell density (E) of invasive MDA-MB-231 cells (A2-KD and control) covered by Matrigel, at 0 and 48 h after scratched wounding. n = 3, P = 0.02 (24 h), 0.007 (48 h) (t-test). Error bars represent S.D. values. (F) Flow cytometry plots of CD49b levels in MDA-MD-231 cells upon ITGA2 KD. (G-H) Images (G) and quantified wound density (H) of murine 4T1 mammary cancer cells upon Itga2 KD via siItga2, within 12, 22 (24), and 40 h following scratch wounding. *t-test P < 0.05 (n = 3). Error bars represent S.D. values. (I) Flow cytometry analyses of reduced murine Cd49b levels upon Itga2 KD in 4T1 cells.
Figure 5
Figure 5
ITGA2 downregulation-altered genes and clusters. (A) Heatmap of differentially expressed 195 genes >1.5 fold change upon ITGA2 KD via siITGA2 (see Table S1), with most being downregulated (top and middle rows of 169 genes) and a small portion of upregulated genes (bottom rows of 26 genes). (B) Top 20 gene clusters enriched by ITGA2 KD, colored by p-values. The Metascape gene list analyses were carried out with the ontology sources of KEGG Pathway, GO, Reactome, Canonical Pathways, and CORUM. (C-E) Heatmap of genes in representative pathways of cell cycle and regulation of protein kinase activity (C), lipid metabolism (D), and wound healing and cell migration (E), with representative genes CCND1 and ACLY shown in C and D, respectively.
Figure 6
Figure 6
ACLY and Cyclin D1 are CD49b targets enhancing self-renewal and cell cycle. (A) Immunoblot of downregulated ACLY proteins in MDA-MB-231 cells transfected with siACLY and siITGA2 in comparison to siRNA control and siOCT4. (B) Reduced cellular acetyl-coA levels in the ITGA2-knock down MDA-MB-231 cells, as measured by LC/MS (t-test P = 0.001, n = 3 biological replicates). Error bars represent S.D. values. (C) Compromised mammosphere formation in ACLY KD cells, shown representative images (right panels) and quantified histograms (left panel) (t-test P < 0.05, n = 3 biological replicates). Error bars represent S.D. values. Scale bars = 30 μm. (D) Immunoblot of downregulated cyclin D1 proteins in MDA-MB-231 cells transfected with siITGA2 compared to control. (E) siITGA2-induced G1 arrest and altered G2/M phase were rescued by CCND1 overexpression in MDA-MB-231 cells. *P < 0.05, **P < 0.01 (t-test), n = 3 biological replicates. Error bars represent S.D. values. (F) Representative images (top panels) and qualification (bottom panel) of mammosphere formation of MDA-MB-231 cancer cells upon siITGA2 mediated KD. ** t-test P < 0.01, n = 3 biological replicates. Error bars represent S.D. values. Scale bars = 50 μm. (G) Bioluminescence images of siControl, siACLY, siCCND1-transfected MDA-MB-231 tumor cells upon tail vein infusion (n = 4 mice each group). (H) Fold change of lung metastasis signals (total photons, p/s), normalized to day 0 (D0). t-test P = 0.003 (**), 2e-5 (****), and 7e-5 (****), for D1, D2, and D3 comparisons between the control and siCCND1 groups, respectively. Error bars represent S.D. values.
Figure 7
Figure 7
ITGA2 pathway is associated with outcomes of the patients with breast cancer. (A-C) Breast Cancer Kaplan–Meier Plotter analyses of RFS correlated with CCND1 expression (a, Log rank P = 0.043, n = 701), and ACLY expression (b, Log rank P = 0.001, n = 407), and OS associated with miR-206 expression (c, Log rank P = 0.002, n = 159) in ER-breast cancer with best cut off. (D-F) KM plots of RFS correlation with ITGA2 expression in ER- (Log rank p = 0.0406, n = 189) (D), grade 3 ER- (Log rank P = 0.048, n = 347) (E), and all grade 3 (Log rank P = 0.037, n = 444) (F) breast cancer, with best cut off selected in Breast Cancer Kaplan–Meier Plotter analyses. (G) Breast cancer miner plot of any-event (AE) free survival association with ITGA2 expression in TNBC. Log rank P = 0.02, n = 1258, median cut off. (H) Box plot for differential ACLY and CCND1 expression levels between clustered and single CTCs of breast cancer patients and PDXs (GSE109761 and GSE111065)., Wilcox t test P = 0.004 and 0.024 for ACLY and CCND1 comparisons, respectively. (I) Schematic CD49b signaling pathway induced by extracellular matrix factors such as collagen I fibers that result in the phosphorylation of FAK and upregulation of CCND1 and ACLY levels to promote proliferation, stemness, and metastasis of TNBC.

References

    1. Cancer IAfRo . The Glocal Cancer Observatory; 2018. All cancers. [online]
    1. Howlader N.N.A., Noone A.M., Krapcho M. National Cancer Institute; 2016. SEER Cancer Statistics Review.
    1. Siegel R.L., Miller K.D., Jemal A. Cancer statistics, 2018. CA A Cancer J Clin. 2018;68(1):7–30. - PubMed
    1. Anders C.K., Carey L.A. Biology, metastatic patterns, and treatment of patients with triple-negative breast cancer. Clin Breast Canc. 2009;9(Suppl 2):S73–S81. - PMC - PubMed
    1. Lapidot T., Sirard C., Vormoor J. A cell initiating human acute myeloid leukaemia after transplantation into SCID mice. Nature. 1994;367(6464):645–648. - PubMed