Review
. 2020 Nov 13;8(4):531-544.
doi: 10.1016/j.gendis.2020.11.004. eCollection 2021 Jul.

Bone morphogenetic protein 4 (BMP4) promotes hepatic glycogen accumulation and reduces glucose level in hepatocytes through mTORC2 signaling pathway

Affiliations
Review

Bone morphogenetic protein 4 (BMP4) promotes hepatic glycogen accumulation and reduces glucose level in hepatocytes through mTORC2 signaling pathway

Liqin An et al. Genes Dis. .

Abstract

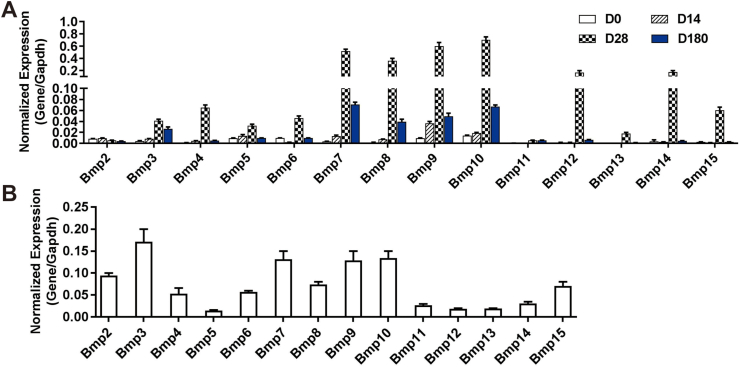
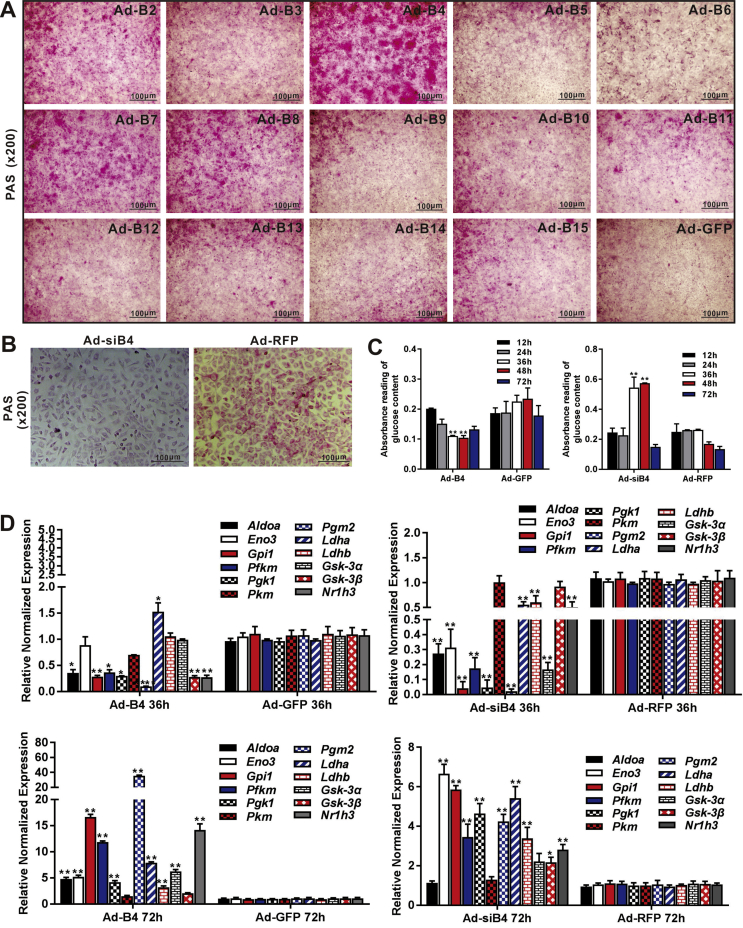
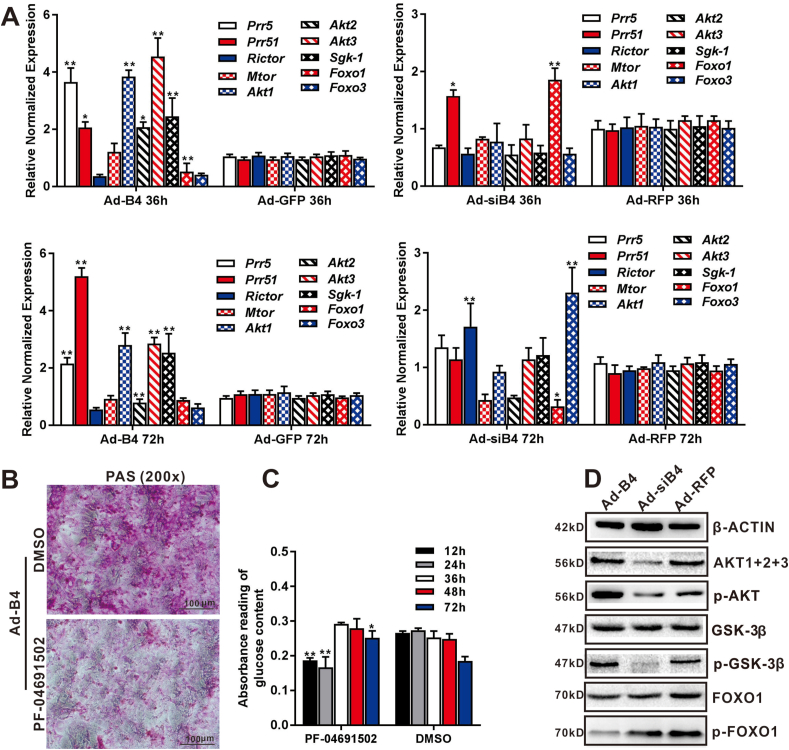
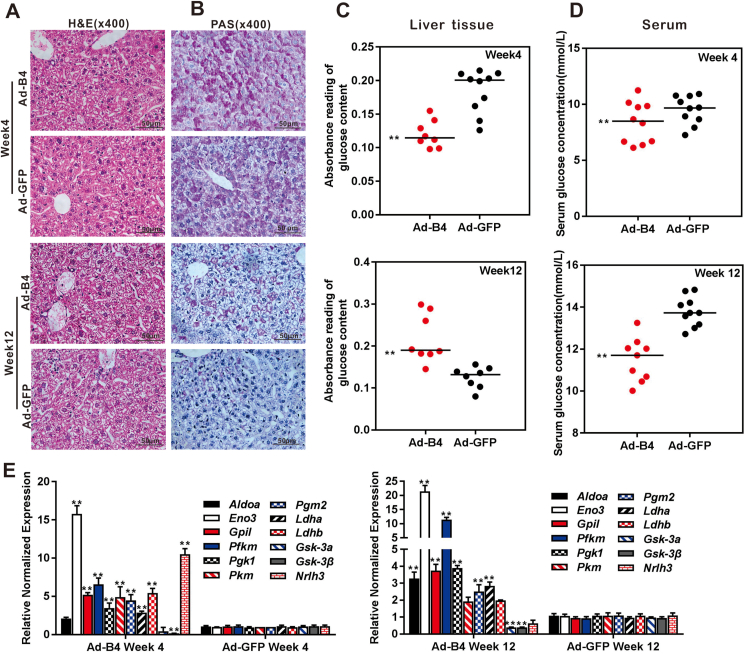
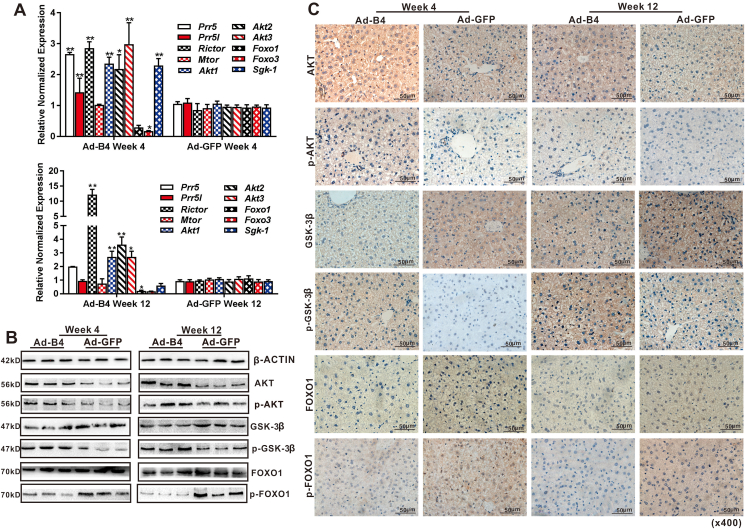
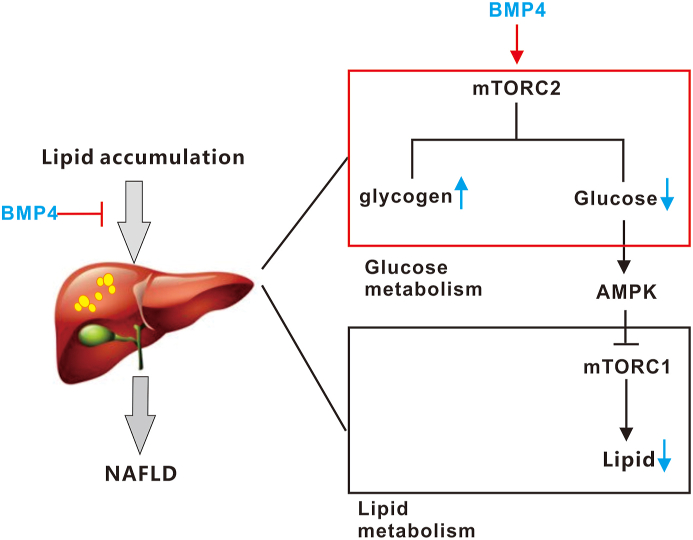
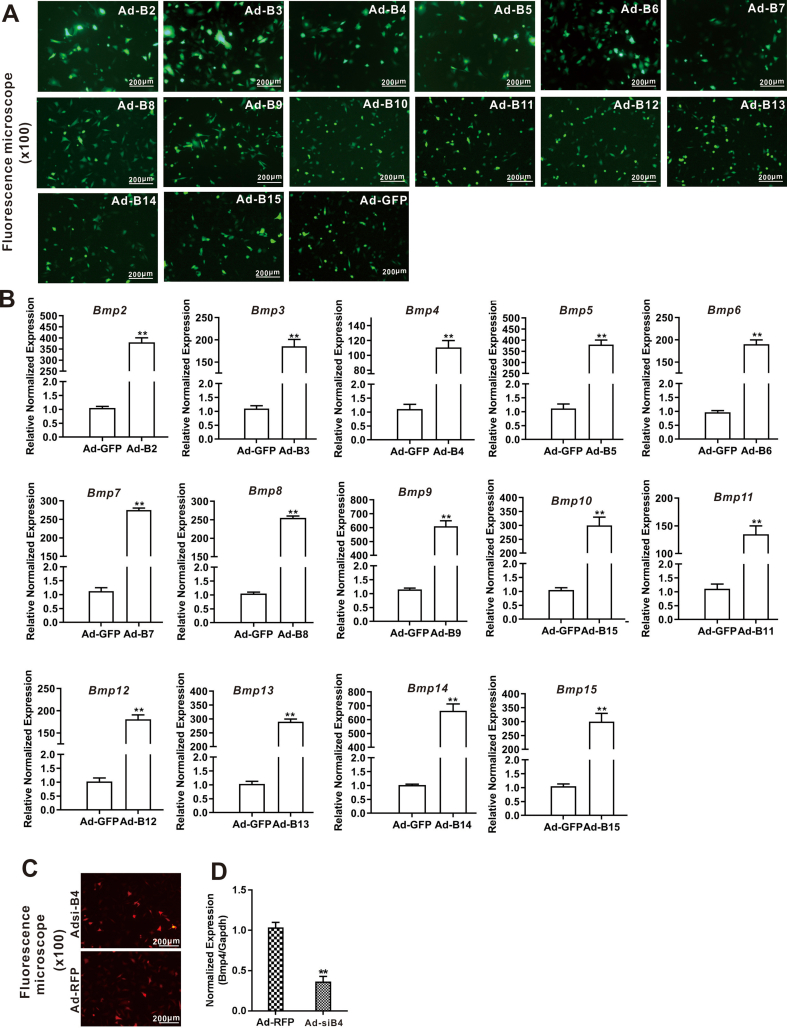
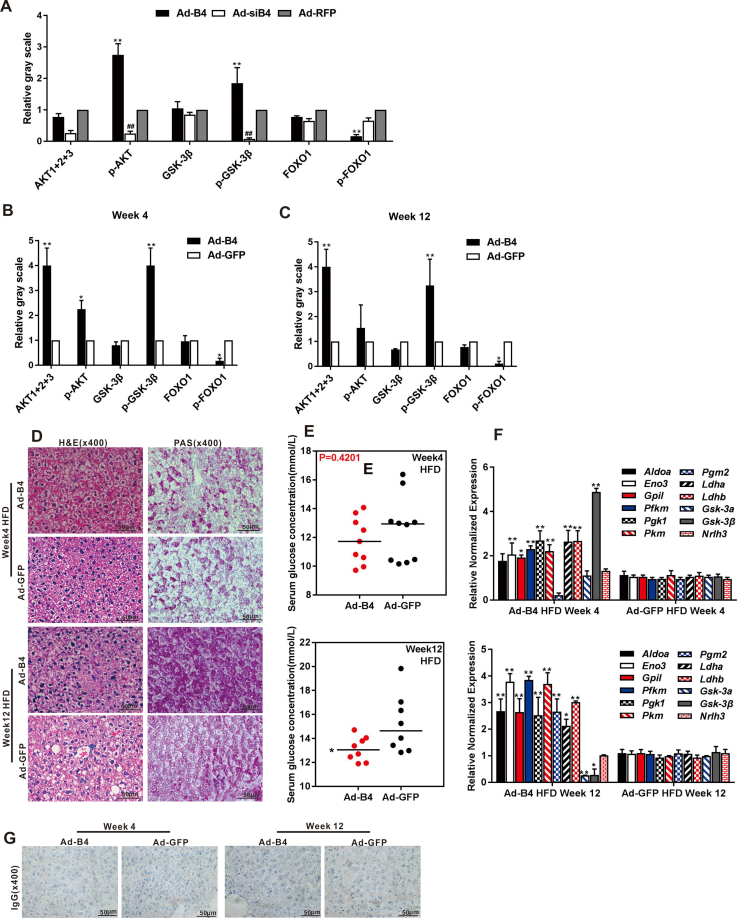
Liver is an important organ for regulating glucose and lipid metabolism. Recent studies have shown that bone morphogenetic proteins (BMPs) may play important roles in regulating glucose and lipid metabolism. In our previous studies, we demonstrated that BMP4 significantly inhibits hepatic steatosis and lowers serum triglycerides, playing a protective role against the progression of non-alcoholic fatty liver disease (NAFLD). However, the direct impact of BMP4 on hepatic glucose metabolism is poorly understood. Here, we investigated the regulatory roles of BMP4 in hepatic glucose metabolism. Through a comprehensive analysis of the 14 types of BMPs, we found that BMP4 was one of the most potent BMPs in promoting hepatic glycogen accumulation, reducing the level of glucose in hepatocytes and effecting the expression of genes related to glucose metabolism. Mechanistically, we demonstrated that BMP4 reduced the hepatic glucose levels through the activation of mTORC2 signaling pathway in vitro and in vivo. Collectively, our findings strongly suggest that BMP4 may play an essential role in regulating hepatic glucose metabolism. This knowledge should aid us to understand the molecular pathogenesis of NAFLD, and may lead to the development of novel therapeutics by exploiting the inhibitory effects of BMPs on hepatic glucose and lipid metabolism.

Keywords: BMP4; Glucose metabolism; Glycogen accumulation; Non-alcoholic fatty liver disease (NAFLD); mTORC2 signaling.


Conflict of interest statement

The authors declare they have no competing interesting.

Figures

Figure 1
Figure 1
The expression profile of the 14 types of BMPs in mouse liver tissue and hepatocytes. Total RNA was isolated from C57BL/6 male mouse liver tissue at day 0 (D0), day 14 (D14), day 28 (D28) and day 180 (D180) after birth. TqPCR analysis was carried out to assess the expression of the 14 types of Bmps. All samples were normalized with Gapdh(A). Total RNA was isolated from the MPH cells, and TqPCR analysis was carried out to detect the expression of 14 Bmps (B). All samples were normalized with Gapdh. Each assay condition was done in triplicate.
Figure 2
Figure 2
Comprehensive analysis of the 14 types of BMPs in regulating glucose metabolism in hepatocytes. The MPH cells were infected with 14 Ad-Bs and Ad-GFP respectively for 3 days. PAS staining was used to assess hepatic glycogen accumulation (magnification, x200) (A) Ad-siB4 and Ad-RFP infected the MPH cells for 3 days, PAS staining was used to assess the hepatic glycogen accumulation (magnification, x200) (B) Ad-B4, Ad-GFP, Ad-siB4 and Ad-RFP infected the MPH cells for 12h, 24h, 36h, 48h and 72h, total glucose content in hepatocytes were measured by absorbance reading at 5 time points. “∗∗” P < 0.01 Ad-B4 group vs. Ad-GFP group, Ad-siB4 group vs. Ad-RFP group (C) Ad-B4, Ad-GFP, Ad-siB4 and Ad-RFP infected the MPH cells for 36h and 72h, respectively, total RNA was isolated and TqPCR analysis was carried out to detect the expression of the genes that govern glycogen synthesis, glucose metabolism, glycolysis and gluconeogenesis respectively. Relative expression was calculated by dividing the relative expression values (i.e., gene/Gapdh) in “∗∗” P < 0.01, “∗” P < 0.05, Ad-B4 group vs. Ad-GFP group, Ad-siB4 group vs. Ad-RFP group (D). Each assay condition was done in triplicate. Representative images are shown.
Figure 3
Figure 3
BMP4 regulates hepatic glucose metabolism through mTORC2 signaling. Subconfluent MPH cells were infected with Ad-B4, Ad-GFP, Ad-siB4 and Ad-RFP for 36h and 72h. Total RNA was isolated and TqPCR analysis was carried out to detect the expression of essential members and downstream glucose metabolism related genes of mTORC2 signaling pathway at 36h and 72h, respectively. Relative expression was calculated by dividing the relative expression values (i.e., gene/Gapdh) in “∗∗” P < 0.01, “∗” P < 0.05, Ad-B4 group vs. Ad-GFP group, Ad-siB4 group vs. Ad-RFP group (A) Subconfluent MPH cells were infected with Ad-B4, treated with the 0.1 mM PI3K(α/β/δ/γ)/mTOR inhibitor PF-04691502 or DMSO vehicle control for 3 days, then subjected to PAS staining (magnification, x200) (B) Ad-B4 infected the MPH cells, and treated with PF-04691502 or DMSO for 12h, 24h, 36h, 48h and 72h. Total glucose levels in cells was assessed by absorbance reading at different time points. “∗∗” P < 0.01 PF-04691502 group vs. DMSO group (C) Subconfluent MPH cells were infected with Ad-B4, Ad-siB4 or Ad-RFP. Total cellular proteins were prepared and subjected to Western blotting to detect the expression or phosphorylation levels of genes related to glucose metabolism regulated by mTORC2 signaling pathway, including AKT1+2+3, p-AKT, GSK-3β, p-GSK-3β, FOXO1, p-FOXO1, while β-ACTIN was used as a loading control (D) Each assay condition was done in triplicate. Representative images are shown.
Figure 4
Figure 4
The effect of BMP4 on hepatic glucose concentrations in vivo. Recombinant adenovirus Ad-B4 or Ad-GFP was injected intra hepatically into 4-week old C57BL/6 mice (male, n = 10/time point/group). The mice were sacrificed after 4 weeks and 12 weeks, respectively. The liver sections were subjected to H & E staining (A) and PAS staining (B), both were recorded by light microscopic examination (x400). The liver tissue glucose content (C) and serum glucose levels (D) were tested with a glucose assay kit, and total RNA was isolated from the liver samples of Ad-B4 group and Ad-GFP group, and TqPCR analysis was carried out to detect the expression of the genes that govern glycogen synthesis, glucose metabolism, glycolysis and gluconeogenesis. Relative expression was calculated by dividing the relative expression values (i.e., gene/Gapdh) in “∗∗” P < 0.01, Ad-B4 group vs. Ad-GFP group (E). Each assay condition was done in triplicate. Representative images are shown.
Figure 5
Figure 5
The signaling mechanism of BMP4-regulated glucose metabolism in hepatocytes in vivo. Recombinant adenovirus Ad-B4 or Ad-GFP was injected intrahepatically into 4-week old C57BL/6 mice (male, n = 10/time point/group). The mice were sacrificed after 4 weeks and 12 weeks, respectively. Total RNA was isolated from the liver of Ad-B4 group and Ad-GFP group. TqPCR analysis was carried out to detect the expression of the members of mTORC2 signaling pathway. Relative expression was calculated by dividing the relative expression values (i.e., gene/Gapdh) in “∗∗” P < 0.01, “∗” P < 0.05, Ad-B4 group vs. Ad-GFP group (A) Total tissue proteins were isolated from the liver samples of Ad-B4 group and Ad-GFP group after 4 weeks and 12 weeks, and Western blotting was carried out to detect the expression or phosphorylation level of proteins related to glucose levels regulated by mTORC2 signaling pathway, including AKT1+2+3, p-AKT, GSK-3β, p-GSK-3β, FOXO1, p-FOXO1, and β-ACTIN was used as a loading control (B) The liver sections were subjected to IHC staining to detect the expression or phosphorylation level of genes related to glucose metabolism regulated by mTORC2 signaling pathway, including AKT1+2+3, p-AKT, GSK-3β, p-GSK-3β, FOXO1, and p-FOXO1. Staining results were recorded by light microscopic examination (x400) (C) Each assay condition was done in triplicate. Representative images are shown.
Figure 6
Figure 6
A working model of action for BMP4 in regulating hepatic glucose metabolism.
Figs1
Figs1
Supplementary Figure 1. Verification of the efficiency of 14 Ad-Bs in the MPH cells. The MPH cells were infected with Ad-B2, Ad-B3, Ad-B4, Ad-B5, Ad-B6, Ad-B7, Ad-B8, Ad-B9, Ad-B10, Ad-B11, Ad-B12, Ad-B13, Ad-B14, Ad-B15 and Ad-GFP. The green fluorescence (GFP) were observed by fluorescence microscope(x100) at 48h (A). At 48h post infection, total RNA was isolated and subjected to TqPCR analysis of expression of 14 BMPs (coding region only). Relative expression was calculated by dividing the relative expression values (i.e., gene/Gapdh) in “∗∗” p < 0.01, Ad-Bs group vs. Ad-GFP group (B). Verification of the efficiency of Ad-siB4 in the MPH cells. Ad-siB4 or Ad-RFP infected the MPH cells for 36h and observed by a fluorescence microscope(x100) (C). The total RNA was isolated and TqPCR analysis was carried out to detect the expression of Bmp4. Relative expression was calculated by dividing the relative expression values (i.e., Bmp4/Gapdh) in “∗∗” p < 0.01, Ad-siB4 vs. Ad-RFP (D). Each assay condition was done in triplicate. Representative images are shown.
Figs2
Figs2
Supplementary Figure 2. The densitometry analysis of Western blots. Image Lab was used to analysis the densitometry of Western blotting bands of AKT1+2 + 3, p-AKT, GSK-3β, p-GSK-3β, FOXO1 and p-FOXO1 in MPH cells (A). Relative gray scale was calculated by dividing the relative gray values (i.e., AKT1+2 + 3/β-ACTIN) in “∗∗” p < 0.01, Ad-B4 vs. Ad-RFP, “##” p < 0.01, Ad-siB4 vs. Ad-RFP. Image Lab was used to analysis the densitometry of Western blotting bands of AKT1+2 + 3, p-AKT, GSK-3β, p-GSK-3β, FOXO1 and p-FOXO1 in 4 week liver tissue (B) and 12 week liver tissue (C). Relative gray scale was calculated by dividing the relative gray values (i.e., AKT1+2 + 3/β-ACTIN) in “∗∗” p < 0.01, “∗” p < 0.05, Ad-B4 vs. Ad-GFP. The effect of BMP4 on hepatic glucose concentrations of HFD mice in vivo. Recombinant adenovirus Ad-B4 or Ad-GFP were injected in liver area of 4-week old C57BL/6 mice (male, n = 10 /time point/group), which were fed up with 45% high fat diet (HFD). The mice were sacrificed after 4 weeks and 12 weeks, respectively. The liver sections were subjected to H & E staining and PAS staining (D), which observed by light microscopic examination (x400) and the serum glucose levels were also measured (E), and total RNA was isolated from the liver of Ad-B4 HFD group and Ad-GFP HFD group mice, and TqPCR analysis was carried out to detect the expression of the genes that govern glycogen synthesis, gluconeogenesis and glucose metabolism. Relative expression was calculated by dividing the relative expression values (i.e., gene/Gapdh) in “∗∗” p < 0.01, Ad-B4 HFD group vs. Ad-GFP HFD group (F). Each assay condition was done in triplicate. Representative images are shown. Paraffin sections of liver samples were subjected to IHC staining, stains without primary antibody were used as negative controls. The liver samples prepared in Fig. 5 were observed by light microscopic examination (x400) G). Each assay condition was done in triplicate. Representative images are shown.

Similar articles

Cited by

References

    1. Younossi Z.M., Koenig A.B., Abdelatif D., Fazel Y., Henry L., Wymer M. Global epidemiology of nonalcoholic fatty liver disease-Meta-analytic assessment of prevalence, incidence, and outcomes. Hepatology. 2016;64(1):73–84. - PubMed
    1. Whalley S., Puvanachandra P., Desai A., Kennedy H. Hepatology outpatient service provision in secondary care: a study of liver disease incidence and resource costs. Clin Med (Lond) 2007;7(2):119–124. - PMC - PubMed
    1. Mittendorfer B., Magkos F., Fabbrini E., Mohammed B.S., Klein S. Relationship between body fat mass and free fatty acid kinetics in men and women. Obesity (Silver Spring) 2009;17(10):1872–1877. - PMC - PubMed
    1. Younossi Z.M., Marchesini G., Pinto-Cortez H., Petta S. Epidemiology of nonalcoholic fatty liver disease and nonalcoholic steatohepatitis: implications for liver transplantation. Transplantation. 2019;103(1):22–27. - PubMed
    1. Byrne C.D., Targher G. NAFLD: a multisystem disease. J Hepatol. 2015;62(1 Suppl):S47–S64. - PubMed

LinkOut - more resources