. 2021 Jul 23;24(7):102752.
doi: 10.1016/j.isci.2021.102752. Epub 2021 Jun 19.

Multi-dimensional and longitudinal systems profiling reveals predictive pattern of severe COVID-19

Affiliations

Multi-dimensional and longitudinal systems profiling reveals predictive pattern of severe COVID-19

Marcel S Woo et al. iScience. .

Abstract

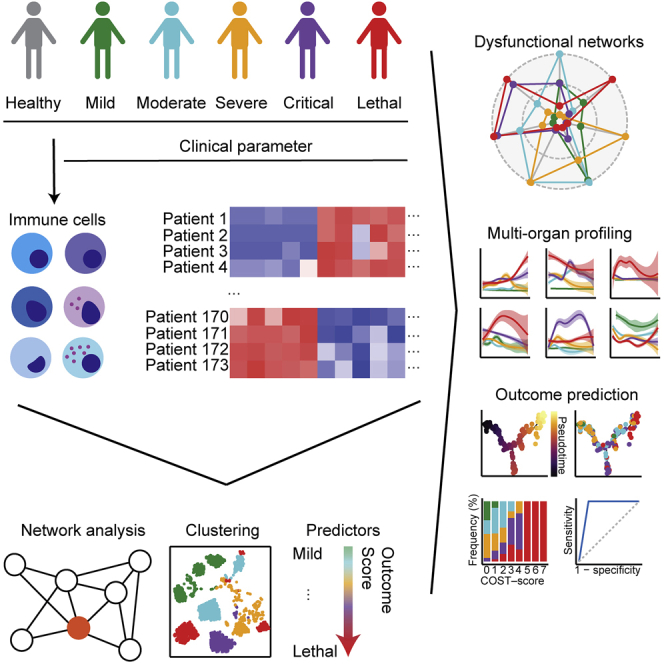
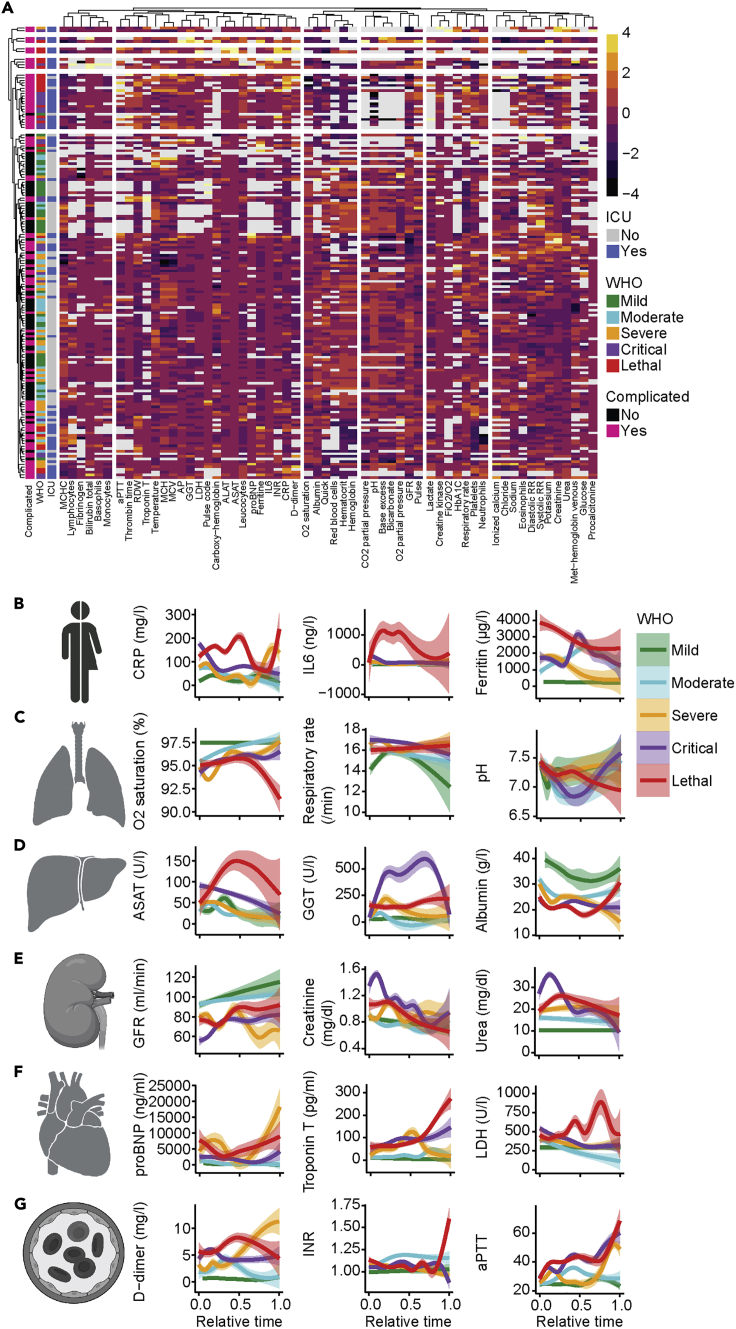
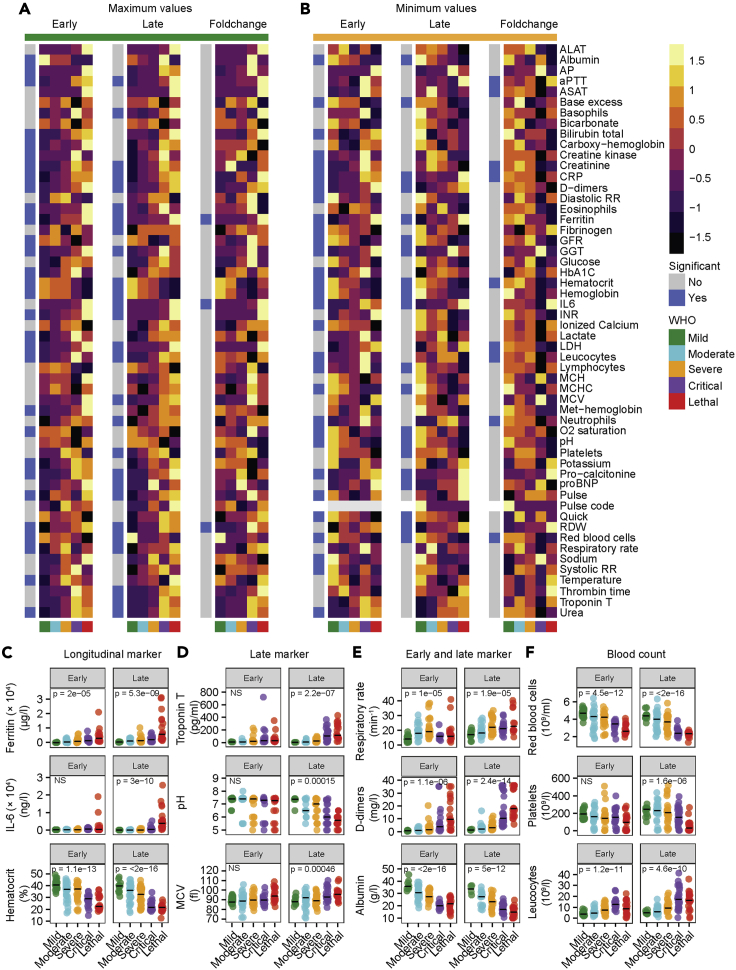
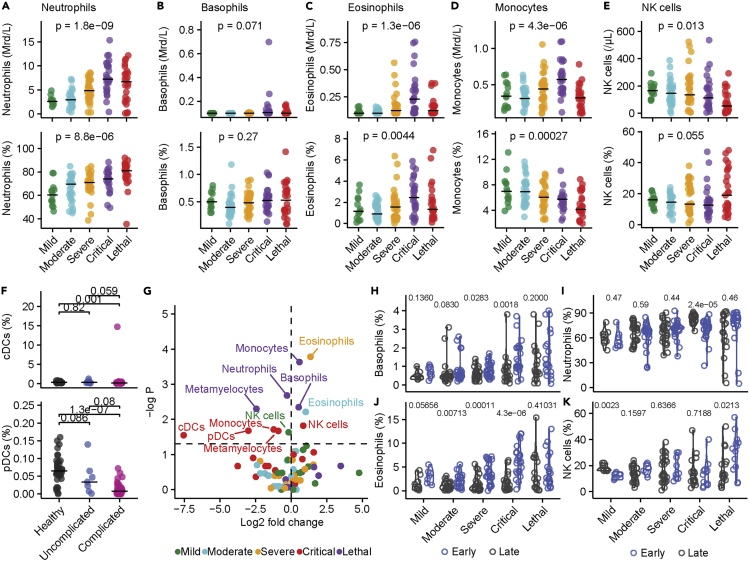
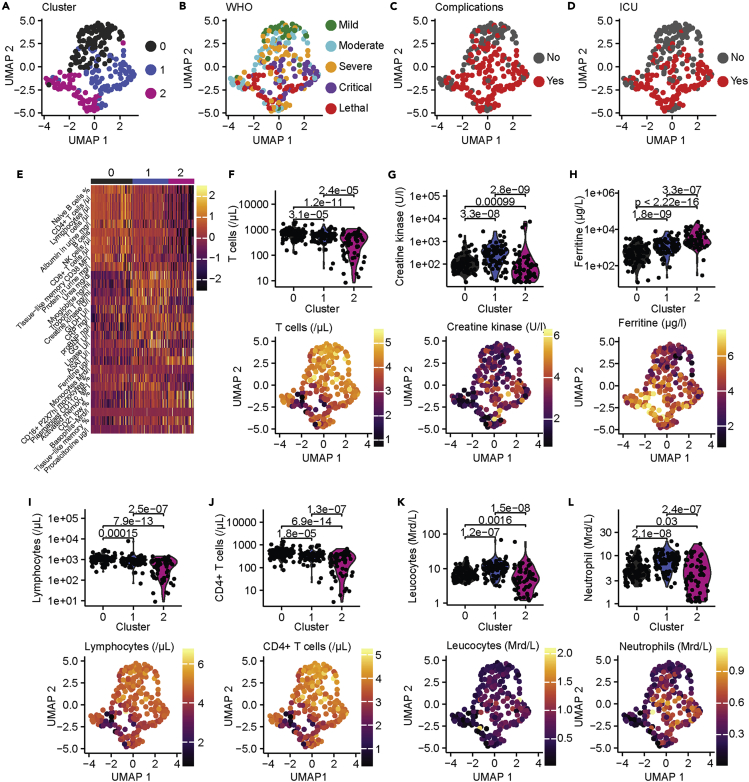
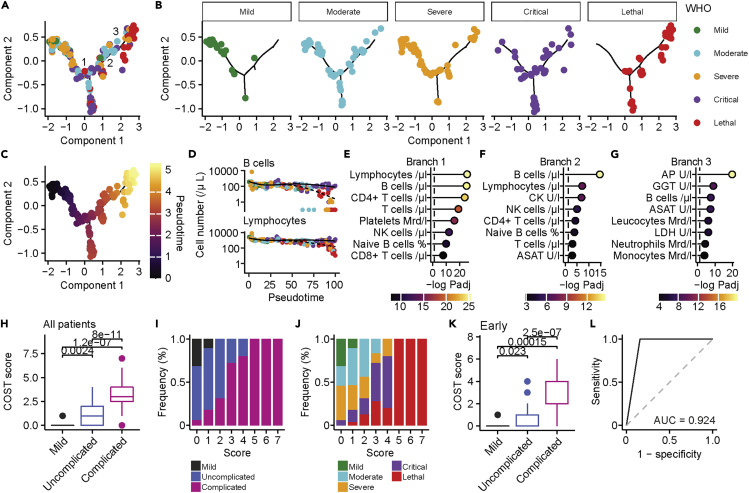
COVID-19 is a respiratory tract infection that can affect multiple organ systems. Predicting the severity and clinical outcome of individual patients is a major unmet clinical need that remains challenging due to intra- and inter-patient variability. Here, we longitudinally profiled and integrated more than 150 clinical, laboratory, and immunological parameters of 173 patients with mild to fatal COVID-19. Using systems biology, we detected progressive dysregulation of multiple parameters indicative of organ damage that correlated with disease severity, particularly affecting kidneys, hepatobiliary system, and immune landscape. By performing unsupervised clustering and trajectory analysis, we identified T and B cell depletion as early indicators of a complicated disease course. In addition, markers of hepatobiliary damage emerged as robust predictor of lethal outcome in critically ill patients. This allowed us to propose a novel clinical COVID-19 SeveriTy (COST) score that distinguishes complicated disease trajectories and predicts lethal outcome in critically ill patients.

Keywords: Immunology; Virology; systems biology.


Conflict of interest statement

The authors declare no competing interests.

Figures

None
Graphical abstract
Figure 1
Figure 1
Systemic differences between early and late COVID-19 (A) Overview of our cohort, including healthy donors and patients with mild, moderate, severe, critical, and lethal COVID-19 according to WHO criteria for classification. Patient cohort is detailed in Table S1. (B and C) Overrepresentation analysis of clinical themes that drive diseases severity in early (B) and late (C) COVID-19. Color scale represents negative log10 false discovery rate (FDR)-adjusted p value, and size shows the number of parameters in the respective clinical theme. Definitions of clinical themes are provided in Table S2. (D) Overrepresentation analysis of clinical themes that are enriched in clinical, laboratory, and immunological parameters that define respective COVID-19 severity. Detailed analysis is specified in the STAR Methods section. Color shows negative log10 FDR-adjusted p values. Dashed line represents significance level of negative log10 P = 0.05. (E) Target plots of clinical themes that define respective early, late, or total COVID-19 severity. Negative adjusted log10 p values are scaled for respective clinical theme between one (outer dashed line) and zero (inner dashed line).
Figure 2
Figure 2
COVID-19 is a multi-organ disease (A) Unsupervised clustering of 60 clinical parameters that were available for more than 50 patients. The average value of the respective parameter was used. Rows and columns are arranged by k-means-clustering. WHO severity, ICU admission, and complicated disease course are annotated. (B–G) Analysis of systemic inflammatory (B; max. CRP, IL-6, ferritin), respiratory (C; min. O2-saturation, max. respiratory rate, min. pH), hepatobiliary (C; max. ASAT, max. GGT, min. albumin), nephrological (D; min. GFR, max. Creatinine, max. Urea), cardiological (E; max. pro-BNP, troponin T, LDH), and coagulation (G; max. D-dimers, INR, aPTT) parameters. The average value of each individual was used. Relative time was adjusted to time of admission (t = 0) and time of discharge (t = 1). The mean and standard error are shown.
Figure 3
Figure 3
Early, late, and longitudinal laboratory patterns of patients with COVID-19 (A and B) Maximal (A) and minimal (B) values of depicted 56 laboratory parameters from early (left) and late (middle) and fold change from early to late (right) COVID-19. The average of all individuals from each disease severity is displayed. Coloring shows Z score. WHO disease severity and significance are annotated. Significance was calculated using one-way ANOVA. (C–E) Longitudinal marker with significant differences between early and late COVID-19 (C), late marker that reached significance in late but not early COVID-19 (D), and early and late marker (E) for disease severity in COVID-19. (F) Blood count dysregulation (red blood cells, platelets, leukocytes) in early and late COVID-19. If not stated otherwise, exact p values are provided in the figure and one-way ANOVA was used to test statistical significance. Exact n is provided in Table S4. Individual data points and median are shown.
Figure 4
Figure 4
Longitudinal profiling of lymphocyte populations in COVID-19 (A–E) Absolute numbers (top row), frequency (middle row), and time course of absolute number (third row) of lymphocytes (A, minimum), T cells (B, mean), CD4+ T cells (C, mean), CD8+ T cells (D, mean), and naive T cells (E, mean) of patients with COVID-19. Relative time was adjusted to time of admission (t = 0) and time of discharge (t = 1). Exact n is provided in Table S4. (F–J) Absolute number of B cells (F), frequency of naive B cells (G), resting memory B cells (H), tissue-like memory B cells (I), and activated memory B cells (J) of patients with COVID-19. Exact n is provided in Table S4. (K and L) Heatmap of shown parameters during early (K) and late (L) COVID-19. Color represents Z score. (M) Heatmap of differences between early and late COVID-19 of shown parameters. Non-significant parameters are colored in gray. Color scale represents signed negative log10 FDR-adjusted p value. If not stated otherwise exact p values are provided in the figure and exact n is provided in Table S4. Individual data points are shown with median.
Figure 5
Figure 5
Innate immune dysfunction in COVID-19 (A–E) Absolute count (top row) and frequency (bottom row) of neutrophils (A), basophils (B), eosinophils (C), monocytes (D), and NK cells (E) in patients with COVID-19. Significance was calculated using one-way ANOVA. (F) Frequency of conventional (cDCs; top) and plasmacytoid dendritic cells (pDCs; bottom) of healthy donors and patients with uncomplicated (mild, moderate) and complicated (severe, critical, lethal) COVID-19. Significance was calculated using one-way ANOVA. (G) Volcano plot of subset frequencies. The dashed horizonal line represents significance level of negative log10 P = 0.05. Significant populations are labeled in the figure. Significance and fold change were calculated by comparing frequency of the respective populations from each disease severity against each other by Wilcoxon test. (H–K) Frequency of basophils (H), neutrophils (I), eosinophils (J), and NK cells (K) from early and late time points of patients with mild, moderate, severe, critical, and lethal COVID-19. Significance was calculated by FDR-adjusted Wilcoxon test. If not stated otherwise, exact p values are provided in the figure and exact n is provided in Table S4. Individual data points are shown with median.
Figure 6
Figure 6
Unsupervised clustering of laboratory, clinical, and immunological data (A) Unsupervised clustering of early and late time points from our patient cohort. Three clusters were identified. (B–D) Depiction of WHO disease severity (B), complicative disease courses (C), and patients with ICU admission (D). (E) Heatmap of top 10 defining parameters for each cluster. Color shows Z score. (F–L) Cluster defining laboratory parameters. T cells (F), creatine kinase (G), ferritin (H), lymphocytes (I), CD4+ T cells (J), leukocytes (K), and neutrophils (L) are shown as violin plots with individuals data points (top row) or mapped onto UMAP plots (bottom row). Statistical significance was calculated using FDR-adjusted Wilcoxon test.
Figure 7
Figure 7
A combined clinical and immunological score robustly classifies complicated COVID-19 (A) Pseudo-time-trajectory analysis of patients with COVID-19. Three branches were identified and are labeled in the figure. (B) Distribution of patients with mild, moderate, severe, critical, and lethal COVID-19 on the pseudo-time-trajectory. (C) Pseudo-time is colored on the calculated trajectory. (D) Changes in cell numbers (cells/μl) of B cells (top) and lymphocytes (bottom) in pseudo-time. Two kinetics from the first branch are shown. Color represents WHO severity. (E–G) Top eight parameters, ranked by negative log10 FDR-adjusted p values that define the first (E), second (F), and third (G) branch defined by branch expression analysis modeling. Dashed line shows the significance level of negative log10 P = 0.05. Color shows significance level. (H) Comparison of mild (n = 14), uncomplicated (n = 61; pooled moderate and severe), and complicated (n = 47; pooled critical and lethal) COVID-19. Boxplot with median, interquartile range (IQR), and outliers are displayed. (I and J) Frequency distribution of mild, uncomplicated, and complicated (I) and WHO severity classified (J) patients with COVID-19 according to our COST score. (K) Comparison of mild (n = 14), uncomplicated (n = 61; pooled moderate and severe), and complicated (n = 47; pooled critical and lethal) early COVID-19. Boxplot with median, IQR, and outliers are displayed. (L) ROC analysis of COST score (n = 122). If not stated otherwise, FDR-adjusted Wilcoxon-test was used and exact p values are displayed in the figure.

Similar articles

Cited by

References

    1. Alballa N., Al-Turaiki I. Machine learning approaches in COVID-19 diagnosis, mortality, and severity risk prediction: a review. Inform. Med. Unlocked. 2021;24:100564. - PMC - PubMed
    1. Becht E., McInnes L., Healy J., Dutertre C.-A., Kwok I.W.H., Ng L.G., Ginhoux F., Newell E.W. Dimensionality reduction for visualizing single-cell data using UMAP. Nat. Biotechnol. 2019;37:38–44. - PubMed
    1. Bhatraju P.K., Ghassemieh B.J., Nichols M., Kim R., Jerome K.R., Nalla A.K., Greninger A.L., Pipavath S., Wurfel M.M., Evans L. COVID-19 in critically ill patients in the Seattle region — case series. N. Engl. J. Med. 2020;382:2012–2022. - PMC - PubMed
    1. Braun F., Lütgehetmann M., Pfefferle S., Wong M.N., Carsten A., Lindenmeyer M.T., Nörz D., Heinrich F., Meißner K., Wichmann D. SARS-CoV-2 renal tropism associates with acute kidney injury. Lancet. 2020;396:597–598. - PMC - PubMed
    1. Chen N., Zhou M., Dong X., Qu J., Gong F., Han Y., Qiu Y., Wang J., Liu Y., Wei Y. Epidemiological and clinical characteristics of 99 cases of 2019 novel coronavirus pneumonia in Wuhan, China: a descriptive study. Lancet. 2020;395:507–513. - PMC - PubMed

LinkOut - more resources