. 2021 Jun 23;3(3):lqab058.
doi: 10.1093/nargab/lqab058. eCollection 2021 Sep.

Kmerator Suite: design of specific k-mer signatures and automatic metadata discovery in large RNA-seq datasets

Affiliations

Kmerator Suite: design of specific k-mer signatures and automatic metadata discovery in large RNA-seq datasets

Sébastien Riquier et al. NAR Genom Bioinform. .

Abstract

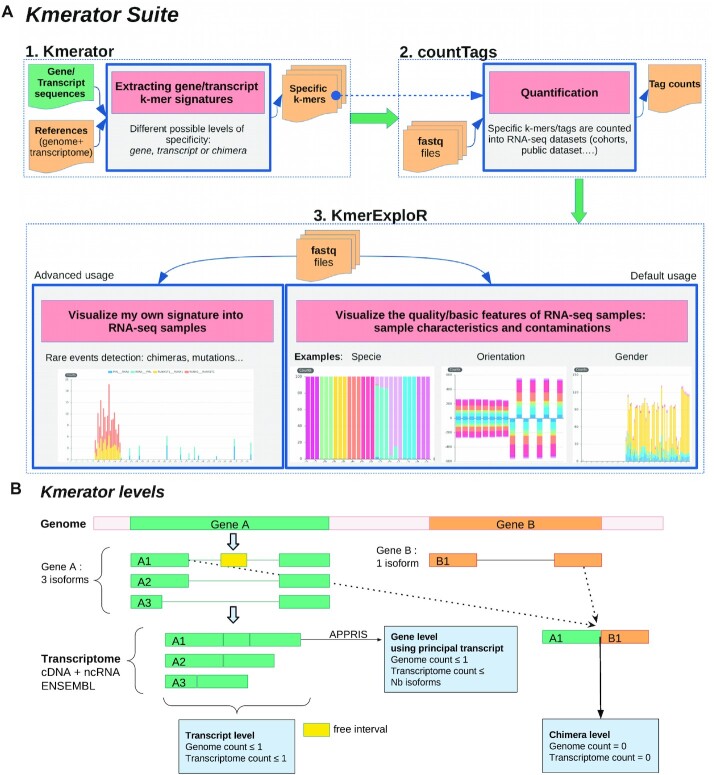
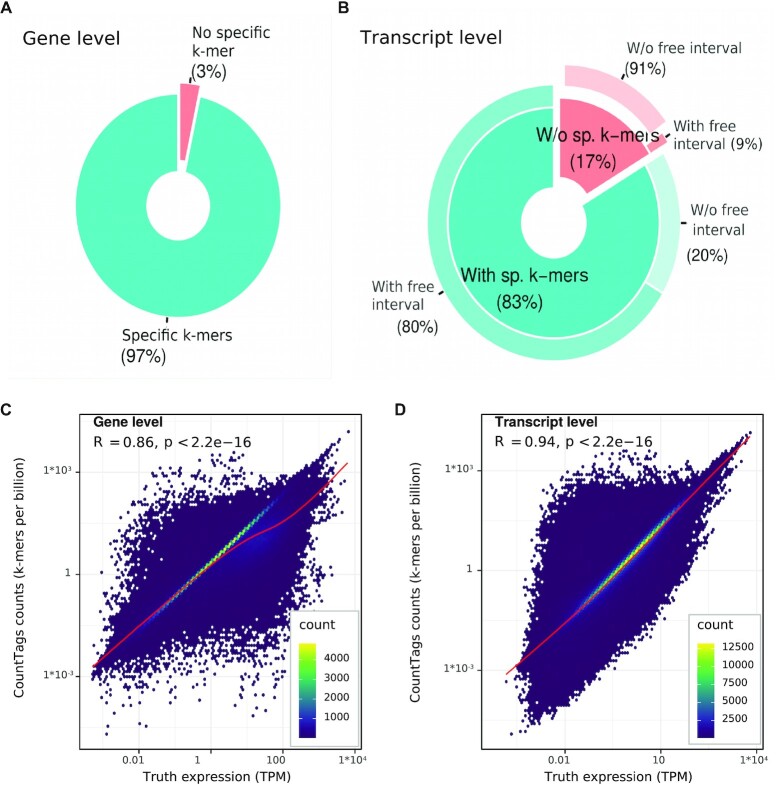
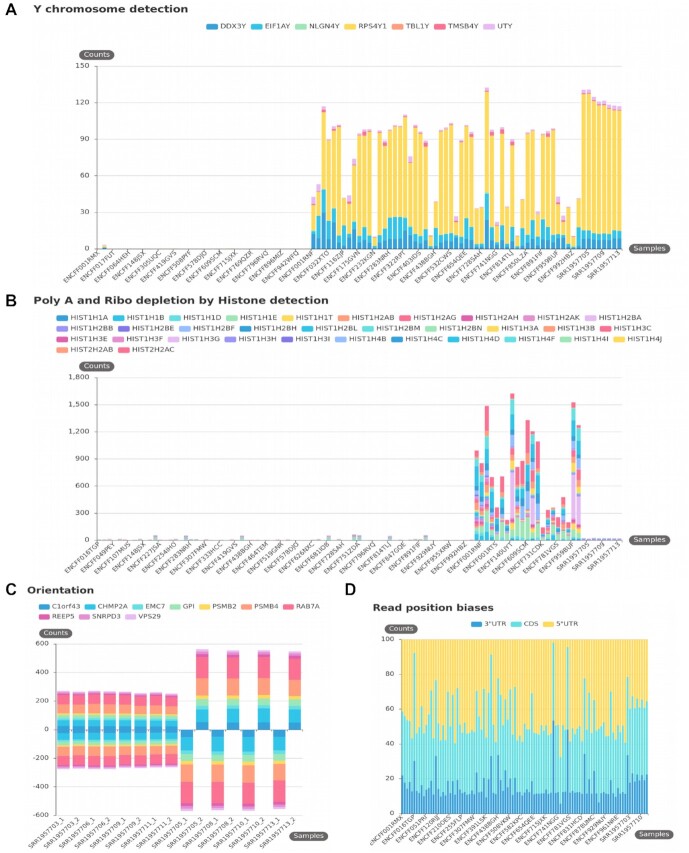
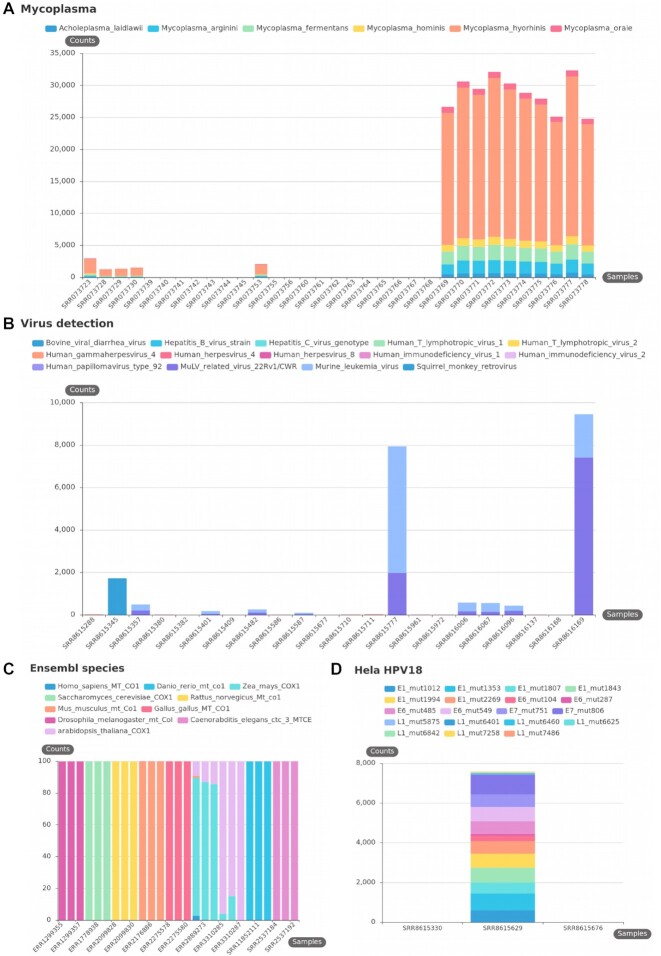
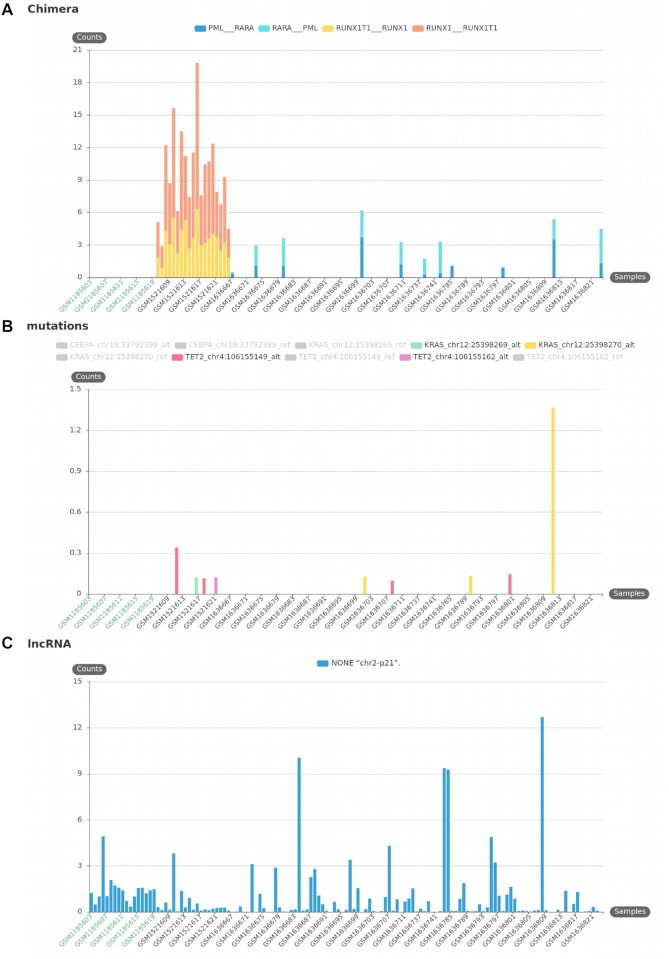
The huge body of publicly available RNA-sequencing (RNA-seq) libraries is a treasure of functional information allowing to quantify the expression of known or novel transcripts in tissues. However, transcript quantification commonly relies on alignment methods requiring a lot of computational resources and processing time, which does not scale easily to large datasets. K-mer decomposition constitutes a new way to process RNA-seq data for the identification of transcriptional signatures, as k-mers can be used to quantify accurately gene expression in a less resource-consuming way. We present the Kmerator Suite, a set of three tools designed to extract specific k-mer signatures, quantify these k-mers into RNA-seq datasets and quickly visualize large dataset characteristics. The core tool, Kmerator, produces specific k-mers for 97% of human genes, enabling the measure of gene expression with high accuracy in simulated datasets. KmerExploR, a direct application of Kmerator, uses a set of predictor gene-specific k-mers to infer metadata including library protocol, sample features or contaminations from RNA-seq datasets. KmerExploR results are visualized through a user-friendly interface. Moreover, we demonstrate that the Kmerator Suite can be used for advanced queries targeting known or new biomarkers such as mutations, gene fusions or long non-coding RNAs for human health applications.


Figures

Figure 1.
Figure 1.
Kmerator Suite and Kmerator levels: definitions. (A) The Kmerator Suite is a set of three tools: (1) Kmerator extracts gene/transcript k-mer signatures. It takes as input a reference genome and a reference transcriptome + a list of gene or transcript sequences to extract specific k-mers from. The output is a set of fasta files (one per input gene/transcript sequence) with the specific k-mers. (2) countTags quantifies input k-mers in a set of input sequencing raw files (fastq files) and outputs a count table. (3) KmerExploR is a particular application of Kmerator/countTags to visualize input RNA-seq dataset (set of fastq files) characteristics. The default usage includes characteristics related to the sequencing protocol (ribosomal depletion, polyA+, strand-specific protocol, 5′/3′ bias), tissue origin (sex) and possible contaminations (mycoplasma, virus, other species or HeLa cell line). Users can also visualize their own signatures with the advanced usage. Details are given in the text and Supplementary Figure S1. (B) Kmerator extracts gene/transcript k-mer signatures with three possible levels of stringency. This figure describes how the different levels are defined (transcript, gene or chimera) for two example genes A and B. Example gene A has three isoforms: A1, A2 and A3. A1 is the only one with a free interval, i.e. a region not covered by other isoforms, and is defined as the principal transcript (APPRIS database). Therefore, at the transcript level, each transcript has its own specific k-mer set, depending on its coverage with other isoforms. At the gene level, the principal transcript defined with the APPRIS database is used, and specific k-mers can be common to several isoforms. At the chimera level (example of A1–B1 fusion), the k-mer is not described in annotations.
Figure 2.
Figure 2.
Kmerator performances on the whole transcriptome. We extracted k-mer signatures from all the human Ensembl transcriptome v91 at both gene (54 874 coding and non-coding genes, left) and transcript (i.e. 199 181 transcripts, right) levels. (A) The first pie chart represents the proportion of genes having specific k-mers (turquoise) versus those without specific k-mers (red). (B) In the same way, we represented the proportion of transcripts having specific k-mers (turquoise) or not (red). For these two classes, we looked at the percentage having free intervals, i.e. regions in the transcript not shared with other isoforms (secondary pie). Most of the transcripts lacking specific k-mers do not have free intervals (91%). We tested Kmerator sensitivity to quantify simulated data, at both gene (C) and transcript (D) levels. We represented the k-mer counts normalized per billion of k-mers in the sample (Y-axis) as a function of the true expression in TPM (X-axis), on the whole simulated dataset. R is the Spearman’s correlation coefficient between k-mer counts and TPM. Each point on the graph is a transcript and the color scale depends on the transcript density on the graph.
Figure 3.
Figure 3.
KmerExploR default usage: basic features. All presented bar plots are direct output of KmerExploR and they are generated from the Dataset-FEATURES described in Supplementary Table S1 (103 paired-end ENCODE samples) except for the orientation (C), which is a subset of eight RNA-seq from the Dataset-FEATURES. For each bar plot, the legend lists the set of predictor genes for which k-mer mean counts are computed (see also Table 1). Samples are on the X-axis. Panels (A), (B) and (C) have the mean k-mer counts by gene normalized per billion of k-mers on the Y-axis. (A) Sex determination. Samples are sorted by sex in the order female, then male. (B) PolyA+ selection versus ribo-depletion by histone detection. Samples are sorted by protocol in this order: polyA, ribo-depletion, unknown. (C) Stranded versus unstranded sequencing protocol. For this category, both fastq files by sample are shown. The first four samples are unstranded and the last four samples are stranded. (D) Read position biases along 5′ UTR, 3′ UTR and CDS regions. After computing k-mer mean counts by gene, they are summed up by 5′ UTR, 3′ UTR or CDS regions and converted in % (Y-axis).
Figure 4.
Figure 4.
KmerExploR default usage: contaminations. All presented bar plots are direct output of KmerExploR and all bar plot datasets are described in Supplementary Table S1. For each bar plot, the legend lists the set of predictors for which k-mer mean counts are computed (details in Table 1). Samples are on the X-axis. Panels (A), (B) and (D) have the mean k-mer counts by gene normalized per billion of k-mers on the Y-axis. (A) Mycoplasma contamination on the Dataset-MYCO (33 single-read samples). (B) Virus detection on the Dataset-VIRUS-CCLE (22 paired-end samples). (C) Species determination on the Dataset-SPECIES (27 paired-end samples). For this category, after computing k-mer mean counts by species, they are converted in % (Y-axis) to avoid big expression differences between species. (D) HeLa determination on the Dataset-HELA-CCLE (three paired-end samples). The sample in the middle is a HeLa cell line and the two others are negative controls (SF767 and SiHa cells).
Figure 5.
Figure 5.
KmerExploR advanced usage: quantification of transcriptomic events outside the annotations. All presented bar plots are direct output of KmerExploR and they are all generated from the Dataset-LEUCEGENE described in Supplementary Table S1 (131 paired-end samples). This dataset includes normal CD34+ cells as control (in green on the X-axis) and different AML subtypes (in black on the X-axis). For each bar plot, the legend lists the set of predictors for which k-mer mean counts normalized per billion (Y-axis) are computed. (A) Chimera detection. Two well-known fusion RNAs associated with chromosomal translocation and their reciprocal counterparts are presented: RUNX1–RUNXT1 t(x,21) and PML–RARA t(15,17). (B) Mutation detection. TET2, KRAS and CEBPA genes are used in AML diagnosis. The bar plot shows four different mutations for these genes, detected specifically in some AML samples. The reference allele for each of these mutations is detected in almost all samples. (C) New lncRNA detection: NONE ‘chr2-p21’ lncRNA described in (23). This transcript is expressed in the whole dataset but shows different levels of expression depending on AML subtype.

Similar articles

Cited by

References

    1. Collado-Torres L., Nellore A., Kammers K., Ellis S.E., Taub M.A., Hansen K.D., Jaffe A.E., Langmead B., Leek J.T.. Reproducible RNA-seq analysis using recount2. Nat. Biotechnol. 2017; 35:319–321. - PMC - PubMed
    1. Byron S.A., Van Keuren-Jensen K.R., Engelthaler D.M., Carpten J.D., Craig D.W.. Translating RNA sequencing into clinical diagnostics: opportunities and challenges. Nat. Rev. Genet. 2016; 17:257–271. - PMC - PubMed
    1. Xi X., Li T., Huang Y., Sun J., Zhu Y., Yang Y., Lu Z.J.. RNA biomarkers: frontier of precision medicine for cancer. Non-Coding RNA. 2017; 3:9. - PMC - PubMed
    1. Hippen A.A., Greene C.S.. Expanding and remixing the metadata landscape. Trends Cancer. 2020; 7:276–278. - PMC - PubMed
    1. Dobin A., Davis C.A., Schlesinger F., Drenkow J., Zaleski C., Jha S., Batut P., Chaisson M., Gingeras T.R.. STAR: ultrafast universal RNA-seq aligner. Bioinformatics. 2013; 29:15–21. - PMC - PubMed