. 2021 Mar;2(3):300-311.
doi: 10.1038/s43018-021-00180-1. Epub 2021 Mar 24.

Resident and circulating memory T cells persist for years in melanoma patients with durable responses to immunotherapy

Affiliations

Resident and circulating memory T cells persist for years in melanoma patients with durable responses to immunotherapy

Jichang Han et al. Nat Cancer. 2021 Mar.

Abstract

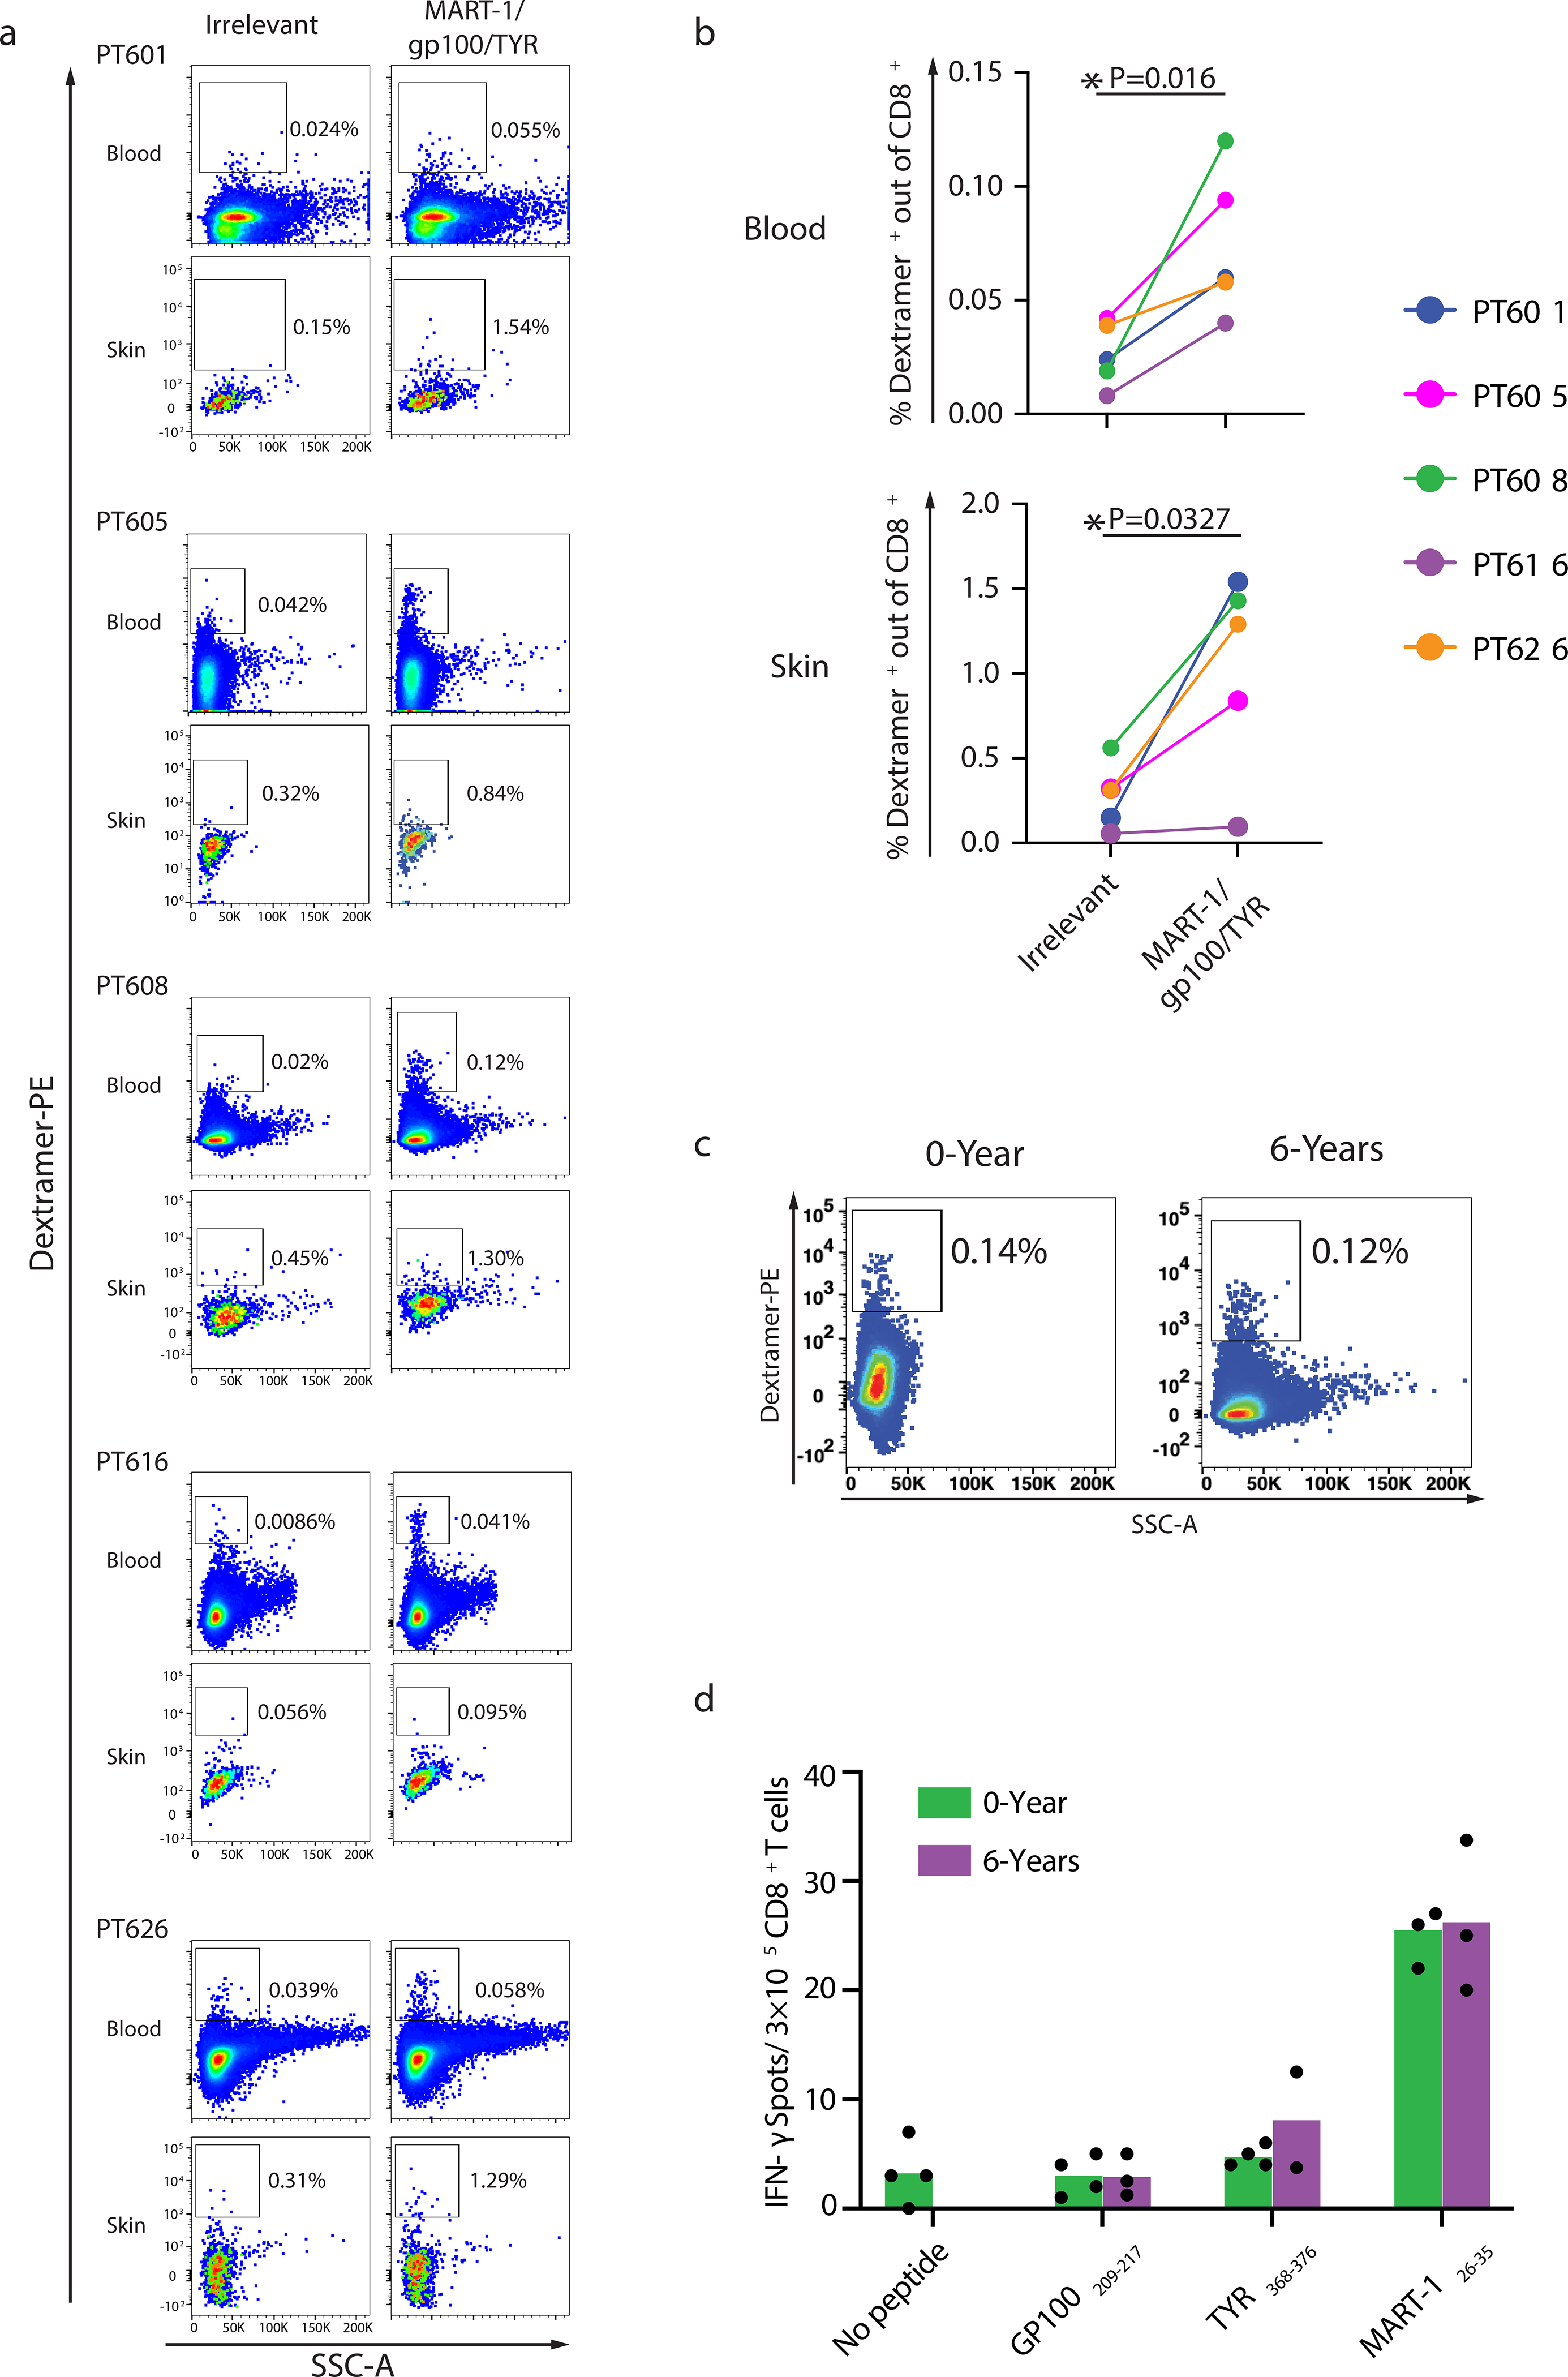
While T-cell responses to cancer immunotherapy have been avidly studied, long-lived memory has been poorly characterized. In a cohort of metastatic melanoma survivors with exceptional responses to immunotherapy, we probed memory CD8+ T-cell responses across tissues, and across several years. Single-cell RNA sequencing revealed three subsets of resident memory T (TRM) cells shared between tumors and distant vitiligo-affected skin. Paired T-cell receptor sequencing further identified clonotypes in tumors that co-existed as TRM in skin and as effector memory T (TEM) cells in blood. Clonotypes that dispersed throughout tumor, skin, and blood preferentially expressed a IFNG / TNF-high signature, which had a strong prognostic value for melanoma patients. Remarkably, clonotypes from tumors were found in patient skin and blood up to nine years later, with skin maintaining the most focused tumor-associated clonal repertoire. These studies reveal that cancer survivors can maintain durable memory as functional, broadly-distributed TRM and TEM compartments.


Conflict of interest statement

Competing Interests Statement All authors declare no competing interests.

Figures

Extended Data Fig. 1
Extended Data Fig. 1. Summary of melanoma patient treatments and specimens
Detailed summary of the melanoma clinical stage, types and durations of immunotherapy treatments, and specimens collected per patient. Large arrow indicates the timeline for individual patient (not to scale). The time between date of last treatment and tissue biopsy is annotated in black. Small arrows show the timepoints of each specimen collection along with the experiments done for each specimen annotated in parentheses. scRNA=scRNA/scTCR-seq; flow = flow cytometry; Adaptive = TCR Vb DNA sequencing. Different colors indicate different types of immunotherapy as depicted in the legend.
Extended Data Fig. 2
Extended Data Fig. 2. FACS gating strategy
Pseudocolor graphs show the gating strategy for FACS of each tissue. CD45+CD8+ and CD45+CD4+ cells were sorted by FACS into the same well. Values of x and y axis represent fluorescence intensities. Percentages of cell populations were labelled in each graph.
Extended Data Fig. 3
Extended Data Fig. 3. Resident memory CD8+ T cells expressing CD69 reside in both the epidermis and dermis in long-term metastatic melanoma survivors with immunotherapy-associated vitiligo
(a) Representative pseudocolor dot plots showing the gating strategy for the live CD45+ CD3+ CD8+ population. (b) Contour plots show the expression of CD69, CD103 and CD62L on pre-gated CD8+ population by flow cytometry. The number represents the proportion out of total CD8+ T cells. (c) Immunohistochemistry staining for CD8+ CD69+ resident memory CD8+ T cells in the skin from patient PT628. Images are representative of multiple fields from at least three skin sections taken from each of 4 individual patients. CD8 was stained in green and CD69 was stained in red. CD8+ and CD69+ single-stain cells are indicated by green and red arrows, respectively. Black cells (indicated by black arrows) are CD8+CD69+ co-stained cells. Original magnification: 10X (left) and 40X (right).
Extended Data Fig. 4
Extended Data Fig. 4. Patient contributions to each CD8+ T-cell cluster
Pie charts depicting the proportion of cells from each patient to the total number of cells in each cluster (C1-C10). Each color represents one individual patient, with the absolute number of cells from each patient labeled in the corresponding slice of the pie chart.
Extended Data Fig. 5
Extended Data Fig. 5. Transcriptional profiles of clusters C8-C10 are enriched in consensus TRM gene lists while the transcription profiles of clusters C1-C7 are not enriched for core TRM genes
(a) GSEA analysis showing that the upregulated genes of TRM were enriched in the downregulated genes in clusters C1-C7 demonstrating that only clusters C8-C10 have key features of TRM. NESs and FDR q-values are shown for each gene set. The statistics were performed by the two-sample Kolmogorov-Smirnov test. (b) Heatmaps depict the z-transformed mean expression of published consensus skin or tumor TRM gene lists across CD8+ T cell clusters C1-C10. (c) Venn diagrams show the number of genes that overlap between the marker gene list of each cluster (red circle) with the published human cancer TRM gene list (blue circle). The overlap levels between two gene lists were evaluated by two-sided fisher exact test. Enrichment scores and P-values are labeled accordingly. (d)Venn diagrams show the number of genes that overlap between the marker gene list of each cluster (red circle) with the published mouse skin/gut/lung TRM gene list (blue circle). The overlap levels between two gene lists were evaluated by two-sided fisher exact test. Enrichment scores and P-values are labeled accordingly. (e) Heatmap depicts the z-transformed mean expression of a published melanoma infiltrating dysfunctional CD8+ gene list across clusters C1-C10.
Extended Data Fig. 6
Extended Data Fig. 6. TRM-IFNG signature is superior in predicting the survival of stage III/IV melanoma patients
(a) Kaplan–Meier overall survival curves of melanoma patients from two different published datasets, GSE54467 (top, n=75 patients) and GSE19324 (bottom, n=44 patients), stratified by enrichment of signatures derived from each of three TRM clusters. High and low groups were separated by the median value of the Z-transformed normalized mean expression of each gene set (top: N= 37 patients high and N=38 patients low; bottom: N=22 patients high and N=22 patients low). P-values were calculated by two-sided log-rank test. OR P-values were calculated by multivariate Cox regression. (b) Multivariable cox survival regression model evaluating the individual contribution of different variables to the prognosis of melanoma patients from the above datasets, GSE54467 (left) and GSE19324 (right). Forest plots show the means of hazard ratios (HRs) represented by blue squares, the 95% confidence intervals of HRs represented by horizontal bars, and p-values calculated by the two-sided Wald test for each variable.
Extended Data Fig. 7
Extended Data Fig. 7. Tumor-associated TCR clonotypes in the skin and blood of long-term metastatic melanoma survivors
(a) Gini indexes of each tissue (left) or each TRM cluster (right) calculated for n=4 individual patients, showing no significant differences in baseline clonal expansion among different tissues or different TRM clusters. The lines indicate the average Gini index across all four patients for each cluster. Two-sided Wilcoxon test. (b) Venn diagrams showing the number of matched TCR clonotypes between different specimens from individual patients. Colors indicate different tissue origins. The number of TCR clonotypes belonging to each group was labeled accordingly. (c) The distribution of the remaining Resident/Circulating clonotypes (11/15) to the UMAP plot. Dots indicate CD8+ T cells from the same clone. Colors designate different specimen types. (d) The distribution of the remaining Resident-Only clonotypes (14/18) to the UMAP plot. Dots indicate CD8+ T cells from the same clone. Colors designate different specimen types. (e) The distribution of the remaining Circulation-Capable clonotypes (7/11) to the UMAP plot. Dots indicate CD8+ T cells from the same clone. Colors designate different specimen types.
Extended Data Fig. 8
Extended Data Fig. 8. Tumor-associated clonotypes in the skin and blood of patients
Venn diagrams showing the number of matched TCR clonotypes between skin, blood and historically banked tumors of each patient. The number of TCR clonotypes belonging to each group was labeled accordingly.
Figure 1:
Figure 1:. Overlapping transcriptional signatures of CD8+ T cells from skin and tumor of long-term melanoma survivors.
(a) Workflow schematic. Single-cell RNA and TCR sequencing were performed on T cells sorted from vitiligo-affected skin, tumor and peripheral blood. (b) UMAP projection of CD8+ T cells from skin, tumor and blood of four patients. Each dot corresponds to one single cell colored according to tissue (left) or patient identity (right). (c) Feature plots demonstrating the expression of marker genes for CD8+ T-cell residency (CD69, RGS1) or recirculation (S1PR1, SELL). Color scale represents normalized gene expression level. (d) UMAP projection of 10,658 CD8+ T cells from skin, tumor, and blood of four patients, forming ten distinct clusters designated C1-C10 (colored as shown in the legend), with cluster names assigned based on inferred function. (e) Attribution of each specimen type to each cluster. The ratio between observed cell number and random expected cell number calculated by chi-square test (Ro/e) was used to evaluate enrichment, with Ro/e>1 indicating enrichment; colors indicate specimen types; black dots represent individual patients. Bars depict means with error bars representing s.e.m. for n=4 patients; *P< 0.05; **P < 0.01, by one-sided paired Student’s t-test. (f) Heatmap of differentially expressed genes (rows) in cells from different clusters (columns) of four patients. Heatmap colors indicate z-transformed expression of genes in each row, with scale depicted in legend. Annotations (right) highlight representative genes with high differential gene expression within each cluster, relative to other clusters. Colors of gene names indicate corresponding clusters in panel d.
Figure 2:
Figure 2:. TRM cells in skin and tumor are comprised of three subpopulations with discrete features and prognostic signatures.
(a) Gene Set Enrichment Analysis (GSEA) indicating that the upregulated genes of clusters C8, C9 and C10 are significantly enriched in TRM markers. Ticks below the line correspond to gene ranks. Statistical analysis was performed using a two-sided permutation test with multiple testing correction by the BH-FDR method. Normalized enrichment scores (NESs) and FDR q-values are shown for each cluster. (b) Dot plot showing the average Z-transformed normalized expression of tissue residency, effector function and exhaustion/checkpoint-associated genes between the three TRM clusters. Size of each dot indicates the fraction of cells expressing each gene; color scale represents Z-transformed normalized expression. C8-TRM-FOS, C9-TRM-IFNG, and C10-TRM-TOX clusters were named based on noted differentially expressed genes. (c) Kaplan–Meier overall survival curves of TCGA metastatic skin cutaneous melanoma (SKCM) patients stratified by enrichment of signatures derived from each of three TRM clusters. High (N = 179 patients) and low (N = 177 patients) were separated by the median value of the Z-transformed normalized mean expression of each gene set. P values were calculated by two-sided log-rank test. (d) Multivariable cox survival regression model evaluating the individual contribution of different variables to the prognosis of TCGA-advanced SKCM patients. N=206 metastatic melanoma patients with all the information for the clinical variables analyzed from the TCGA dataset were applied in this analysis. Forest plot shows the means of hazard ratios (HRs) represented by blue squares, 95% confidence intervals of the HRs represented by horizontal bars, and P values calculated by the two-sided Wald test for each variable.
Figure 3:
Figure 3:. Promiscuously distributed CD8+ T cell clonotypes show a propensity to form TRM-IFNG cells in skin and tumor.
(a) Venn diagram indicating the number of shared vs. discrete TCR clonotypes (meeting defined criteria, see Methods) between different tissues in four patients. (b) UMAP plots indicating features of three tumor-associated clonotypic categories. Four representative clonotypes are depicted for each category. Clusters from Fig. 1d are shown for reference (left); dots represent individual cells of a given clonotype, with colors denoting T-cell tissue of origin. (c) Distribution of T cells from different tumor-associated clonotypic categories among transcriptional clusters. N=15, N=18 and N=11 TCR clonotypes were analyzed for the Resident/Circulating, Resident-Only or Circulation-Capable categories respectively. X-axis indicates cluster and Y-axis depicts the Enrichment_Score (see Methods). Each dot represents a different TCR clonotype and is colored according to the category as in (a). Lines indicate average enrichment scores. NA indicates data not applicable. *P < 0.05; **P < 0.01; ***P < 0.001; two-sided paired Student’s t-test. (d) Dot plot showing the clonal frequency of the 15 Resident/Circulating, 18 Resident-Only, and 11 Circulation-Capable tumor-associated TCR clonotypes in each specimen type. Colors designate different specimen types.
Figure 4:
Figure 4:. Melanoma antigen-specific T cells accumulate in skin and blood and are capable of long-lived functional recall.
(a) Dextramer staining of CD8+ T cells specific for MART-1, gp100, and TYR dextramers (pooled) vs. irrelevant dextramer, in blood and skin. All dot plots were pre-gated on CD45+ CD3+ CD8+ cells. Percentages represent the proportion of dextramer positive cells out of total CD8+ T cells. Data from five individual patients are shown. (b) Summary of % dextramer+ cells out of total CD8+ T cells for the 5 patients shown in panel a. Colors represent individual patients; *P < 0.05 by one-sided paired Student’s t-test for irrelevant vs. relevant dextramer staining. (c) Persistence of MART-1, gp100, and TYR (pooled)-specific response in the blood of PT608 over a period of 6 years; pre-gated on the CD45+ CD3+ CD8+ population. (d) IFNγ ELISpot showing individual peptide-specific CD8+ T cells in blood specimens taken from the same patient six years apart. Y-axis shows the number of IFNγ spots per 3 × 10⁵ CD8+ T cells. Dots indicate individual assay replicates (individual wells) from the same blood specimen; bars depict means. ELISpot was performed twice with similar results.
Figure 5:
Figure 5:. Tumor-associated T cell clonotypes persist for up to nine years, with skin sustaining a focused repertoire.
(a) Timeline of patient specimen acquisitions (in years) prior to skin biopsy; all samples were analyzed by bulk TCRß CDR3 region DNA sequencing (b) Representative Venn diagram depicting number of tumor-associated clonotypes shared between tissues in one patient. (c) Heatmaps depicting clonal overlap, calculated as a match index (see Methods), between patient-matched tumor and skin or tumor and blood specimens. (d) Comparison of clonal overlap between tumor and skin vs. tumor and blood for individual tumor specimens. Lines link a single tumor specimen; with symbols representing different patients. Significance denotes overall difference in clonal match index between skin and blood, determined using N=14 tumor specimens taken from a total of 7 patients; *P < 0.05 by two-sided paired Student’s t-test.
Figure 6:
Figure 6:. CD8+ T cell clones from tumors persist as TRM cells in skin and as TEM cells in blood.
(a) Tumors were paired with blood and skin specimens taken at least three years subsequently, and were analyzed by bulk TCRß CDR3 region DNA sequencing. Scatter plots depict the expansion of persisting clonotypes in skin and blood that are matched to tumors. Clonal expansion in skin (top) and clonal expansion in blood (bottom), indicating that tumor-associated clonotypes that had expanded in skin were also highly expanded in blood (bottom right). Dots indicate individual clonotypes; colors represent different tumors. Labeled clones A, B, C, and D are four tumor-associated DNA clonotypes that could be matched 6 years later to clonotypes in the scRNA-seq dataset from the skin and blood of PT635. (b) Fully reconstructed paired TCR sequences from these clones are shown in the table (top); red denotes perfectly matched CDR3 regions). UMAP plots (bottom) indicate cluster distribution of these four long-persisting clonotypes in the single cell RNA-seq dataset from skin and blood of N=1 patient (PT635), with dots representing individual cells and colors denoting tissue of distribution. (c) Distribution of N=4 long-persisting TCR clonotypes from N=1 patient (PT635) among transcriptional clusters in the skin and blood. Points represent individual clonotypes, and lines indicate average enrichment scores, showing significance in differences of enrichment scores of all four clonotypes across the indicated clusters; **P < 0.01 and ***P < 0.001 by two-sided paired Student’s t-test.

Comment in

References

    1. Larkin J et al. Five-Year Survival with Combined Nivolumab and Ipilimumab in Advanced Melanoma. N Engl J Med 381, 1535–1546, doi:10.1056/NEJMoa1910836 (2019). - DOI - PubMed
    1. Robert C et al. Nivolumab in previously untreated melanoma without BRAF mutation. N Engl J Med 372, 320–330, doi:10.1056/NEJMoa1412082 (2015). - DOI - PubMed
    1. Weber JS et al. Nivolumab versus chemotherapy in patients with advanced melanoma who progressed after anti-CTLA-4 treatment (CheckMate 037): a randomised, controlled, open-label, phase 3 trial. Lancet Oncol 16, 375–384, doi:10.1016/S1470-2045(15)70076-8 (2015). - DOI - PubMed
    1. Huang AC et al. T-cell invigoration to tumour burden ratio associated with anti-PD-1 response. Nature 545, 60–65, doi:10.1038/nature22079 (2017). - DOI - PMC - PubMed
    1. Krieg C et al. High-dimensional single-cell analysis predicts response to anti-PD-1 immunotherapy. Nat Med 24, 144–153, doi:10.1038/nm.4466 (2018). - DOI - PubMed

Publication types

Substances