. 2021 Apr;2(4):414-428.
doi: 10.1038/s43018-021-00183-y. Epub 2021 Apr 1.

FATTY ACID SYNTHESIS IS REQUIRED FOR BREAST CANCER BRAIN METASTASIS

Affiliations

FATTY ACID SYNTHESIS IS REQUIRED FOR BREAST CANCER BRAIN METASTASIS

Gino B Ferraro et al. Nat Cancer. 2021 Apr.

Erratum in

  • Author Correction: Fatty acid synthesis is required for breast cancer brain metastasis.
    Ferraro GB, Ali A, Luengo A, Kodack DP, Deik A, Abbott KL, Bezwada D, Blanc L, Prideaux B, Jin X, Posada JM, Chen J, Chin CR, Amoozgar Z, Ferreira R, Chen IX, Naxerova K, Ng C, Westermark AM, Duquette M, Roberge S, Lindeman NI, Lyssiotis CA, Nielsen J, Housman DE, Duda DG, Brachtel E, Golub TR, Cantley LC, Asara JM, Davidson SM, Fukumura D, Dartois VA, Clish CB, Jain RK, Vander Heiden MG. Ferraro GB, et al. Nat Cancer. 2021 Nov;2(11):1243. doi: 10.1038/s43018-021-00283-9. Nat Cancer. 2021. PMID: 35122065 No abstract available.

Abstract

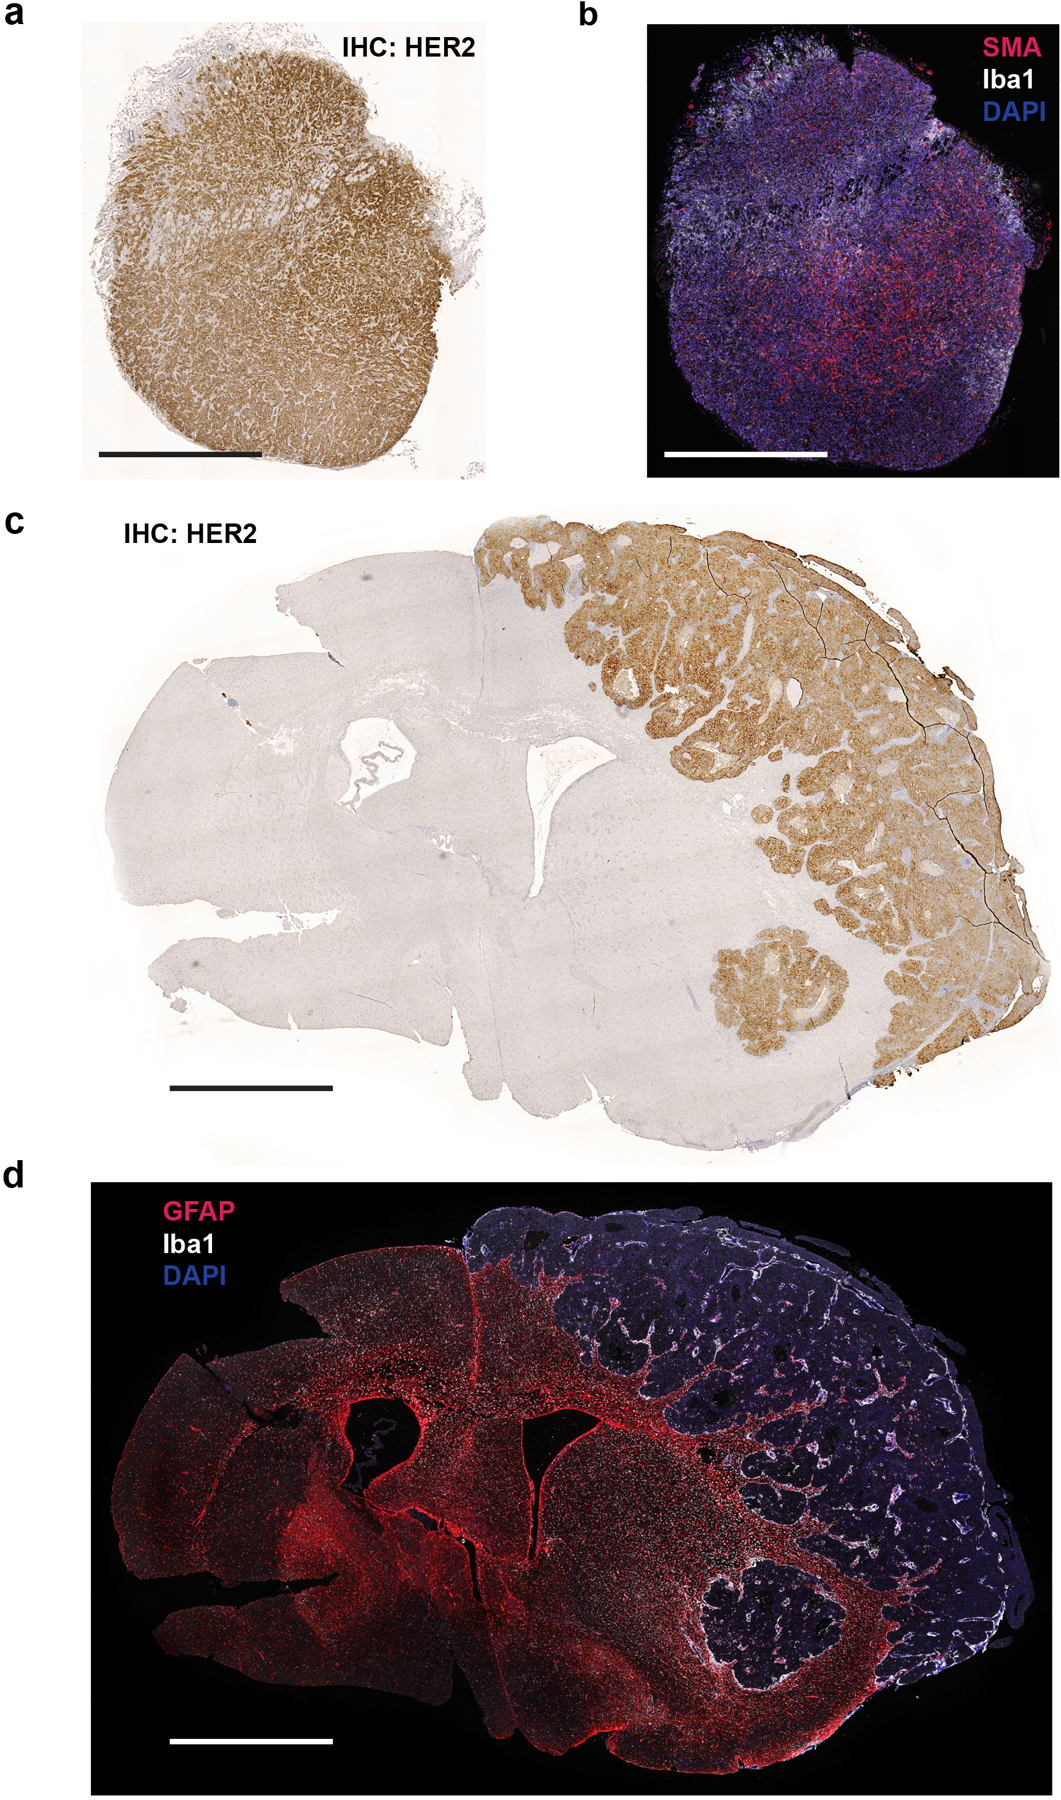
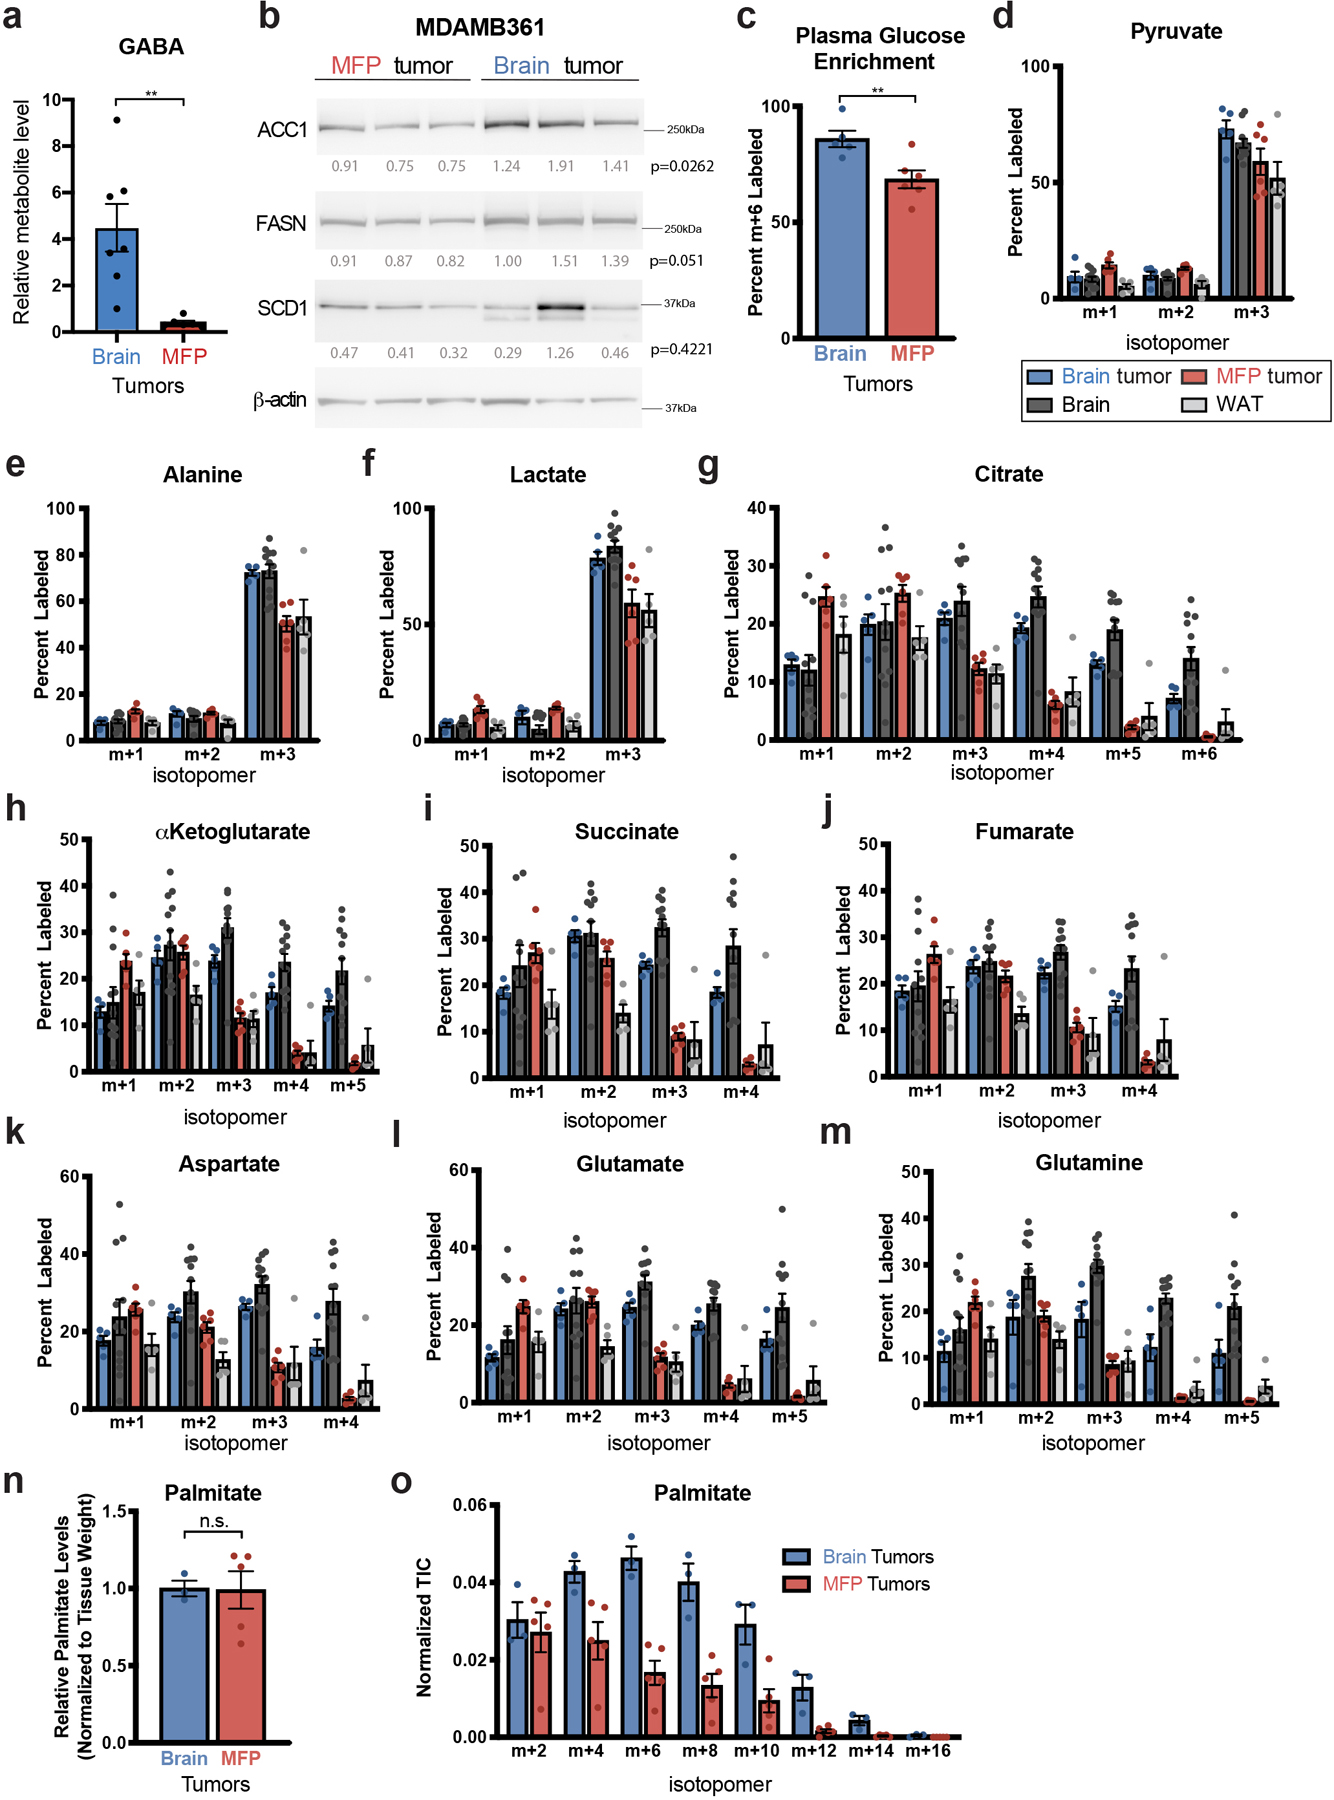
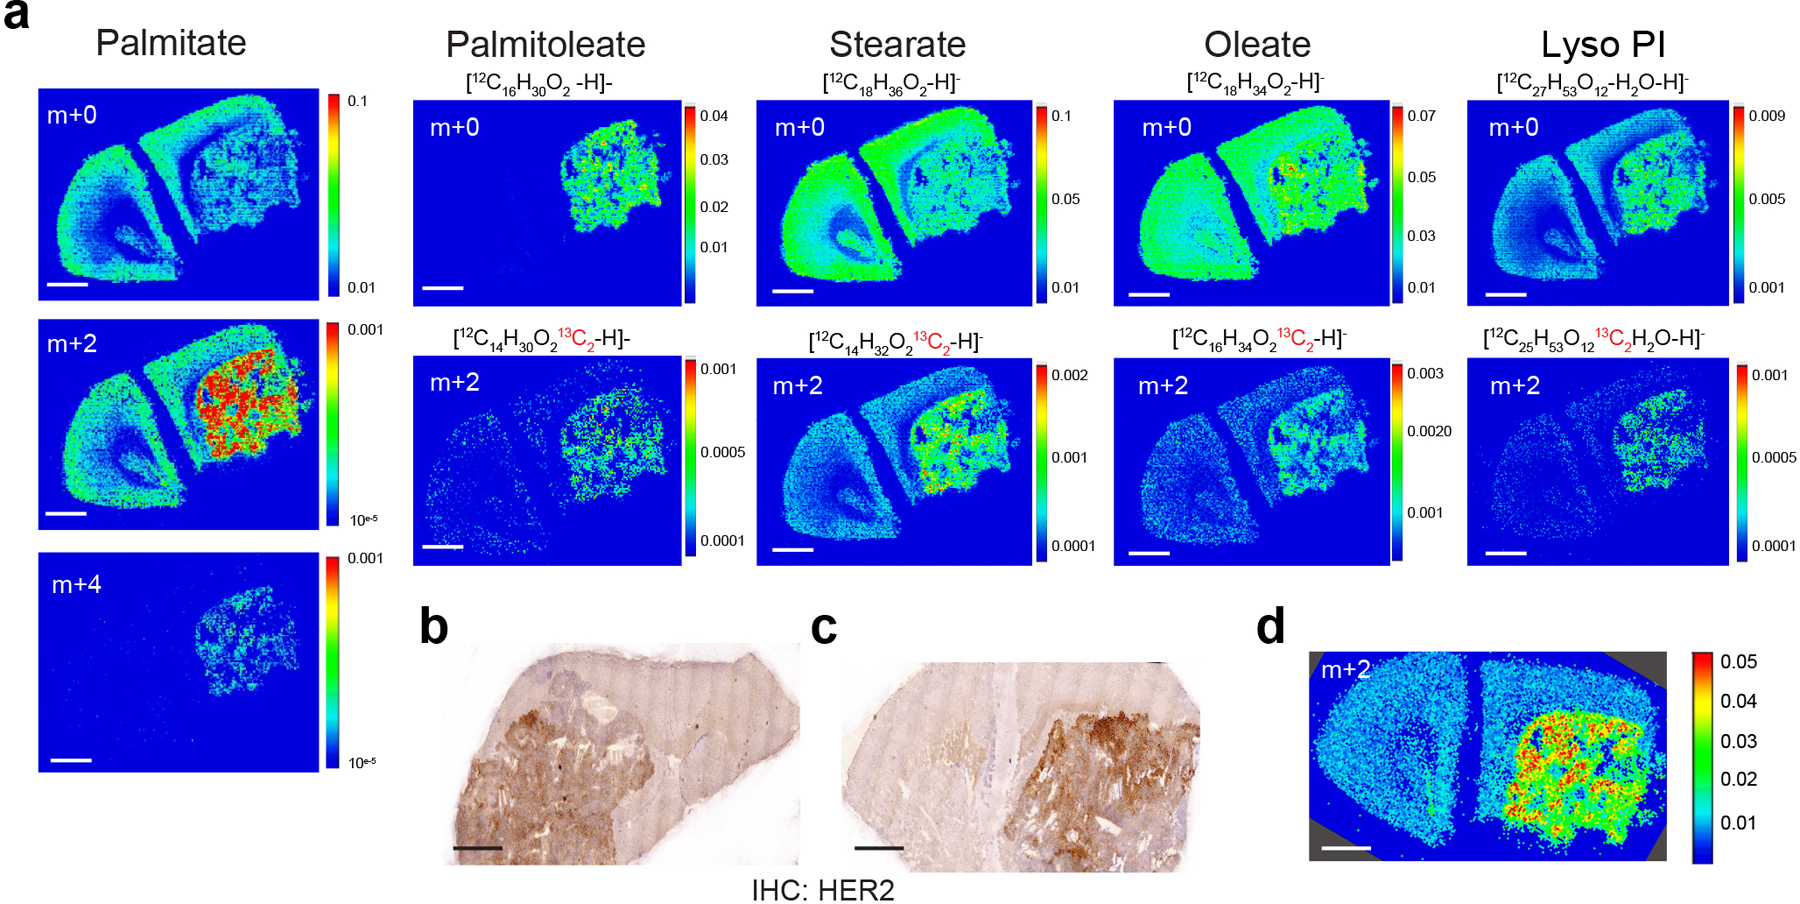
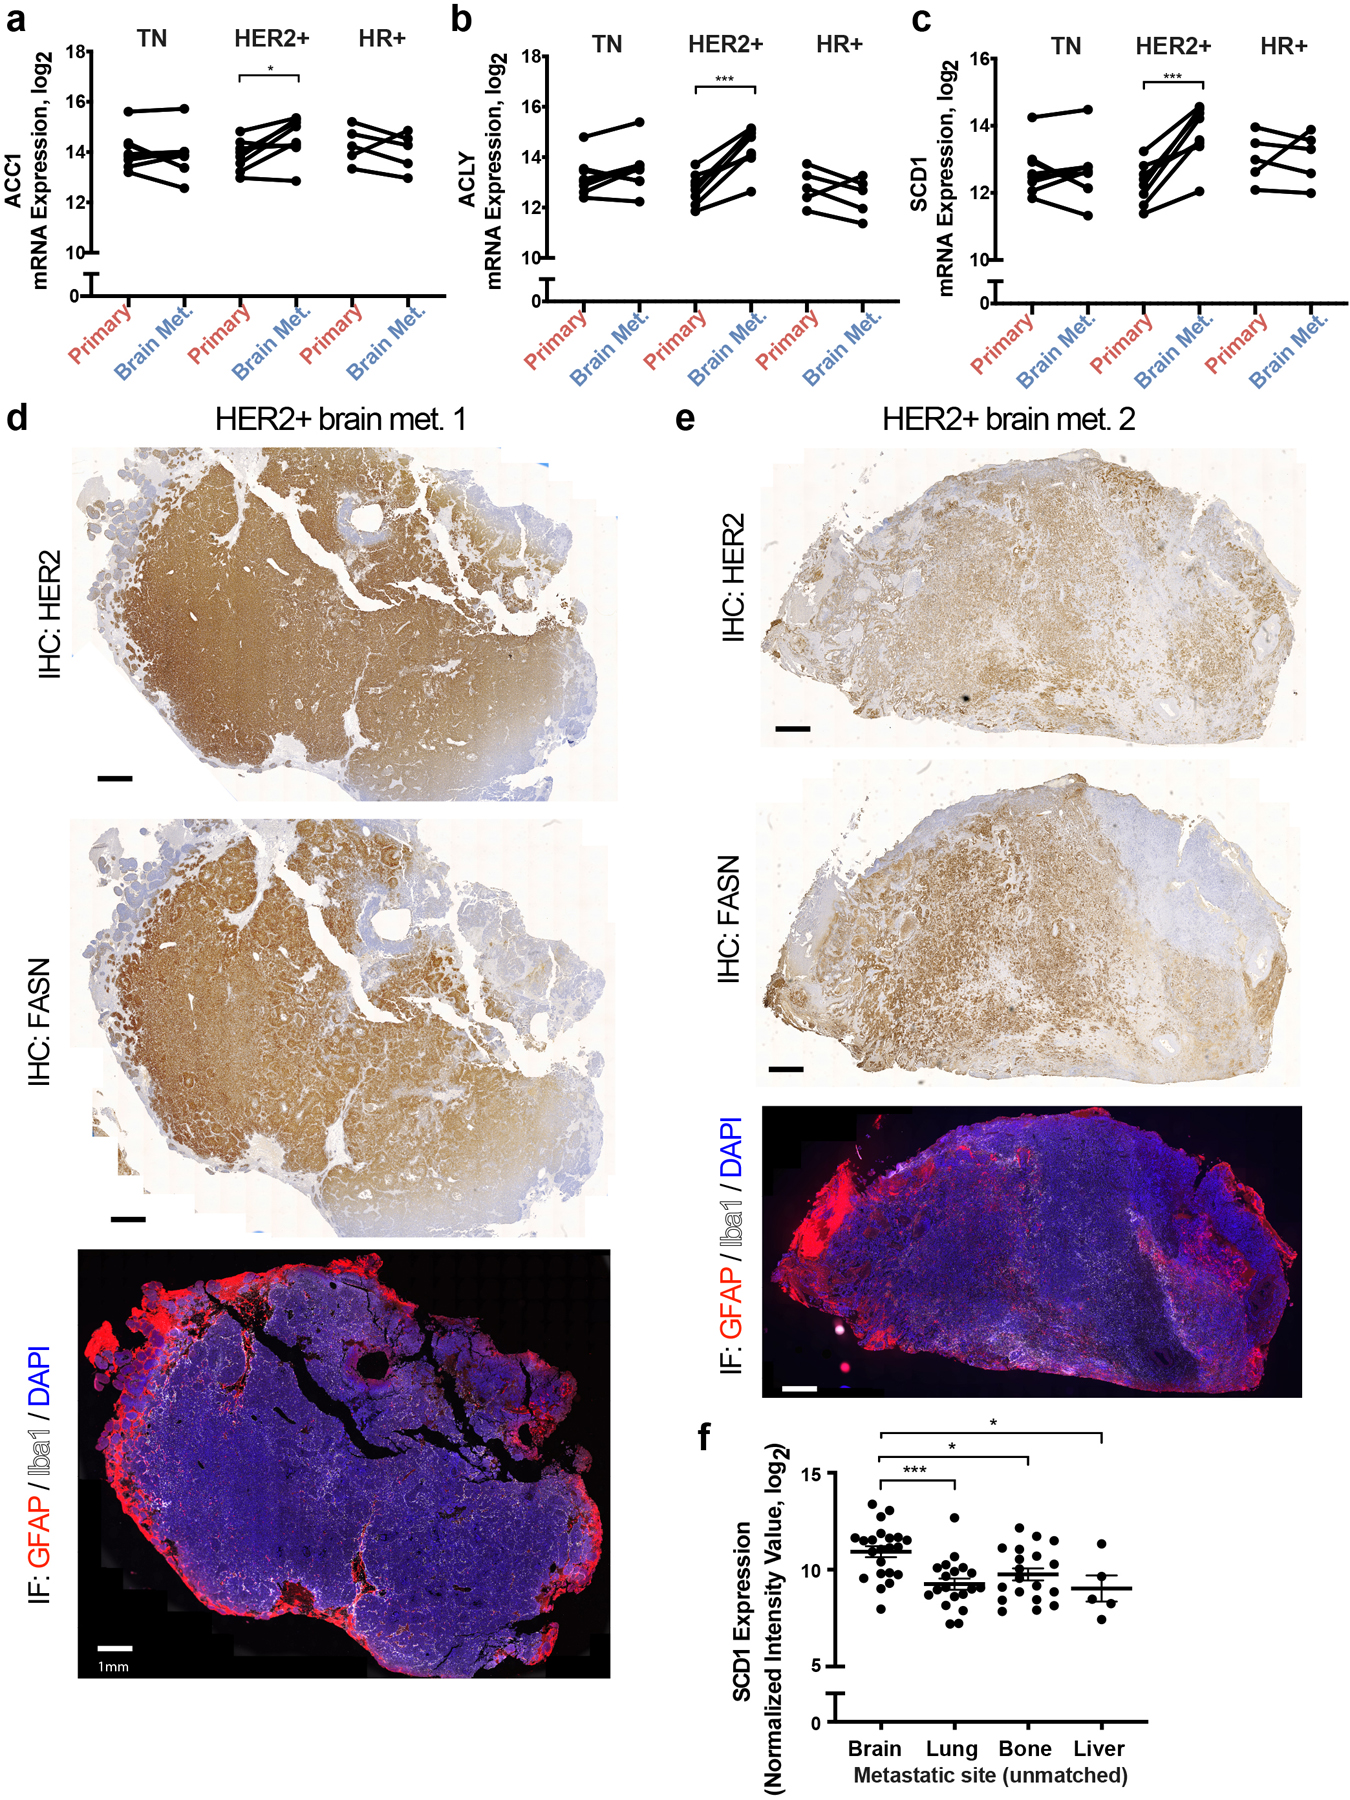
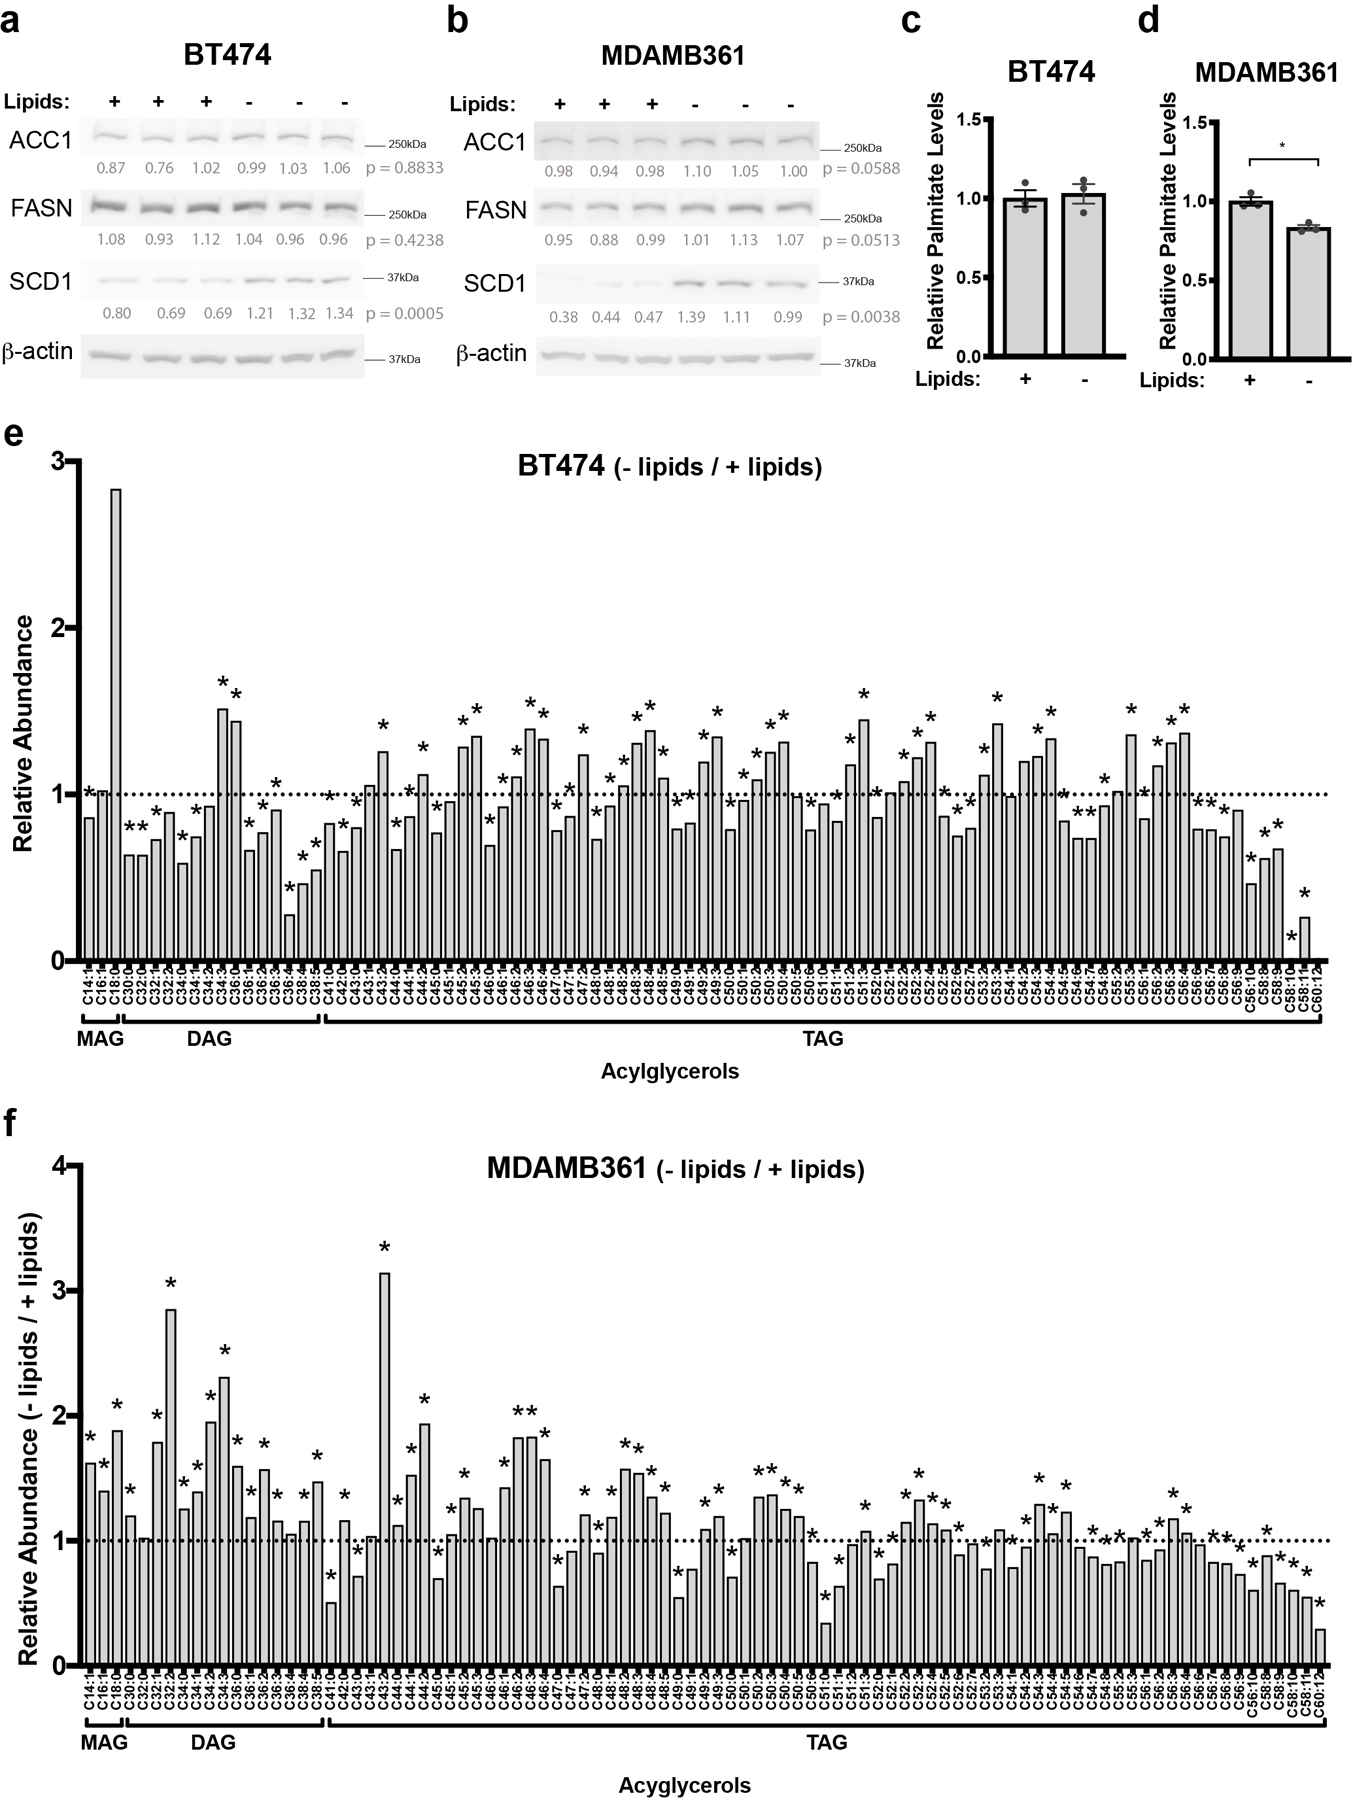
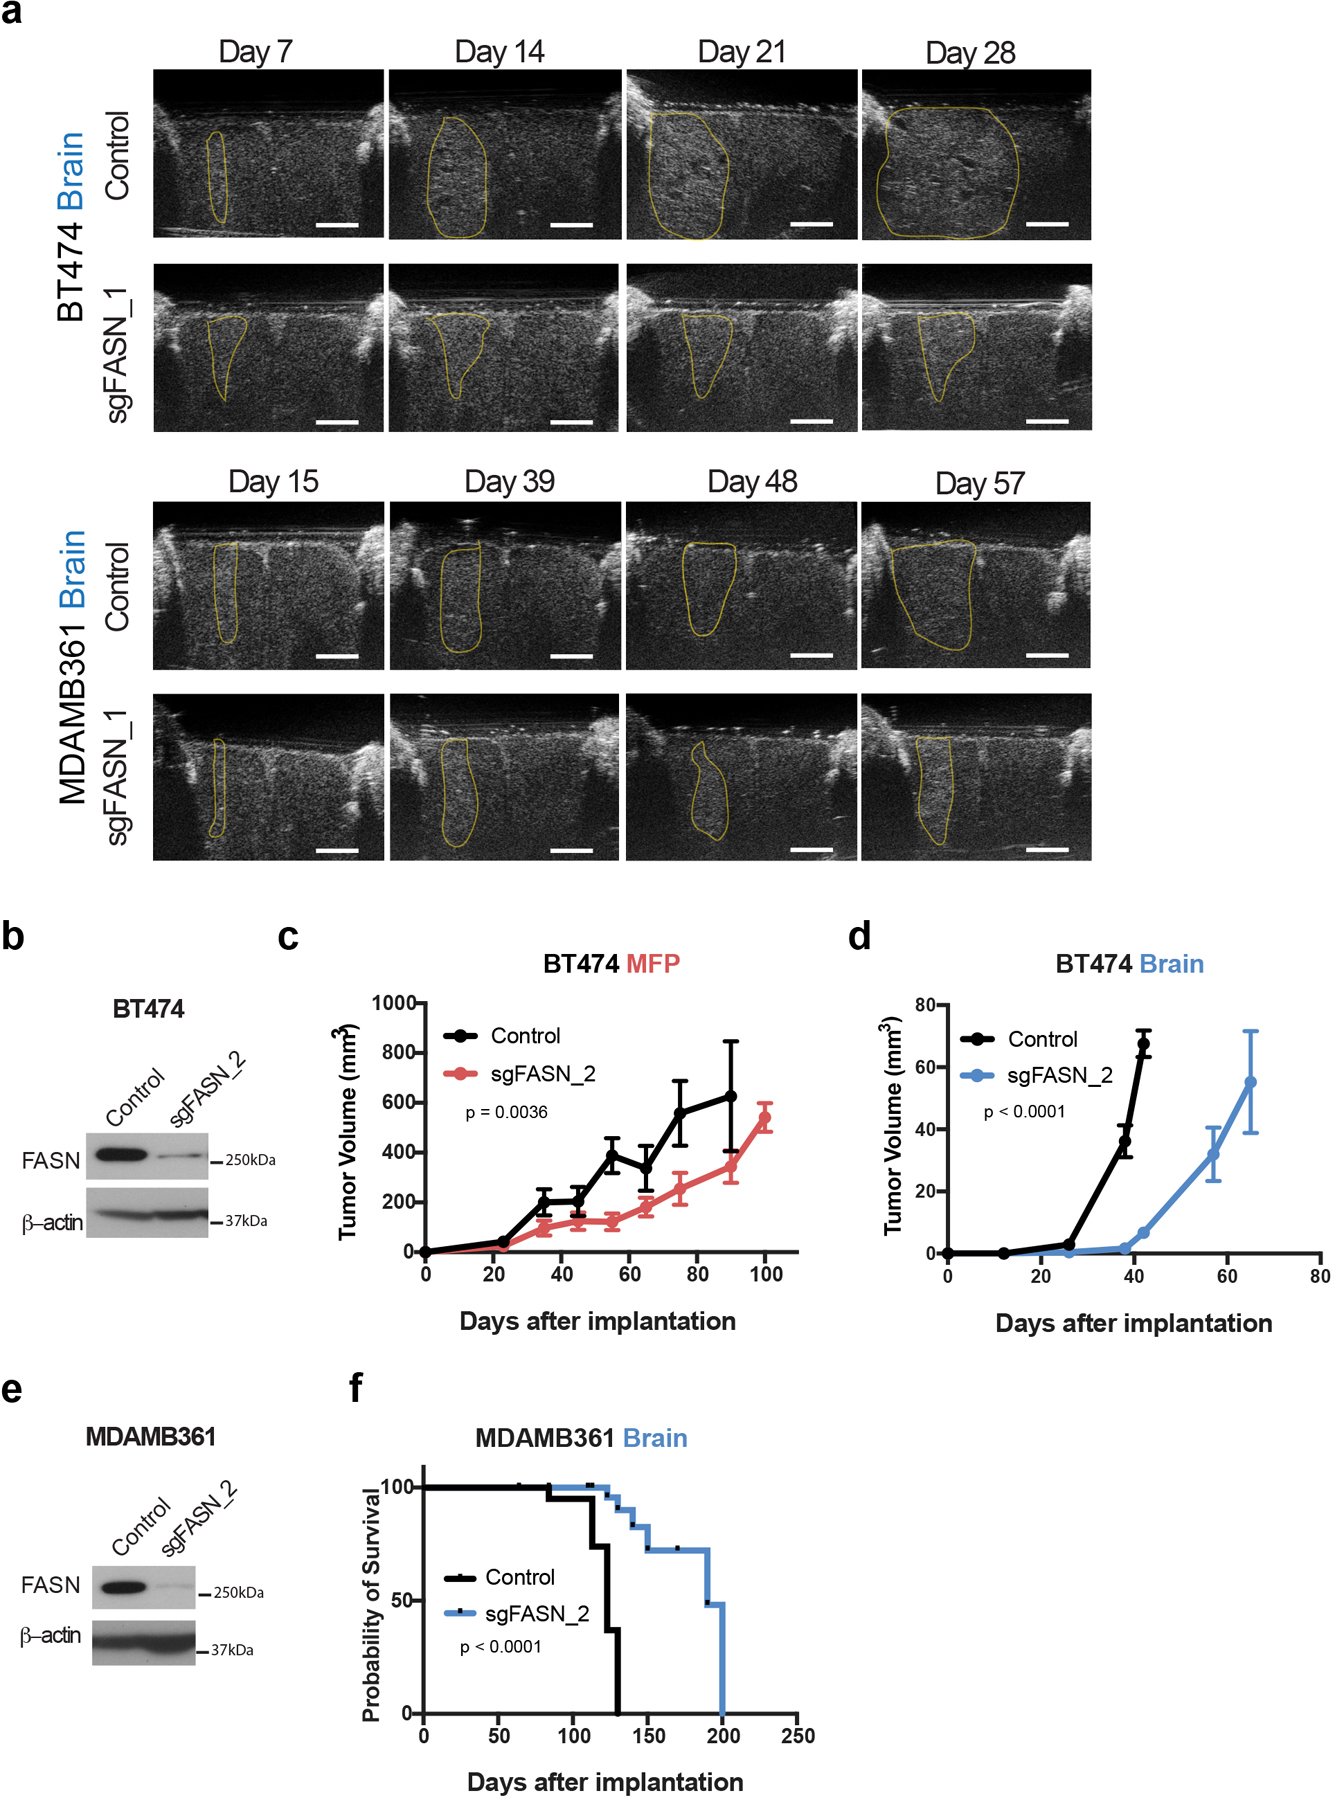
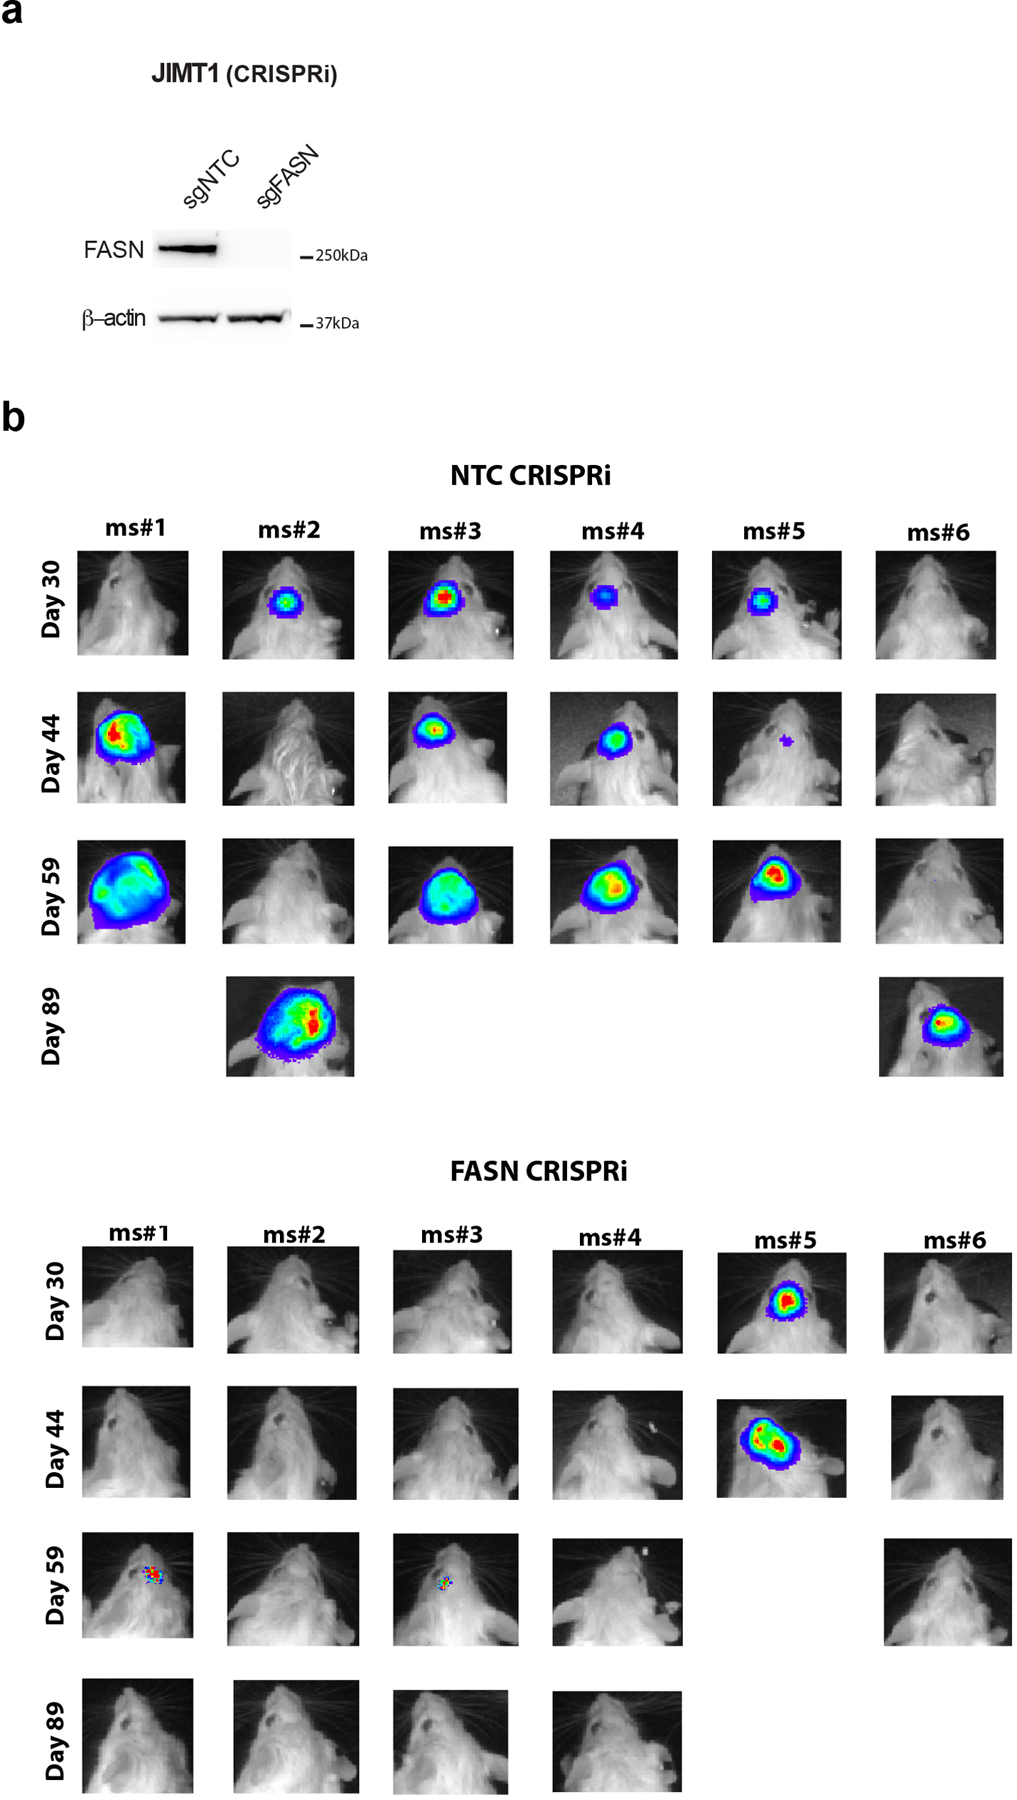
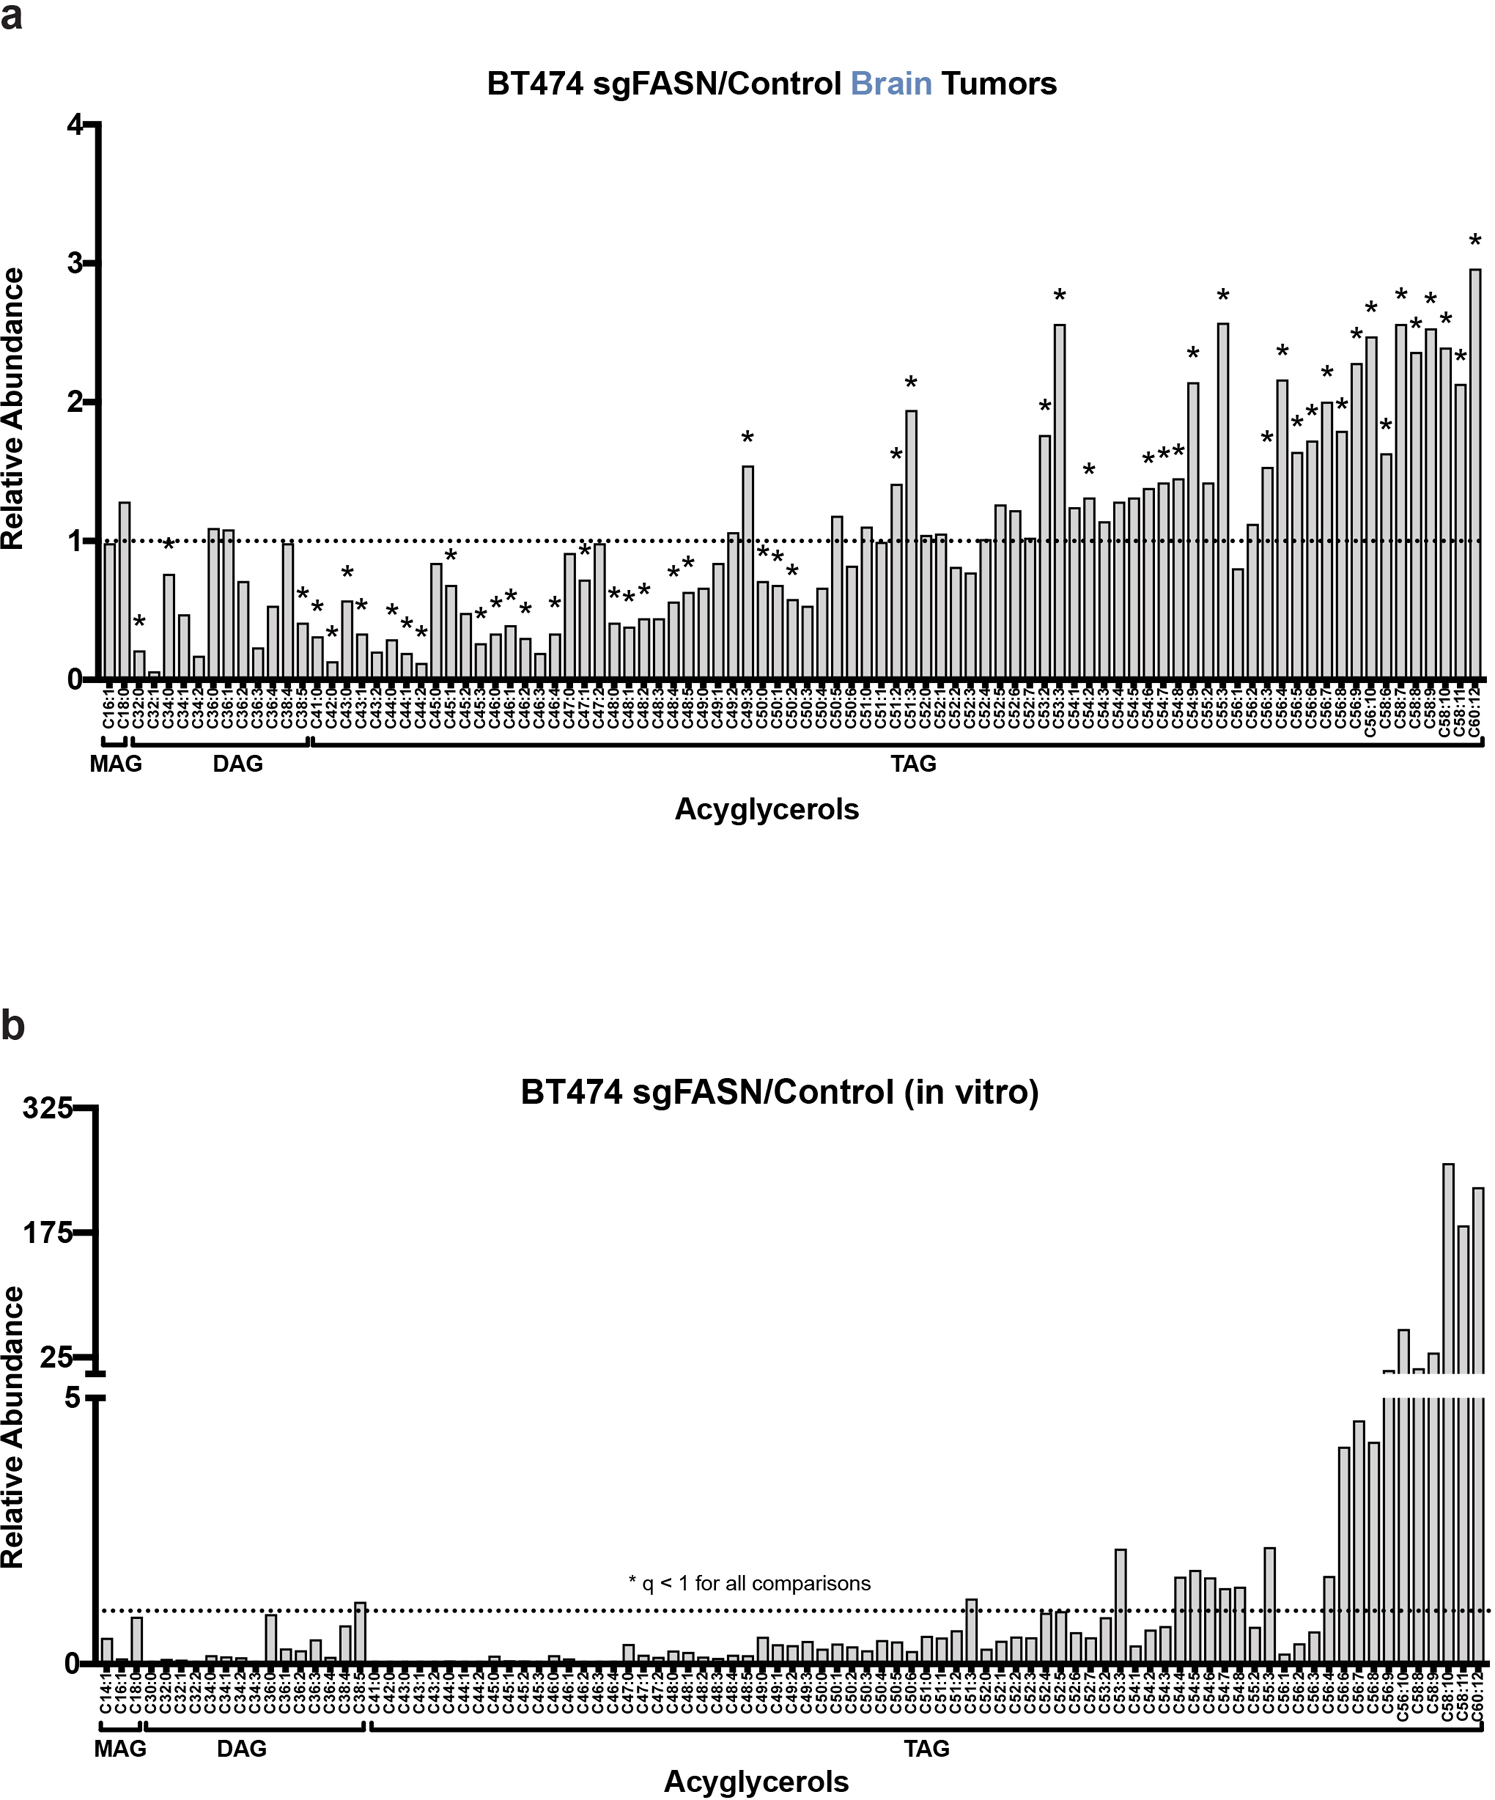
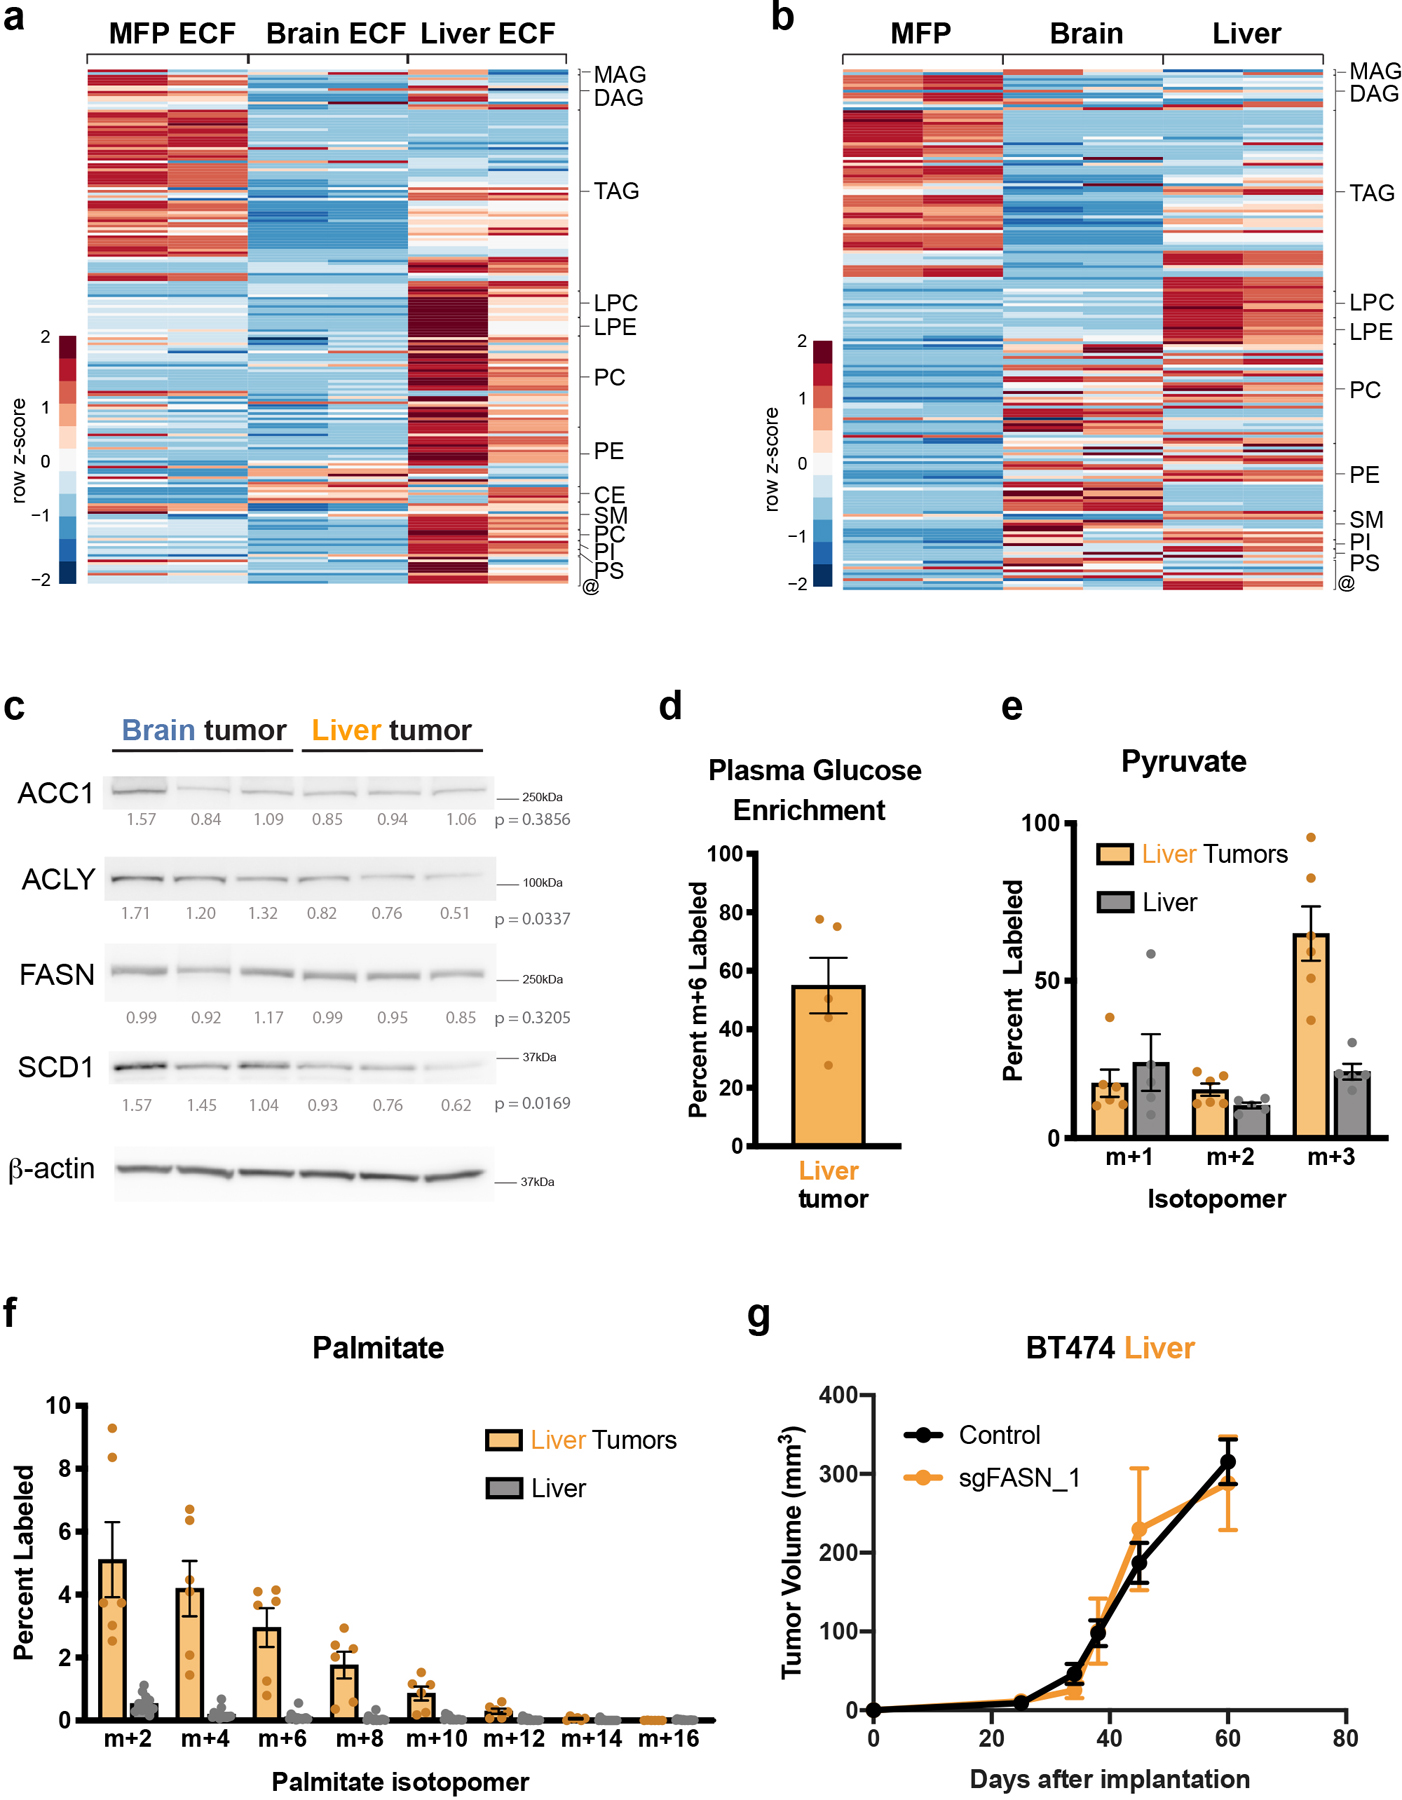
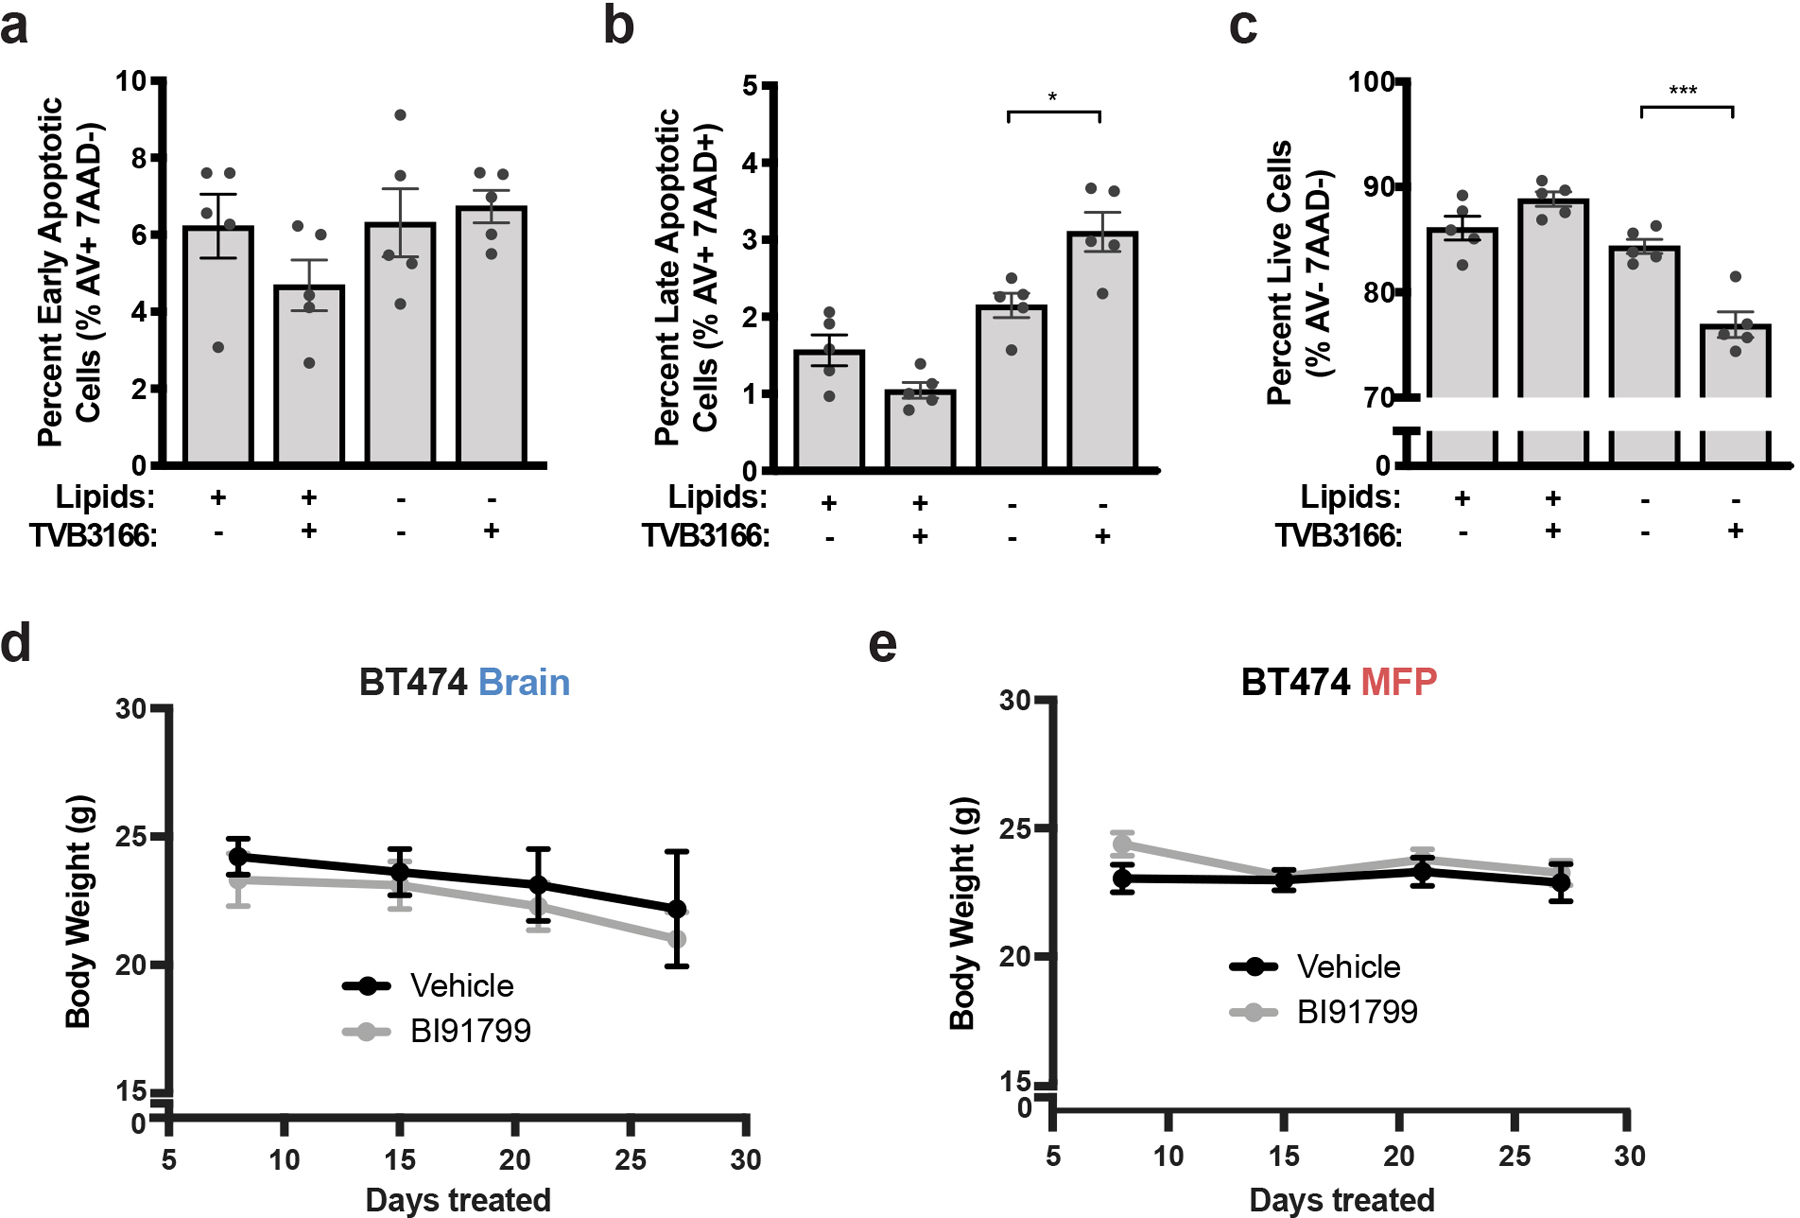
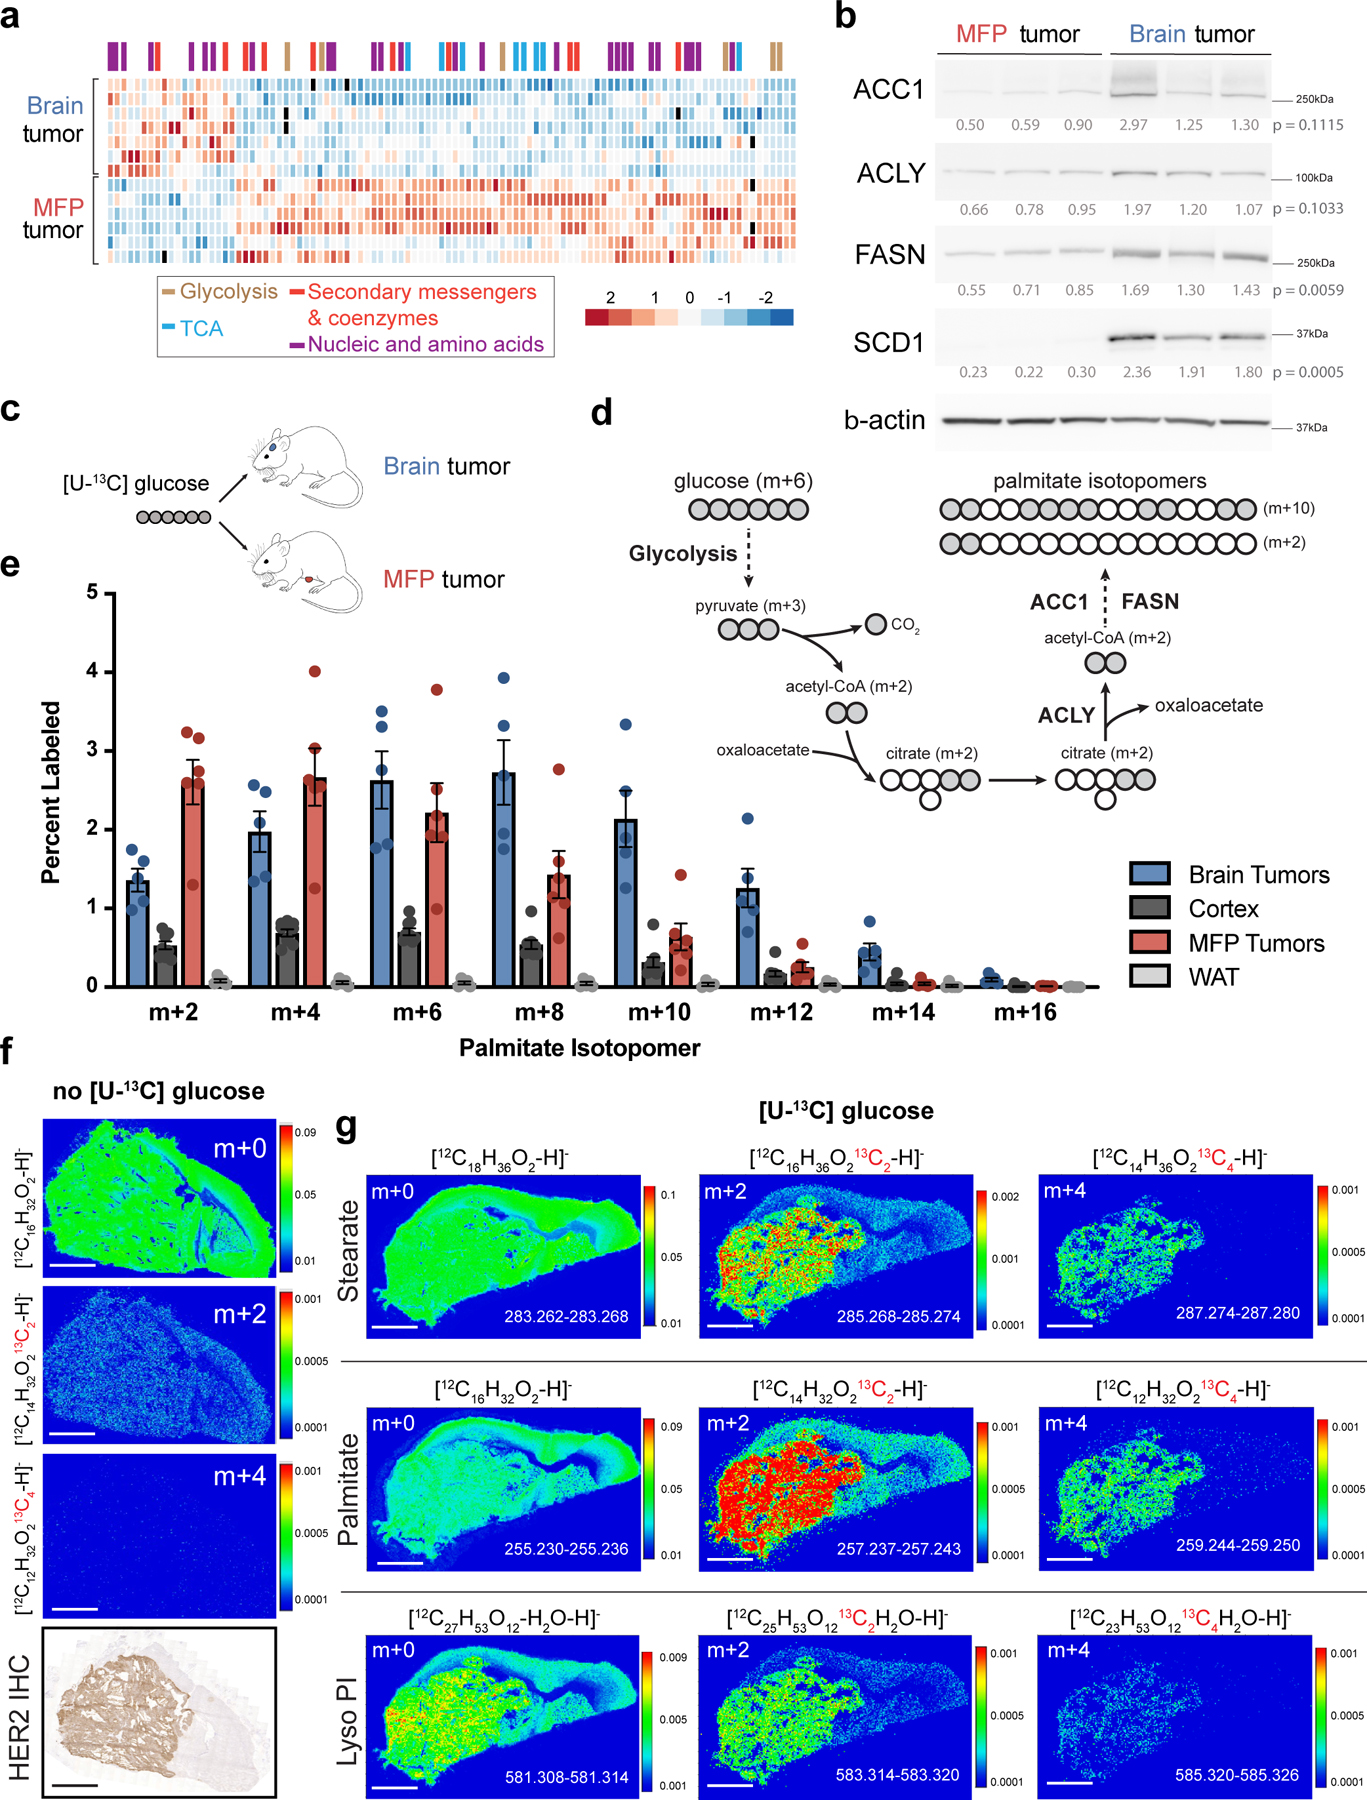
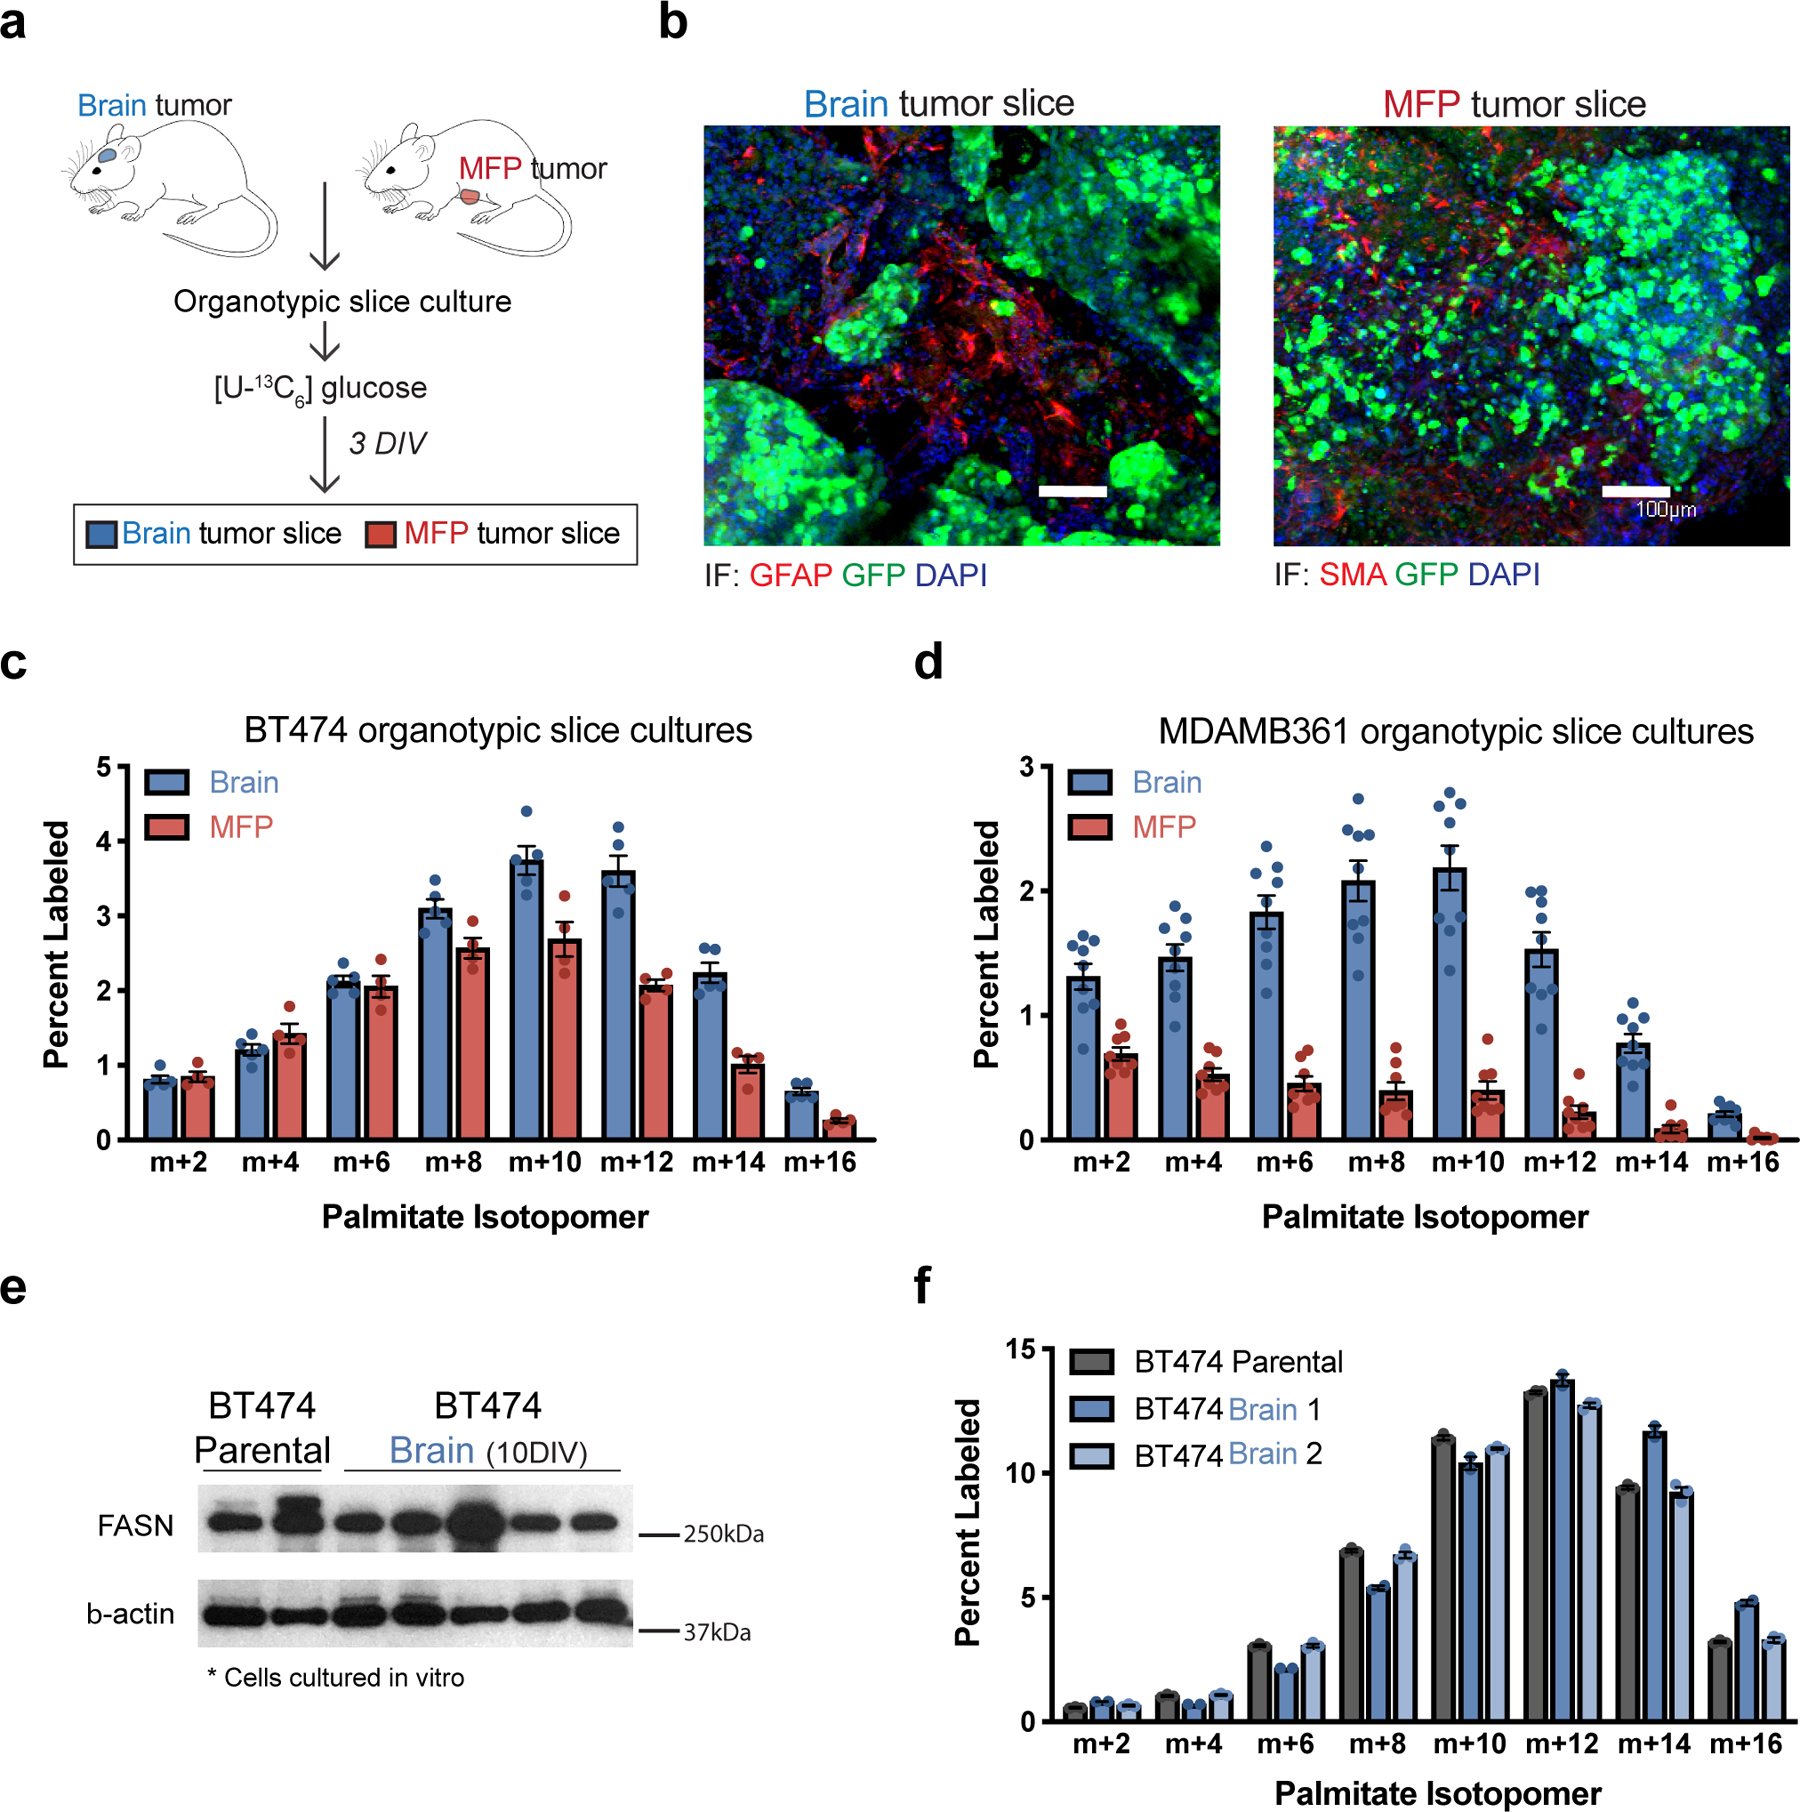
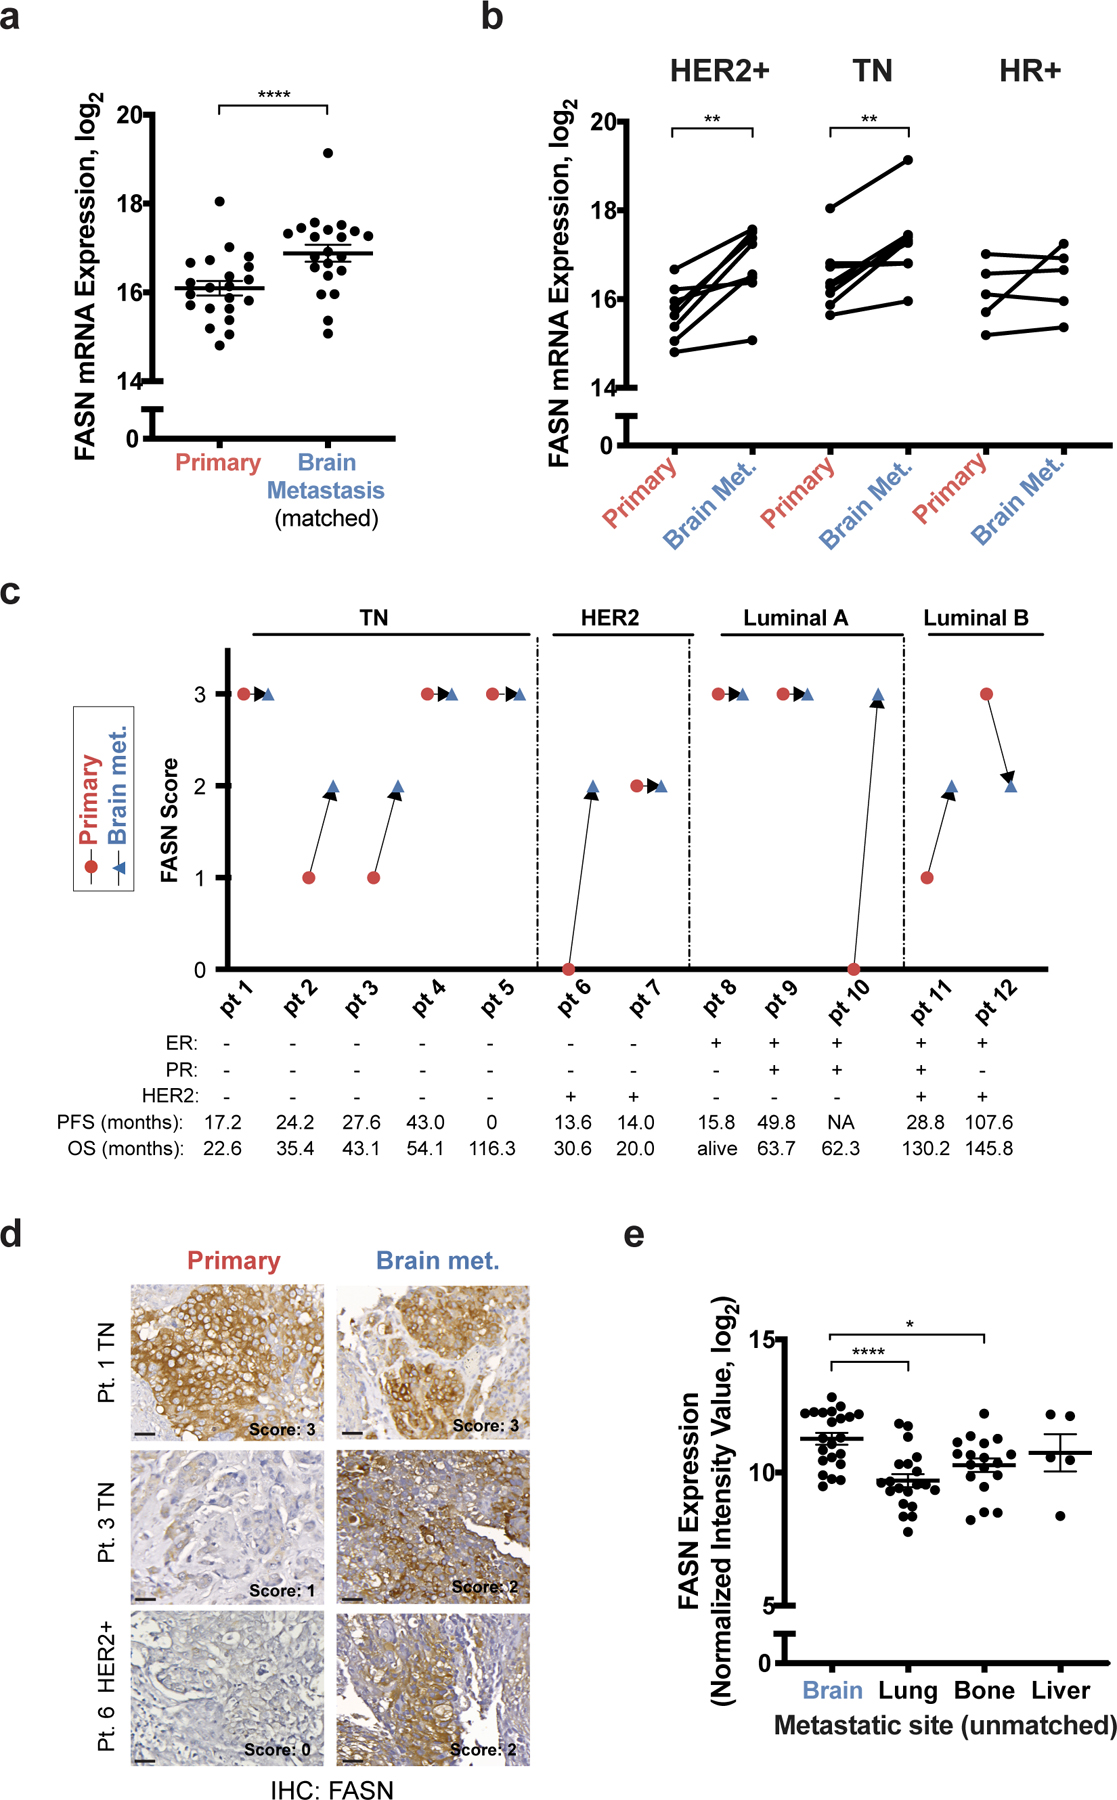
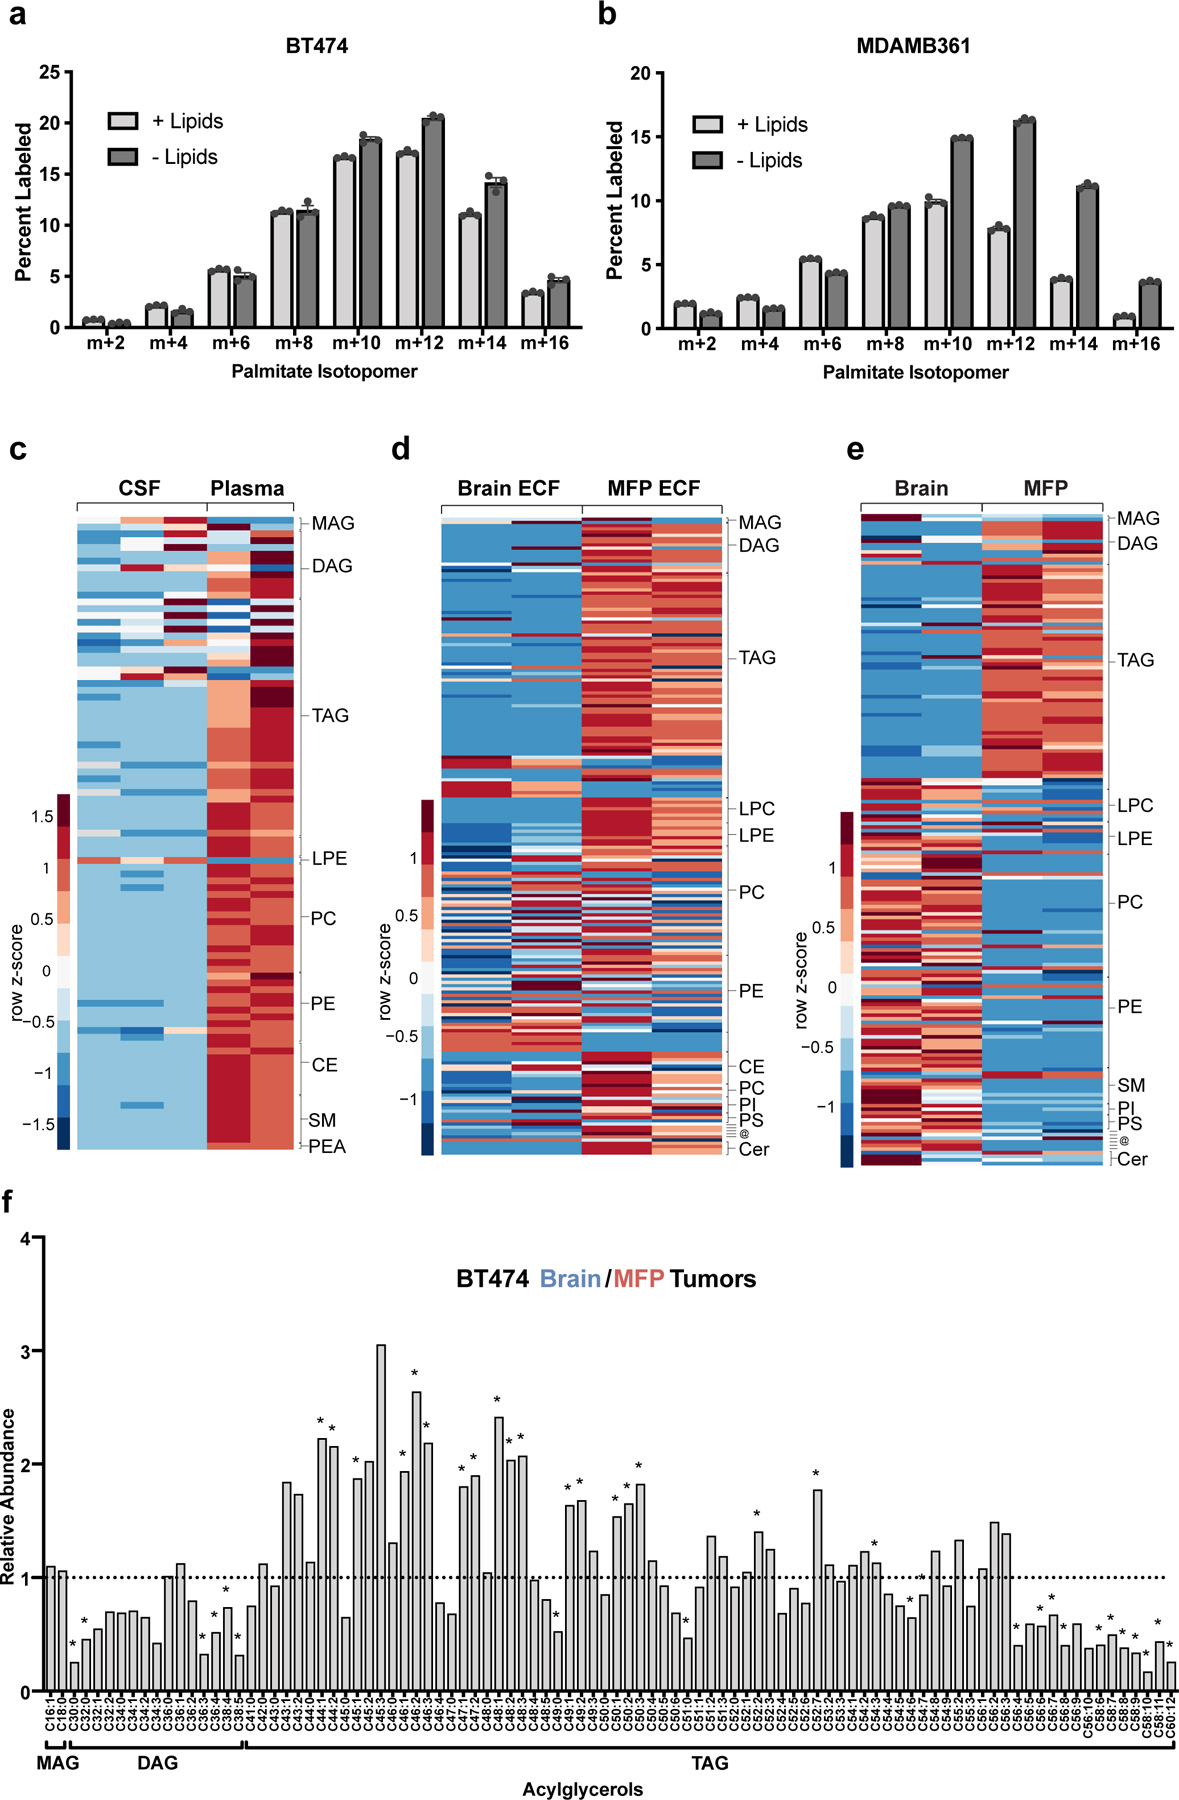
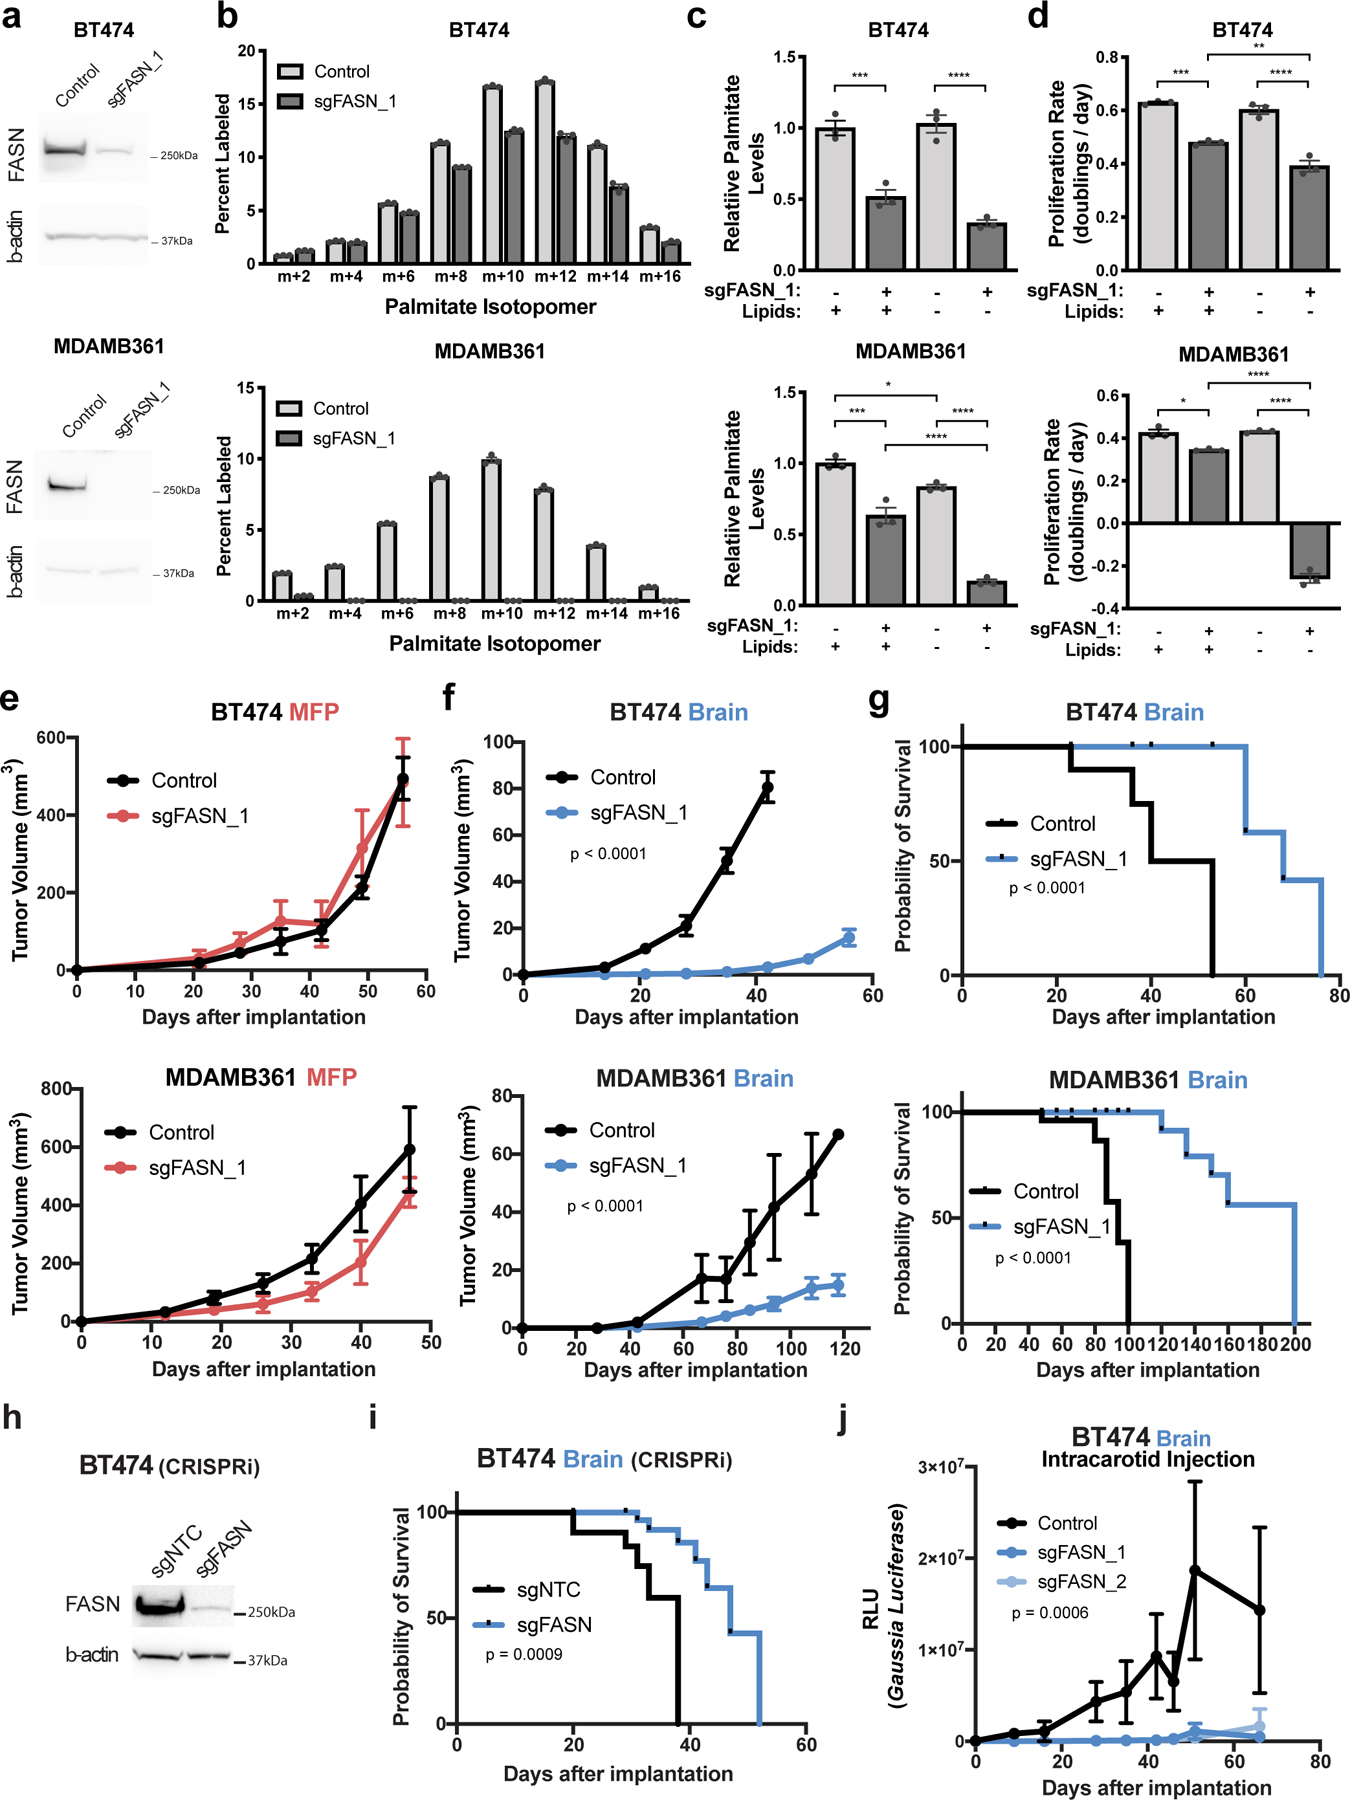
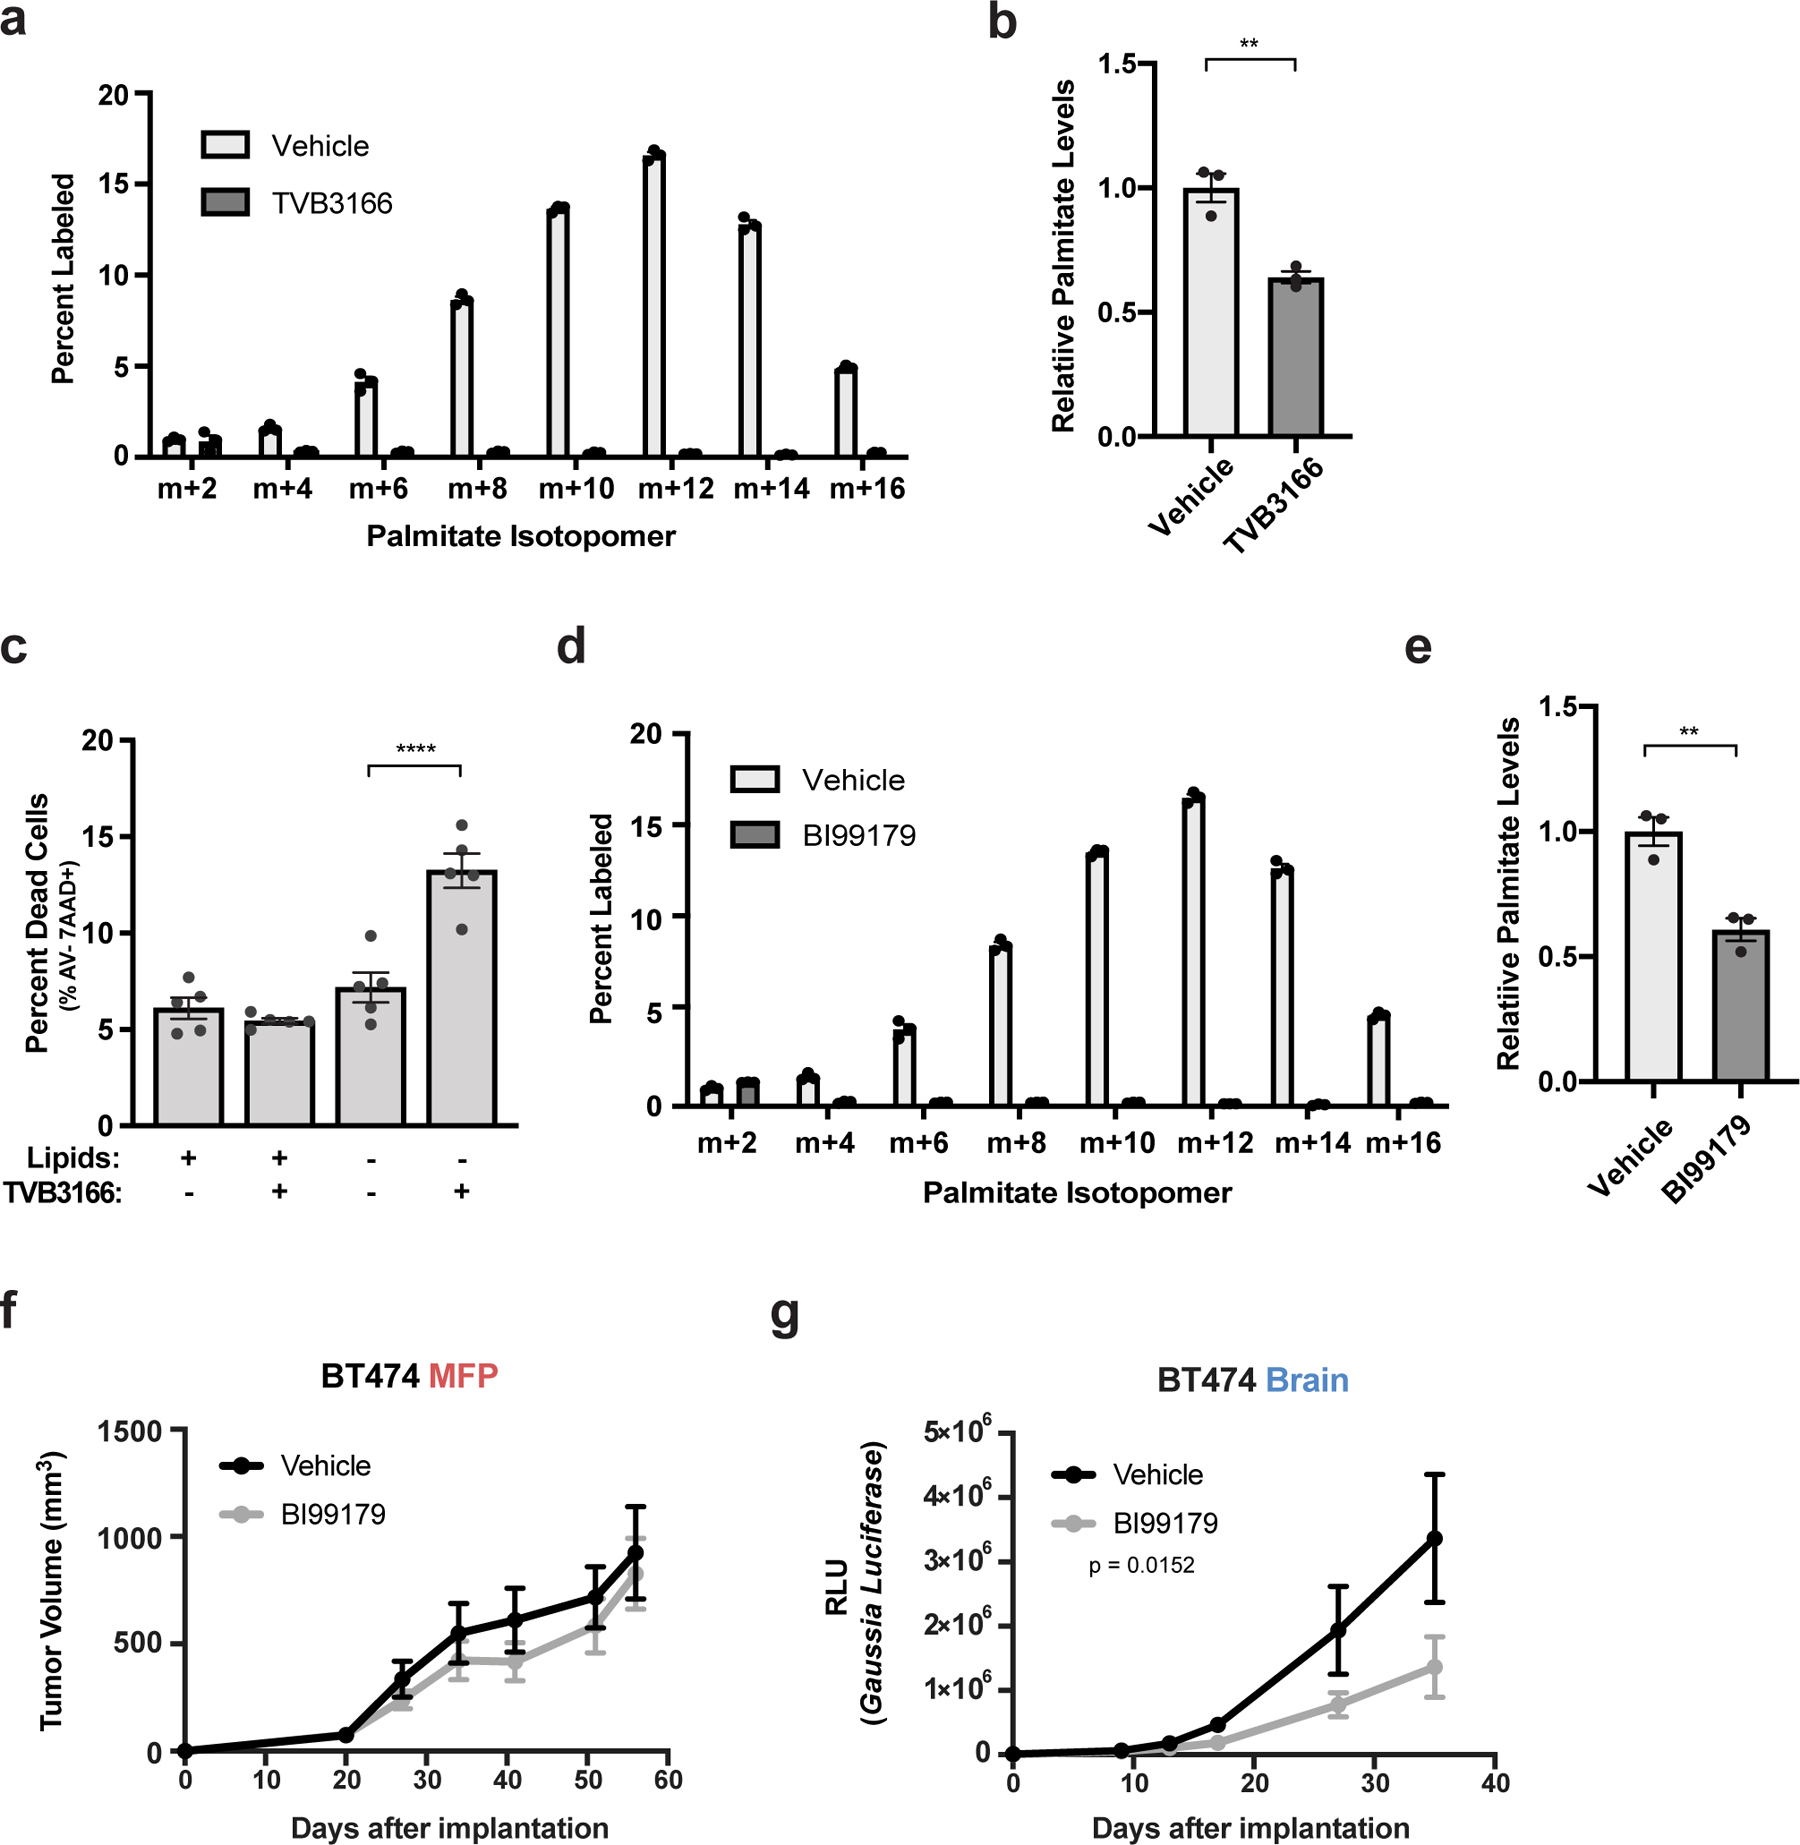
Brain metastases are refractory to therapies that control systemic disease in patients with human epidermal growth factor receptor 2 (HER2+) breast cancer, and the brain microenvironment contributes to this therapy resistance. Nutrient availability can vary across tissues, therefore metabolic adaptations required for brain metastatic breast cancer growth may introduce liabilities that can be exploited for therapy. Here, we assessed how metabolism differs between breast tumors in brain versus extracranial sites and found that fatty acid synthesis is elevated in breast tumors growing in brain. We determine that this phenotype is an adaptation to decreased lipid availability in brain relative to other tissues, resulting in a site-specific dependency on fatty acid synthesis for breast tumors growing at this site. Genetic or pharmacological inhibition of fatty acid synthase (FASN) reduces HER2+ breast tumor growth in the brain, demonstrating that differences in nutrient availability across metastatic sites can result in targetable metabolic dependencies.


Conflict of interest statement

COMPETING INTERESTS A.L. is a current employee of a Flagship Pioneering biotechnology start-up company. I.C. is a current employee of Stimit Corporation. D.G.D. received consultant fees from Bayer, Simcere and BMS and research grants from Bayer, Exelixis and BMS. L.C.C. is a founder and member of the board of directors of Agios Pharmaceuticals and is a founder and receives research support from Petra Pharmaceuticals. R.K.J received honorarium from Amgen; consultant fees from Chugai, Merck, Ophthotech, Pfizer, SPARC, SynDevRx; owns equity in Accurius, Enlight, Ophthotech, SynDevRx; and serves on the Boards of Trustees of Tekla Healthcare Investors, Tekla Life Sciences Investors, Tekla Healthcare Opportunities Fund, Tekla World Healthcare Fund. Neither any reagent nor any funding from these organizations was used in this study. M.G.V.H is a scientific advisory board member for Agios Pharmaceuticals, Aeglea Biotherapeutics, Auron Therapeutics, Faeth Therapeutics, and iTeos Therapeutics.

Figures

Extended Data Fig. 1
Extended Data Fig. 1. Histological characterization of MFP and brain BT474 tumors.
a) HER2 immunohistochemistry (IHC) of a BT474 mammary fat pad (MFP) tumor section. b) Immunofluorescence (IF) of ionized calcium binding adaptor molecule 1 (Iba1) and α-smooth muscle actin (SMA) of a consecutive tissue section from the tumor presented in (a). c) HER2 IHC of a BT474 brain tumor section. d) IF of Glial fibrillary acidic protein (GFAP) and Iba1 of a consecutive tissue section from the tumor presented in (c). For all panels, scale bar = 1 mm.
Extended Data Fig. 2
Extended Data Fig. 2. Assessment of glucose carbon fate in breast tumors growing in different tissue sites
a) Relative gamma-aminobutyric acid (GABA) levels were measured by liquid chromatography–mass spectrometry (LCMS) in BT474 tumors isolated from the brain or mammary fat pad (MFP) of Nude mice. Data are from the dataset presented in Figure 1a and Extended Data Table 1. ** p = 0.0038 by two-tailed t-test (Brain tumors, n=7; MFP tumors n=6; tumors from independent mice). b) Western blot analysis of acetyl-CoA carboxylase (ACC1), fatty acid synthase (FASN), and stearoyl-CoA desaturase-1 (SCD1) expression in MDAMB361 brain and MFP tumor tissue. β-actin expression was assessed as a loading control, and relative densitometry values (normalized to β-actin expression) were used for quantitation with values presented beneath each blot. Differences in protein expression between brain and MFP tumors was compared using a two-tailed t-test. c) The percent of fully labeled glucose (m+6) in blood plasma following a 12 hour 30 mg/kg/min 13C-glucose infusion into Nude female mice bearing BT474 lesions in the brain or in the MFP as assessed by gas chromatography–mass spectrometry (GCMS). ** p = 0.0094 by two-tailed t-test. (Plasma from mice bearing BT474 brain tumors, n=5; Plasma from mice bearing BT474 MFP tumors, n=6). d-m) The distribution of 13C-labeling in the indicated metabolites as measured by GCMS from BT474 tumors in the brain and MFP, and from noncancerous brain and MFP adipose tissue (WAT) after a 12 hour 30 mg/kg/min 13C-glucose infusion into Nude female mice. The data for each isotopologue presented was normalized to 13C-glucose labeling in plasma. (Brain tumors, n=5; MFP tumors, n=6; Cortex tissue, n=12; WAT, n=5). n, o) BT474 brain and MFP tumors were collected following a 12 hour 30 mg/kg/min 13C-glucose infusion and saponified palmitate levels (n) and the distribution of 13C-label in even isotopologues of saponified palmitate (o) were assessed by GCMS. Palmitate levels were normalized to tissue weight and compared using a two-tailed t-test (n.s. denotes not significant). Each isotopologue was normalized to 13C-glucose labeling in plasma and to palmitate total ion counts. These data are from a separate experiment as that shown in Figure 1e, and were collected to enable normalization based on palmitate total ion counts. (Brain Tumors, n=3; MFP Tumors, n=5). Data in panels a, c-o represent means ± SEM.
Extended Data Fig. 3
Extended Data Fig. 3. Higher lipid synthesis in breast cancer lesions when compared to surrounding brain tissue.
a) Negative mode matrix assisted laser desorption/ionization mass spectrometry imaging (MALDI-MSI) of brain tissue from a separate NSG mouse bearing a BT474 brain tumor than that shown in Figure 1 f,g that had been given 4 daily bolus intraperitoneal injections of 2 g/kg 13C-glucose. The spatial distribution of the indicated isotopologues of palmitate, stearate, oleate, and lyso-phosphatidylinositol (Lyso PI, 18:0) normalized to total ion counts are shown. b, c) HER2 immunohistochemistry (IHC) staining of brain tissue sections collected from the tumors analyzed by MALDI-MSI in Figure 1g (b) and in Extended Data Figure 3a (c). d) Negative mode MALDI-MSI of the m+2 palmitate isotopologue presented in (a) normalized to m+0 palmitate. For all panels, scale bar = 1 mm.
Extended Data Fig. 4
Extended Data Fig. 4. FASN expression is high in breast cancer brain metastases
a-c) ACC1, ACLY and SCD1 mRNA expression levels from a patient-matched metastatic breast cancer RNAseq dataset. Matched primary versus brain metastasis (Brain Met.) samples were analyzed separately for the major clinical molecular subtypes. * p = 0.0254 (a), *** = 0.0003 (b), **** p = 0.0005 (c), by two-tailed paired sample t-test. (Triple negative (TN) tumors, n=8; Human epidermal growth factor receptor 2+ (HER2+) tumors, n=8; Hormone receptor + (HR+) tumors, n=5). d-e) Immunohistochemistry (IHC) and immunofluorescence (IF) assessment of brain metastasis tissue sections derived from 2 different patients with HER2+ breast cancer. IHC was performed to assess HER2 and FASN expression, and IF together with DAPI staining was used to assess glial fibrillary acidic protein (GFAP) and ionized calcium binding adaptor molecule 1 (Iba1) expression on consecutive tissue sections. (scale bar = 1mm). f) Analysis of SCD1 mRNA expression from a metastatic breast cancer gene expression database comprised of unmatched human tumor samples,. Data presented represent mean expression ± SEM. * p = 0.0212 (Brain vs Bone), * p = 0.0172 (Brain vs Liver), *** p = 0.0006 by one-way ANOVA followed by Dunnettś multiple comparisons test (Brain tumors, n=22; Lung tumors, n=20; Bone tumors, n=18; Liver tumors, n=5).
Extended Data Fig. 5
Extended Data Fig. 5. Impact of extracellular lipids on lipid synthesis enzyme expression and lipid abundance
a, b) Western blot analysis of FASN, ACC1 and SCD1 in BT474 (a) and MDAMB361 cells (b) cultured in standard (+Lipids) or delipidated (-Lipids) media for 6 days. Lysates were generated from 3 independent samples. β-actin expression was assessed as a loading control. Relative densitometry values (normalized to β-actin expression) were used for quantitation and are presented below each blot. Differences in expression between conditions were compared by a two-tailed t-test. c, d) Relative levels of saponified palmitate measured by GCMS in BT474 (c) and MDAMB361 (d) cells that were cultured in standard (+Lipids) or delipidated (-Lipids) media for 72 hours. The samples analyzed are the same as those presented in Figure 5c. Palmitate levels are normalized to the standard media condition * p = 0.0307 by two-tailed t-test. The data shown represent means ± SEM (n=3 cell culture biological replicates). e, f) Ratio of complex lipid levels measured by LCMS of BT474 (e) and MDAMB361 (f) cells cultured in standard (+Lipids) or delipidated (-Lipids) media for 6 days. Lipid levels were normalized to protein content as quantified by sulforhodamine b and are presented as a ratio (−/+ Lipids) to show how levels differ based on media lipid availability. A black dotted line indicates a ratio of 1, representing no difference in lipid levels between − Lipids and + Lipids culture conditions. * q < 0.1 by Multiple t-test, False Discovery Rate corrected (n=3 cell culture biological replicates).
Extended Data Fig. 6
Extended Data Fig. 6. FASN expression is important for breast tumor growth in the brain
a) Representative ultrasound images used to assess size of BT474 and MDAMB361 brain tumors (delineated in yellow) in cranial-window bearing NSG mice. Summary data is presented in Figure 5f. (scale bar = 2 mm). b) Western blot analysis of FASN and β-actin expression in control BT474 cells and in BT474 cell clone in which FASN expression is disrupted by CRISPR/Cas9 with sgFASN_2, a different sgRNA than was used to generate the BT474 sgFASN_1 clone presented in Figure 5a–g. c, d) Growth over time of MFP (c) and brain (d) tumors generated in NSG mice from control or sgFASN_2 BT474 cells. Tumor volumes were measured by caliper or by ultrasound in cranial-window bearing mice, respectively. p values shown were determined using two-way ANOVA (Days × Group). (BT474 control MFP tumors, n=6; BT474 sgFASN_2 MFP tumors, n=4; BT474 control brain tumors, n=7; BT474 sgFASN_2, brain tumors, n=7). e) Western blot analysis of FASN and β-actin expression in control MDAMB361 lysates or in a MDAMB361 clone in which FASN expression is disrupted CRISPR/Cas9 with sgFASN_2, a different sgRNA than was used to generate the MDAMB361 sgFASN clone presented in Figure 5a–g. f) Kaplan-Meier survival curve for NSG mice bearing brain tumors produced from control or sgFASN_2 MDAMB361 cells. Median survival was 123 and 190 days for mice bearing MDAMB361 control and sgFASN_2 tumors, respectively. Hazard ratio = 7.842; 95% confidence interval = 1.314 to 46.81. (MDAMB361 control tumors, n=6; MDAMB361 sgFASN_2 tumors, n=6).
Extended Data Fig. 7
Extended Data Fig. 7. FASN expression is important for JIMT1 growth in the brain
a) Western blot analysis of FASN and β-actin expression in JIMT1 cells in which CRIPSR interference (CRISPRi) was used to disrupt FASN. Cells were transduced with an sgRNA targeting FASN (sgFASN) or a non-targeting control (sgNTC). b) Firefly luciferase-expressing sgNTC or sgFASN JIMT1 cells described in (a) were implanted into the brains of NSG mice, and tumor burden assessment by whole-body luminescence imaging is show for multiple animals on the indicated days after cell implantation in the brain (n=6 mice).
Extended Data Fig. 8
Extended Data Fig. 8. FASN knockdown alters cell lipid composition
a) The indicated acylglycerol levels measured by LCMS from control and FASN-disrupted (sgFASN_1) BT474 tumors growing in the brain of NSG mice are presented as a ratio to show how levels differ based on FASN expression. A black dotted line indicates a ratio of 1, representing no difference in lipid levels between sgFASN_1 and control BT474 tumor tissue. * q < 0.1 by Multiple t-test, False Discovery Rate corrected (n=4 brain tumors). b) Complex lipid levels measured by LCMS from control and FASN-disrupted (sgFASN_1) BT474 cells in culture (+Lipids) are presented as a ratio to show how levels differ based on FASN expression. A black dotted line indicates a ratio of 1, representing no difference in lipid levels between sgFASN_1 and control cells. Lipid levels were normalized to protein content as determined by sulforhodamine B. All comparisons are significant, q < 0.1 by Multiple t-test, False Discovery Rate corrected. (n=3 cell culture biological replicates).
Extended Data Fig. 9
Extended Data Fig. 9. FASN is not required for breast tumor growth in the liver
a) Heatmap showing complex lipid levels measured by LCMS in extracellular fluid (ECF) isolated from the MFP, brain, and liver of non-tumor bearing NSG mice. Data presented within each row were z-score normalized. The data for Brain and MFP ECF are the same as that shown in Figure 4d. (Brain ECF, n=2; MFP ECF, n=2 biological replicates. Each biological replicate represents ECF pooled from up to ~8–10 mice). b) Heatmap showing complex lipid levels measured by LCMS of MFP, brain and liver tissue from non-tumor bearing NSG mice. Data presented within each row were z-score normalized. The data for brain and MFP are the same as that shown in Figure 4e. (Brain tissue, n=2; MFP tissue, n=2; Liver Tissue, n=2). c) Western blot analysis of acetyl-CoA carboxylase (ACC1), ATP citrate lyase (ACLY), fatty acid synthase (FASN), and stearoyl-CoA desaturase-1 (SCD1) in BT474 brain and liver tumor tissue. β-actin expression was assessed as a loading control, and relative densitometry values (normalized to β-actin expression) were used for quantitation and are presented below each blot. Differences in protein expression between brain and liver BT474 lesions was compared by two-tailed t-test. d) The percent of fully labeled (m+6) glucose in blood plasma following a 12-hour 30 mg/kg/min 13C-glucose infusion into female Nude mice bearing BT474 lesions in the liver as assessed GCMS (n=5 plasma from mice bearing BT474 liver tumors). e) The distribution of pyruvate labeling in BT474 tumors growing in the liver and in non-cancerous liver tissue was measured by GCMS following a 12 hour 13C-glucose infusion into female Nude mice. Each isotopologue was normalized to 13C-glucose labeling in plasma (Liver tumor, n=6; Liver tissue, n=5). f) The distribution of 13C label in even isotopologues of palmitate derived from saponified lipids in BT474 liver tumors and in non-cancerous liver tissue following a 12 hour 13C-glucose infusion into female Nude mice was measured by GCMS and normalized 13C-glucose labeling in plasma (Liver tumor, n=6; Liver tissue, n=5). g) Tumor growth over time of liver tumors in NSG mice generated from control and FASN-disrupted (sgFASN_1) BT474 cells (presented in Figure 5a–g). Tumor volumes were measured by ultrasound. (BT474 control tumors, n=4; BT474 sgFASN_1 tumors, n=4). MAG-monoglyceride; DAG-diglyceride; TAG-triglyceride; Cer-ceramide; LPC- lysophosphatidyl-choline; LPE-lysophosphotidyethanolamine; PC-phosphatidylcholine; PE-phosphatidylethanolamine; PI-phosphatidylinositol; PS-phosphatidylserine; SM-sphingomyelin; CE-cholesteryl ester; @-sphingosine, palmitoylethanolamide, 7−Dehydrodesmosterol, cholesterol, coenzyme Q9, coenzyme Q10. Data presented in panels d, e, f and g are means ± SEM.
Extended Data Fig. 10
Extended Data Fig. 10. Lipid availability determines response to pharmacological FASN inhibition.
a-c) BT474 brain tumor-derived organotypic slice cultures were treated for 6 days with vehicle or 500 nM TVB3166 in standard (+Lipids) or delipidated (-Lipids) media. The percent of apoptotic and viable HER2 positive BT474 cells was determined by measuring Annexin V (AV) and 7-amino actinomycin D (7AAD) uptake by flow cytometry. The flow cytometry gating strategy is presented in Supplementary Figure 2. * p = 0.0111, *** p = 0.0003 by one-way ANOVA followed by Tukeýs test (n=5 BT474 brain tumor slices). d,e) Mouse weights for the cohort presented in Figure 6f,g that was treated daily with BI99179 (15mg/kg) or vehicle control by oral gavage (n=5 mice). Data presented in all panels are means ± SEM.
Figure 1.
Figure 1.. Evidence for increased fatty acid synthesis in breast cancer brain metastases.
a) Heat map of metabolite levels as measured by liquid chromatography-mass spectrometry (LCMS) from established BT474 tumors isolated from the brain or mammary fat pad (MFP) of female nude mice. Metabolites with statistically significant differences between the two tissues (p < 0.05) are presented and were allowed to self-segregate by unsupervised hierarchical clustering. The full dataset is provided in Source Data Table 1. (Brain tumors, n=7; MFP tumors, n=6; tumors from independent mice). b) Western blot analysis of acetyl-CoA carboxylase (ACC1), ATP citrate lyase (ACLY), fatty acid synthase (FASN), and stearoyl-CoA desaturase-1 (SCD1) and beta actin (β-actin) expression. Relative densitometry values (normalized to β-actin expression) were used for quantitation, and expression in brain and MFP tumor tissue was compared using a two-tailed t-test. c) Schematic for tracing fully labeled 13C-glucose fate (m+6) in mouse orthotopic brain or MFP breast tumor models. d) Schematic depicting how carbons from fully labeled 13C-glucose (indicated by grey circles) are incorporated into the fatty acid palmitate. Two representative palmitate isotopologues are depicted, as are the steps in which ACLY, ACC1 and FASN contribute to fatty acid synthesis. e) The distribution of 13C label in even isotopologues of saponified palmitate in BT474 tumors growing in the brain and MFP, in noncancerous brain (Cortex), and in noncancerous MFP adipose tissue (WAT) of nude mice was measured by gas chromatography mass spectrometry (GCMS) following a 12 hour 30 mg/kg/min 13C-glucose infusion. Isotopologues were normalized to plasma enrichment of 13C-glucose. Data presented are means ± SEM. (Brain tumor, n=5; Cortex tissue, n=9; MFP tumor, n=6; WAT, n=5). f) Negative mode matrix assisted laser desorption/ionization-mass spectrometry imaging (MALDI-MSI) of a BT474 brain tumor collected from a NSG mouse. Spatial distribution of the isotopologues palmitate, including unlabeled (m+0) and those resulting from natural abundance of 13C (m+2, m+4) normalized to total ion counts (TIC) is shown. HER2 immunohistochemistry (IHC) staining of a brain-tumor section from the same mouse is also presented. (scale bar = 1 mm). g) Negative mode MALDI-MSI of a BT474 brain tumor derived from a NSG mouse injected with 13C-glucose (4 daily bolus injection of 2 g/kg 13C-glucose). Spatial distribution of the indicated isotopologues of palmitate, stearate and lyso-phosphatidylinositol (Lyso-PI, 18:0) normalized to TIC are shown. Mass/charge (m/z) ratio is provided for each isotopologue in the bottom right of each panel. (scale bar = 1 mm).
Figure 2.
Figure 2.. The brain tumor microenvironment contributes to increased de novo lipid synthesis in breast tumors
a) Schematic workflow used for organotypic slice culture experiments. Organotypic slice cultures were prepared from breast cancer tumors isolated from mouse orthotopic brain (permitted to reach a volume of ~60 mm3) or MFP (permitted to reach a volume of ~100–120 mm3). Slices were cultured for 3 days in vitro (DIV) prior to their use in an experiment. b) Immunofluorescence (IF) staining of organotypic slice cultures prepared from breast cancer tumors isolated from orthotopic brain or MFP lesions established in NSG female mice from GFP-positive BT474 cells. Staining for α-smooth muscle actin (SMA) was performed on slices from MFP tumors, and staining for glial fibrillary acidic protein (GFAP) was performed on slices from brain tumors. DAPI staining and GFP fluorescence from tumor cells is also assessed as indicated. (scale bar = 100 μM). c, d) The percent labeling of even isotopomers of saponified palmitate measured by gas chromatography–mass spectrometry (GCMS) in organotypic slice cultures exposed to 13C-glucose for 72 hours. Organotypic slice cultures were prepared from BT474 (c) or MDAMB361 (d) brain and MFP tumors established in Nude female mice. Slices cultures analyzed were obtained from 2–3 independent tumors from different mice. (BT474 brain tumor slices, n=5; BT474 MFP tumor slices, n =4; MDAMB361 brain tumor slices, n=9; MDAMB361 MFP tumor slices, n=8). e) Western blot assessment of FASN expression in parental BT474 cells never exposed to the brain microenvironment (BT474 Parental), and in multiple independent cell line isolates from orthotopic brain BT474 tumors established in NSG mice and cultured for 10 days in vitro (BT474 Brain 10DIV). β-actin expression was also assessed as a loading control. f) The percent labeling of even isotopomers of saponified palmitate measured by GCMS from parental BT474 cells, and cell line isolates from orthotopic BT474 brain tumors described in (e), that were cultured in vitro with 13C-glucose for 48 hours. Two independent isolates (BT474 Brain 1, BT474 Brain 2) were analyzed. (n=3 cell culture biological replicates). Data in panels c, d and f represent means ± SEM.
Figure 3.
Figure 3.. FASN is expressed in breast cancer brain metastases.
a, b) FASN mRNA expression levels from a patient-matched metastatic breast cancer RNAseq database. Matched primary versus brain metastasis (Brain Met.) samples were analyzed with the major clinical molecular subtypes combined (a) or separated (b). **** p < 0.0001 (a), ** p = 0.0034 (HER2+, b) and ** p = 0.0057 (TN, b) by two-tailed paired sample t-test. (Human epidermal growth factor receptor 2+ tumors (HER2+), n=8; Triple negative (TN) tumors, n=8; Hormone receptor + (HR+) tumors, n=5). c, d) Immunohistochemistry (IHC) analysis of FASN expression from formalin-fixed paraffin-embedded tissue sections of patient-matched biopsies of primary tumor and brain metastasis (Brain met.). FASN immunohistochemistry score (0=low, 3=high) observed in breast tumor sections from patient-matched samples grouped by clinical molecular subtype are shown in (c). Receptor status, progression free survival (PFS) and overall survival (OS) are indicated for each patient (Pt.) sample. Representative images and the corresponding FASN score are shown from patients with TN (Pt. 1 and 3) and HER2+ (Pt. 6) breast tumors are shown in (d). Estrogen Receptor (ER), Progesterone Receptor (PR). (scale bar = 300 μm). e) Analysis of FASN mRNA expression from an unmatched metastatic breast cancer gene expression database,. * p = 0.0179, **** p < 0.0001 by one-way ANOVA followed by Dunnettś multiple comparisons test. (Brain tumors, n=22; Lung tumors, n=20; Bone tumors, n=18; Liver tumors, n=5). Data presented in panels a and e are means ± SEM.
Figure 4.
Figure 4.. Low levels of lipids are available to breast cancer cells in the brain microenvironment.
a, b) The percent labeling of even isotopologues of saponified palmitate as measured by GCMS in BT474 cells or MDAMB361 cells cultured in standard (+Lipids) or delipidated (-Lipids) media for 72 hours with 13C-glucose as indicated. Data presented are means ± SEM. (n=3 cell culture biological replicates). c) Complex lipid levels in cerebrospinal fluid (CSF) and plasma from non-tumor bearing NSG mice measured by LCMS. Scaled values of each lipid species measured from five times the volume of CSF compared to plasma are presented as a heatmap with classes of lipid species grouped as indicated on the right of the heatmap. Data presented within each row were z-score normalized. (CSF, n=3; Plasma, n=2. Each biological replicate is from 2–3 pooled mice.). d) Complex lipid levels in extracellular fluid (ECF) isolated from the mammary fat pad (MFP) and brain of non-tumor bearing NSG mice measured by LCMS. Scaled values of each lipid species measured are presented as a heatmap for each fluid with classes of lipid species grouped as indicated on the right of the heatmap. Data presented within each row were z-score normalized. (Brain ECF, n=2; MFP ECF, n=2 biological replicates. (Each biological replicate represents ECF pooled from up to ~8–10 mice.). e) Complex lipid levels measured by LCMS in mammary fat pad (MFP), and brain tissue from non-tumor bearing NSG mice. Scaled values of each lipid species measured are presented as a heatmap for each tissue with classes of lipid species grouped as indicated on the right of the heatmap. Data presented within each row were z-score normalized. (Brain tissue, n=2; MFP tissue, n=2) f) Levels of monoacylglyceride (MAG), diacylglyceride (DAG) and triacylglyceride (TAG) species were measured by LCMS from BT474 brain and MFP tumors collected from NSG mice and are presented as a ratio to show how levels differ based on tumor site. A black dotted line indicates a ratio of 1, representing no difference in lipid levels between BT474 brain and MFP tumors. *q < 0.1 by multiple t-test, False Discovery Rate corrected. (Brain tumors, n=3; MFP tumors, n=4). Lipids: MAG- monoglyceride; DAG-diglyceride; TAG-triglyceride; LPC-lysophosphatidyl-choline; LPE-lysophosphotidyethanolamine; PC-phosphatidylcholine; PE-phosphatidylethanolamine; PI-phosphatidylinositol; PS-phosphatidylserine; SM-sphingomyelin; CE–cholesteryl ester; @-(top to bottom line) sphingosine, palmitoylethanolamide, 7−Dehydrodesmosterol, cholesterol, coenzyme Q9, coenzyme Q10; Cer-ceramide; PEA- Palmitoylethanolamide.
Figure 5.
Figure 5.. FASN is required for breast tumor growth in the brain.
a) Western blot analysis of FASN and β-actin protein expression in BT474 and MDAMB361 lysates from control cells or in a clone in which FASN is disrupted with CRISPR/Cas9 (sgFASN_1). b) The percent labeling of even isotopologues of saponified palmitate from control or sgFASN_1 BT474 and MDAMB361 cells cultured in standard media for 72 hours with 13C-glucose as measured by GCMS. The data for control BT474 and MDAMB361 cells are the same as that presented in Figure 4a,b. (n=3 cell culture biological replicates). c) Relative levels of saponified palmitate measured from control or sgFASN_1 BT474 and MDAMB361 cells cultured in standard (+Lipids) or delipidated (-Lipids) media for 72 hours. Palmitate levels are normalized to the control standard media condition. BT474, *** p = 0.0004, **** p < 0.0001; MDAMB361, * p = 0.0307, *** p = 0.0002, **** p < 0.0001; by one-way ANOVA followed by Tukeýs multiple comparisons test. (n=3 cell culture biological replicates). d) Proliferation rate of control or sgFASN_1 BT474 and MDAMB361 cells cultured in standard (+Lipids) or delipidated (-Lipids) media for 6 days. BT474, ** p = 0.0071, *** p = 0.0002, **** p < 0.0001; MDAMB361, * p = 0.0126, *** p = 0.0002, **** p < 0.0001; by one-way ANOVA followed by Tukeýs multiple comparisons test. (n=3 cell culture biological replicates). e) Growth over time of MFP tumors generated from control or sgFASN_1 BT474 and MDAMB361 cells in NSG mice as indicated. Tumor volumes were measured by caliper. Growth difference was not significant by two-way ANOVA (Days × Group) for BT474 or MDAMB361. (BT474 control, n=5; BT474 sgFASN_1 tumors; n=5; MDAMB361 control tumors, n=5; MDAMB361 sgFASN_1 tumors, n=5). f) Growth over time of brain tumors generated from control or sgFASN_1 BT474 and MDAMB361 cells in NSG mice as indicated. Tumor volumes were measured by ultrasound in cranial-window bearing mice. p < 0.0001 by two-way ANOVA (Days × Group) for BT474 and MDAMB361 respectively. (BT474 control tumors, n=7; BT474 sgFASN_1 tumors; n=7, MDAMB361 control, n=6; MDAMB361 sgFASN_1 tumors, n=8). g) Kaplan-Meier survival curve for NSG mice bearing control or sgFASN_1 BT474 and sgFASN_MDAMB361 brain tumors from the experiment presented in (f). Median survival for mice bearing BT474 tumors was 46.5 days for control and 68 days for sgFASN_1 groups (hazard ratio = 9.721; 95% confidence interval = 0.8265 to 114.3; p < 0.0001). Median survival for mice bearing MDAMB361 tumors was 94 days for control and 200 days for sgFASN_1 groups (hazard ratio = 13.62, 95% confidence interval = 1.292 to 144.6, p < 0.0001). (BT474 control tumors, n=5; BT474 sgFASN_1 tumors, n=5; MDAMB361 control tumors, n=6; MDAMB361 sgFASN_1 tumors, n=8). h) Western blot analysis of FASN and β-actin expression in BT474 cells in which CRIPSR interference (CRISPRi) was used to suppress FASN expression. Cells were transduced with sgRNA targeting FASN (sgFASN) or a non-targeting control (sgNTC). i) Kaplan-Meier survival curve for NSG mice bearing brain tumors produced from the cells described in (h). Median survival was 38 and 47 days for mice bearing BT474 sgNTC and sgFASN tumors, respectively. Hazard ratio = 5.433; 95% confidence interval = 1.280 to 23.06. (BT474 sgNTC tumors, n=7; BT474 sgFASN tumors, n=7). j) Tumor growth after intracarotid injection of BT474 control cells, or two independently derived BT474 cell clones in which FASN had been disrupted by CRISPR/Cas9 (sgFASN_1 cells are presented in panels Figure 5a–g and sgFASN_2 cells are presented in Extended Data Figure 6b–d). In all cases, cells had been previously engineered to express secreted Gaussia luciferase, allowing tumor growth in the brain to be assessed by measurement of blood luciferase,. p = 0.0006 by two-way ANOVA (Days × Groups [Control, sgFASN_1, sgFASN_2]). (BT474 control tumors, n=7; BT474 sgFASN_1 tumors, n=7; BT474 sgFASN_2 tumors, n=6). Data presented in panels b, c, d, e, f, and j are means ± SEM.
Figure 6.
Figure 6.. Lipid availability determines response to pharmacological FASN inhibition.
a) The percent labeling of even isotopologues of saponified palmitate as measured by GCMS from BT474 cells cultured in vitro for 72 hours with 13C-glucose and DMSO or 1 μM TVB3166. (n=3 cell culture biological replicates). b) Relative levels of saponified palmitate measured by GCMS from BT474 cells cultured for 72 hours with DMSO or 500 nM TVB3166 as indicated. Palmitate levels are normalized to the vehicle-treated condition. ** p = 0.0042 by two-tailed unpaired t-test (n=3 cell culture biological replicates). c) BT474 brain tumor-derived organotypic slice cultures were treated for 6 days with vehicle or 500 nM TVB3166 in standard (+Lipids) or delipidated (-Lipids) media. The percent of apoptotic and viable HER2 positive BT474 cells was determined by measuring Annexin V (AV) and 7-amino actinomycin D (7AAD) uptake by flow cytometry. The flow cytometry gating strategy is presented in Supplementary Figure 2. **** p < 0.0001 by one-way ANOVA followed by Tukeýs test (n=5 BT474 brain tumor slices). d) The percent labeling of even isotopologues of saponified palmitate as measured by GCMS from BT474 cells cultured in vitro for 72 hours with 13C-glucose and DMSO or 1 μM BI99179. The vehicle control samples are the same as those presented in (a) (n=3 cell culture biological replicates). e) Relative levels of saponified palmitate measured by GCMS from BT474 cells cultured in vitro for 72 hours with DMSO or 1 μM BI99179. Palmitate levels are normalized to the vehicle-treated condition. ** p = 0.0055 by two-tailed unpaired t-test. The vehicle control samples are the same as those presented in (b). (n=3 cell culture biological replicates). f, g) Growth over time of BT474 MFP (f) or brain tumors (g) in NSG mice treated daily with vehicle or BI99179 (15 mg/kg). Tumor volumes were measured by caliper (MFP) or secreted Gaussia luciferase (Brain). MFP, not significant; Brain, p = 0.0152 by two-way ANOVA (Days × Group). (MFP vehicle tumors, n=5; MFP BI99179 tumors, n=7; Brain vehicle tumors, n=5; Brain BI99179 tumors, n=5). Data presented in all panels are means ± SEM.

Comment in

References

    1. Mills MN et al. Management of brain metastases in breast cancer: a review of current practices and emerging treatments. Breast Cancer Res Treat 180, 279–300, 10.1007/s10549-020-05552-2 (2020). - DOI - PubMed
    1. Boire A, Brastianos PK, Garzia L & Valiente M Brain metastasis. Nat Rev Cancer 20, 4–11, 10.1038/s41568-019-0220-y (2020). - DOI - PubMed
    1. Kabraji S et al. Drug Resistance in HER2-Positive Breast Cancer Brain Metastases: Blame the Barrier or the Brain? Clin Cancer Res 24, 1795–1804, 10.1158/1078-0432.CCR-17-3351 (2018). - DOI - PMC - PubMed
    1. Arvanitis CD, Ferraro GB & Jain RK The blood-brain barrier and blood-tumour barrier in brain tumours and metastases. Nat Rev Cancer, 10.1038/s41568-019-0205-x (2019). - DOI - PMC - PubMed
    1. Achrol AS et al. Brain metastases. Nat Rev Dis Primers 5, 5, 10.1038/s41572-018-0055-y (2019). - DOI - PubMed

Publication types