

Genetic Susceptibility Loci in Genomewide Association Study of Cluster Headache
- PMID: 34180076
- PMCID: PMC8362054
- DOI: 10.1002/ana.26146
Genetic Susceptibility Loci in Genomewide Association Study of Cluster Headache
Abstract
Objective: Identifying common genetic variants that confer genetic risk for cluster headache.
Methods: We conducted a case-control study in the Dutch Leiden University Cluster headache neuro-Analysis program (LUCA) study population (n = 840) and unselected controls from the Netherlands Epidemiology of Obesity Study (NEO; n = 1,457). Replication was performed in a Norwegian sample of 144 cases from the Trondheim Cluster headache sample and 1,800 controls from the Nord-Trøndelag Health Survey (HUNT). Gene set and tissue enrichment analyses, blood cell-derived RNA-sequencing of genes around the risk loci and linkage disequilibrium score regression were part of the downstream analyses.
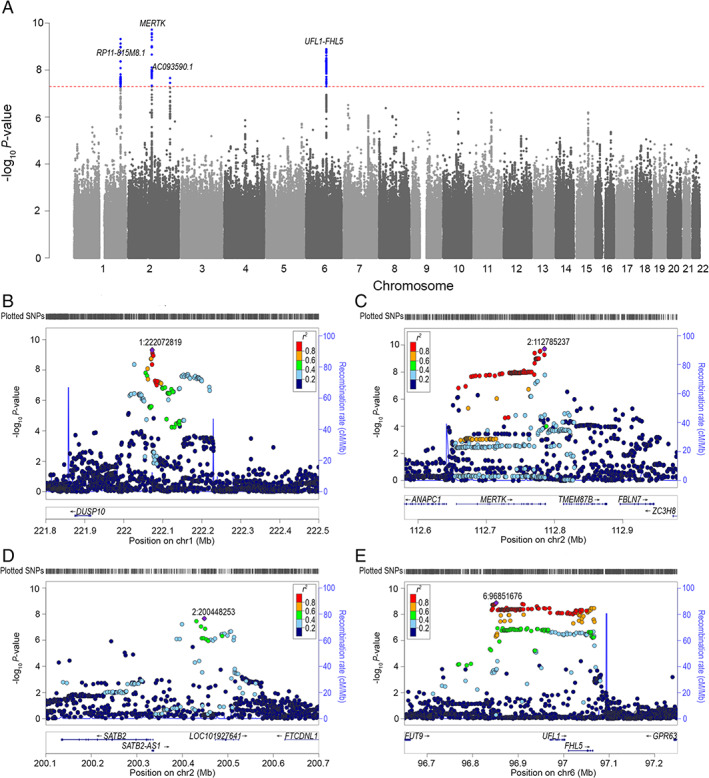
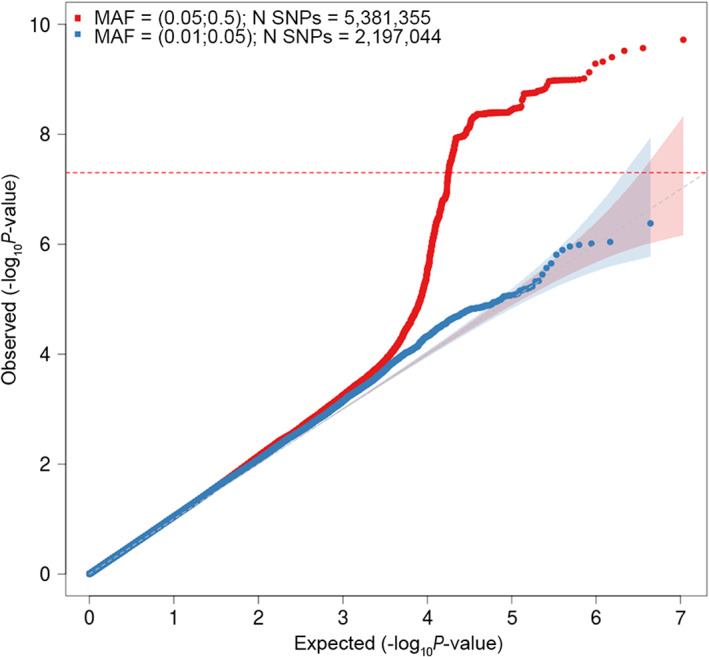
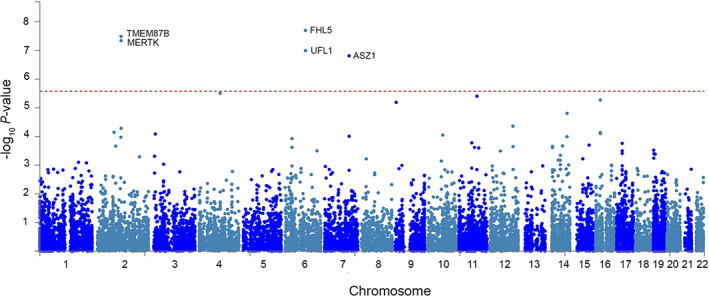
Results: An association was found with cluster headache for 4 independent loci (r2 < 0.1) with genomewide significance (p < 5 × 10⁻⁸ ), rs11579212 (odds ratio [OR] = 1.51, 95% confidence interval [CI] = 1.33-1.72 near RP11-815 M8.1), rs6541998 (OR = 1.53, 95% CI = 1.37-1.74 near MERTK), rs10184573 (OR = 1.43, 95% CI = 1.26-1.61 near AC093590.1), and rs2499799 (OR = 0.62, 95% CI = 0.54-0.73 near UFL1/FHL5), collectively explaining 7.2% of the variance of cluster headache. SNPs rs11579212, rs10184573, and rs976357, as proxy SNP for rs2499799 (r2 = 1.0), replicated in the Norwegian sample (p < 0.05). Gene-based mapping yielded ASZ1 as possible fifth locus. RNA-sequencing indicated differential expression of POLR1B and TMEM87B in cluster headache patients.
Interpretation: This genomewide association study (GWAS) identified and replicated genetic risk loci for cluster headache with effect sizes larger than those typically seen in complex genetic disorders. ANN NEUROL 2021;90:203-216.
© 2021 The Authors. Annals of Neurology published by Wiley Periodicals LLC on behalf of American Neurological Association.
Conflict of interest statement
The authors declared no conflict of interest.
Figures
Comment in
-
Genetics of Cluster Headache Takes a Leap.Ann Neurol. 2021 Aug;90(2):191-192. doi: 10.1002/ana.26159. Epub 2021 Jul 20. Ann Neurol. 2021. PMID: 34240440 No abstract available.
References
-
- Lund N, Barloese M, Petersen A, et al. Chronobiology differs between men and women with cluster headache, clinical phenotype does not. Neurology 2017;88:1069–1076. - PubMed
-
- Lund N, Petersen A, Snoer A, et al. Cluster headache is associated with unhealthy lifestyle and lifestyle‐related comorbid diseases: results from the Danish cluster headache survey. Cephalalgia 2019;39:254–263. - PubMed
-
- Headache classification Committee of the International Headache Society (IHS) the international classification of headache disorders, 3rd edition. Cephalalgia 2018;38:1–211. - PubMed
Publication types
MeSH terms
LinkOut - more resources
Full Text Sources
Miscellaneous
