Clinical Trial
. 2021 Sep;8(17):e2101222.
doi: 10.1002/advs.202101222. Epub 2021 Jun 28.

Combined Metabolic Activators Accelerates Recovery in Mild-to-Moderate COVID-19

Affiliations
Clinical Trial

Combined Metabolic Activators Accelerates Recovery in Mild-to-Moderate COVID-19

Ozlem Altay et al. Adv Sci (Weinh). 2021 Sep.

Abstract

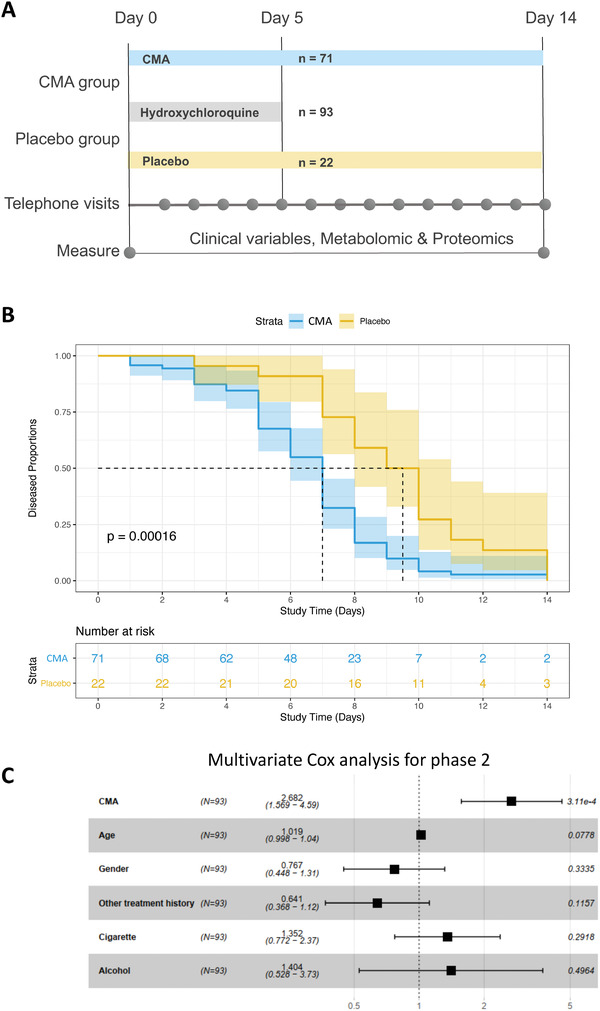
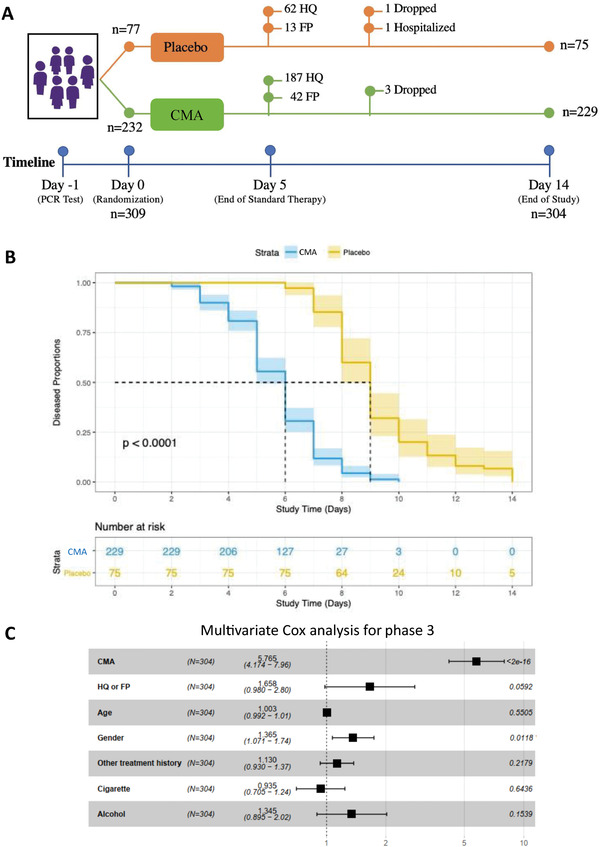
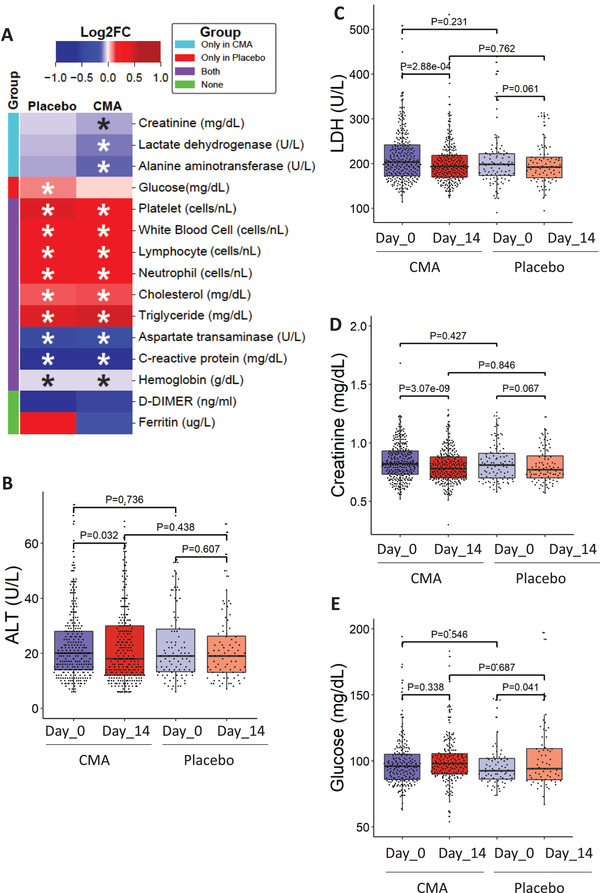
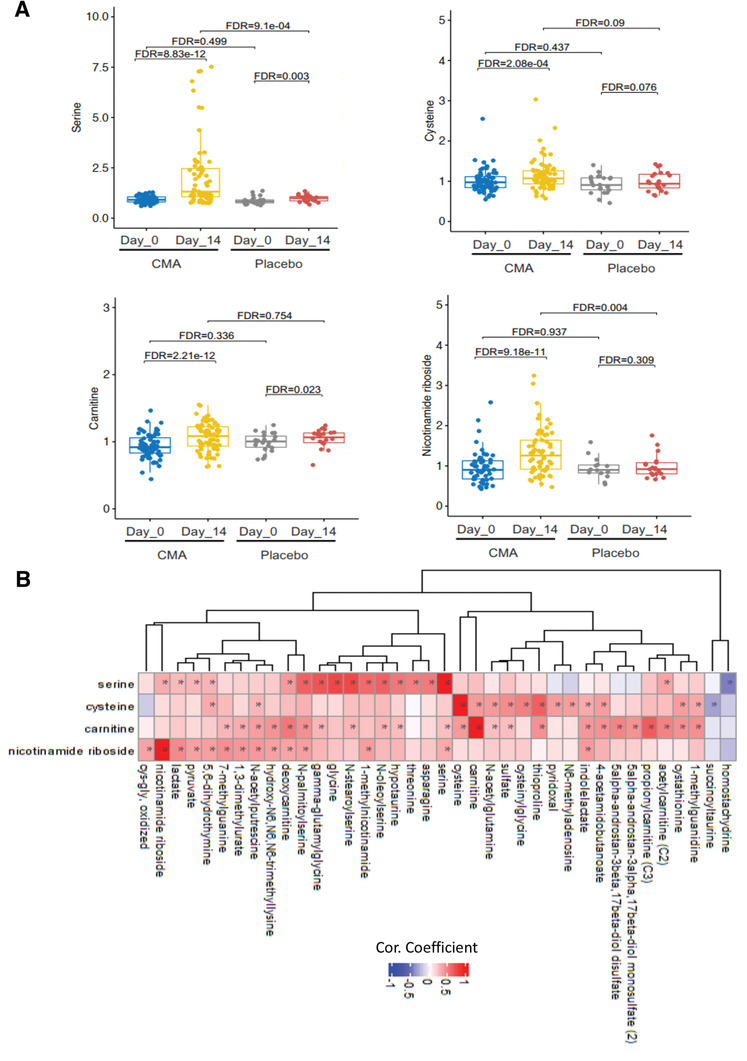
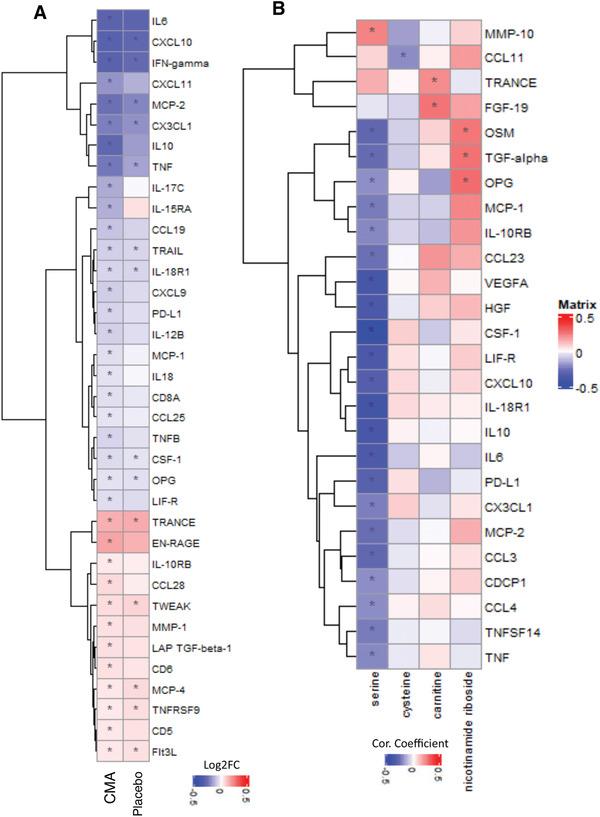
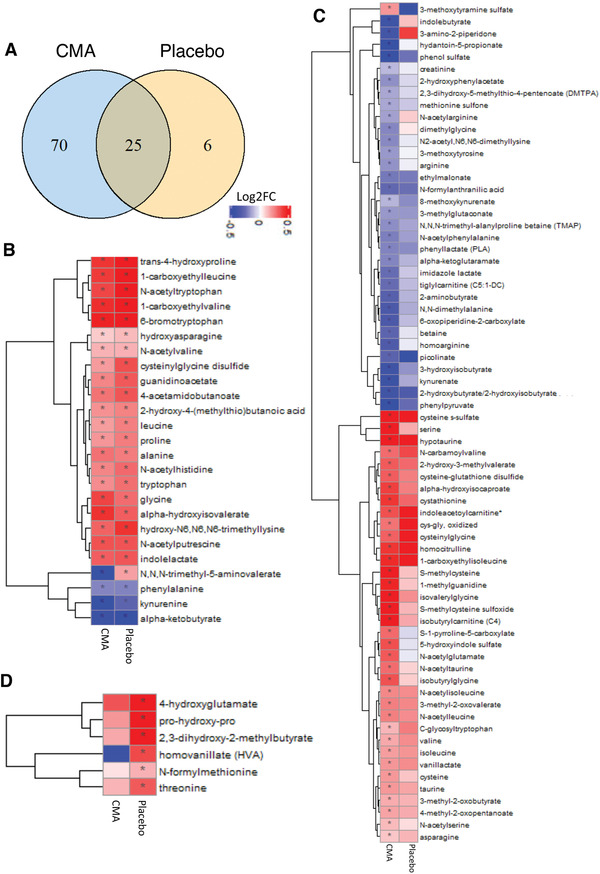
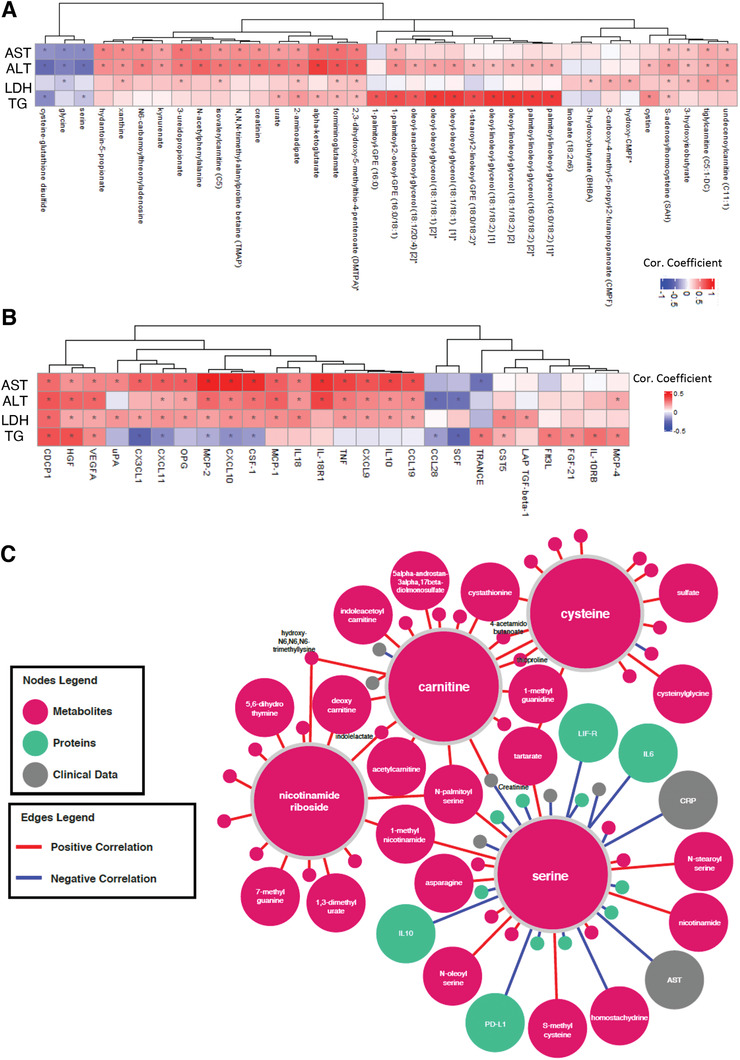
COVID-19 is associated with mitochondrial dysfunction and metabolic abnormalities, including the deficiencies in nicotinamide adenine dinucleotide (NAD+ ) and glutathione metabolism. Here it is investigated if administration of a mixture of combined metabolic activators (CMAs) consisting of glutathione and NAD+ precursors can restore metabolic function and thus aid the recovery of COVID-19 patients. CMAs include l-serine, N-acetyl-l-cysteine, nicotinamide riboside, and l-carnitine tartrate, salt form of l-carnitine. Placebo-controlled, open-label phase 2 study and double-blinded phase 3 clinical trials are conducted to investigate the time of symptom-free recovery on ambulatory patients using CMAs. The results of both studies show that the time to complete recovery is significantly shorter in the CMA group (6.6 vs 9.3 d) in phase 2 and (5.7 vs 9.2 d) in phase 3 trials compared to placebo group. A comprehensive analysis of the plasma metabolome and proteome reveals major metabolic changes. Plasma levels of proteins and metabolites associated with inflammation and antioxidant metabolism are significantly improved in patients treated with CMAs as compared to placebo. The results show that treating patients infected with COVID-19 with CMAs lead to a more rapid symptom-free recovery, suggesting a role for such a therapeutic regime in the treatment of infections leading to respiratory problems.

Keywords: COVID-19; combined metabolic activators; metabolomics; omics data; proteomics.


Conflict of interest statement

A.M., J.B., and M.U. are the founders and shareholders of ScandiBio Therapeutics and they filed a patent application on the use of CMA to treat COVID‐19 patients. The other authors declare no competing interests.

Figures

Figure 1
Figure 1
The effect of CMA on the symptoms of COVID‐19 patients in phase‐2 clinical trial. A) The effect of the CMA in 93 COVID‐19 patients is tested in a randomized, controlled, open‐label, placebo‐controlled phase 2 clinical study. Study design for testing the effect of CMA is presented. B) Based on Kaplan–Meier analysis, it is shown that CMA accelerates the recovery of the COVID‐19 patients. Number of patients reporting COVID‐19 symptoms are reported in the Table S2 (Supporting Information). C) Multivariate Cox regression analysis of CMA treatment in phase‐2 clinical trial.
Figure 2
Figure 2
The effect of CMA on the symptoms of COVID‐19 patients in phase‐3 clinical trial. A) The effect of the CMA in 304 COVID‐19 patients is tested in a randomized, controlled, double‐blinded, placebo‐controlled phase 3 clinical study. Study design for testing the effect of CMA is presented. B) Based on Kaplan–Meier analysis, it is shown that CMA accelerates the recovery of the COVID‐19 patients. Number of patients reporting COVID‐19 symptoms are reported in the Table S2 (Supporting Information). C) Multivariate Cox regression analysis of CMA treatment in phase‐3 clinical trial.
Figure 3
Figure 3
The effect of the CMA on clinical variables. A) Heatmap shows log2FC based alterations of the clinical variables, which are compared before and after the administration of CMA in both active and placebo groups. Asterisks indicate statistical significance based on Student's t‐test. P value <0.05. The level of clinical variables including B) ALT, C) LDH, D) creatinine, and E) glucose is presented in the CMA and placebo groups in all 397 patients involved in Phase 2 and Phase 3 clinical trials. These clinical parameters are significantly improved due to the administration of CMA after 14 d. The decrease in the recovery of the patients has been supported by the improvement in clinical variables and the metabolic health status of the patients.
Figure 4
Figure 4
CMA alters the global metabolism of the patients. A) The plasma level of individual metabolic activators including serine, carnitine, nicotinamide riboside, and cysteine as well as B) their association with the 10 most significantly correlated plasma metabolites are presented using the plasma samples obtained from 93 patients in Phase 2 clinical trial. Asterisks indicate statistical significance based on Spearman correlation analysis. FDR value <0.01.
Figure 5
Figure 5
CMA affects the plasma level of inflammation related proteins. Association between inflammation related proteins that are significantly different between the CMA and placebo groups on Days 0 and Day 14 using the plasma samples obtained from 93 patients in Phase 2 clinical trial. A) Heatmap shows log2FC based alterations and clustering between significant proteins on Day 14 versus Day 0 in the CMA and placebo groups. Asterisks indicate statistical significance based on paired Student's t test. FDR value: < 0.01. B) Heatmap shows the correlation and clustering between the plasma level all inflammation related proteins and plasma levels of the individual constituents of CMA (including serine, carnitine, nicotinamide riboside, and cysteine). Asterisks indicate statistical significance based on Spearman correlation analysis. p value: < 0.05. Log2FC: log2(fold change).
Figure 6
Figure 6
CMA affects the plasma level of amino acids and improves metabolic health. Plasma level of amino acids that are significantly different on Days 14 versus Day 0 in the CMA and placebo groups using the plasma samples obtained from 93 patients in Phase 2 clinical trial. A) Venn‐diagram representing the number of identified amino acids that are significantly different on Days 14 versus Day 0 in the CMA and placebo groups. The intersection represents amino acids that were altered in both groups. Statistical significance based on paired Student's t test. FDR value: < 0.001. Association between the plasma level of significantly different amino acids B) in both groups (n = 25); C) only in CMA group (n = 70), and D) only in placebo group (n = 6) on Day 14 versus Day 0. Heatmap shows log2FC based alterations in the amino acids and asterisks indicate statistical significance based on paired Student's t test. FDR value: < 0.001. Log2FC, log2(fold change).
Figure 7
Figure 7
Integrated network analysis for revealing the effect of CMA on patients. Association between the plasma level of clinical variables including ALT, AST, LDH, TGs, and hemoglobin with plasma level of all inflammation related proteins. Heatmap shows log2FC based alterations and clustering between the plasma level of clinical variables including ALT, AST, LDH, TG, and hemoglobin with plasma level of A) all metabolites and B) all inflammation related proteins. Asterisks indicate statistical significance based on paired Student's t test. p value: < 0.05. Log2FC, log2(fold change); AST, Aspartate aminotransferase; ALT, Alanine transaminase; LDH, Lactate dehydrogenase; TGs, Triglycerides. C) Neighbors of the metabolic activators including serine, carnitine, nicotinamide riboside, and cysteine based on the multiomics network analysis. Only analytes that are significantly altered in CMA Day 14 versus Day 0 are highlighted. Full networks can be found in iNetModels (http://inetmodels.com).

References

    1. Gupta A., Madhavan M. V., Sehgal K., Nair N., Mahajan S., Sehrawat T. S., Bikdeli B., Ahluwalia N., Ausiello J. C., Wan E. Y., Freedberg D. E., Kirtane A. J., Parikh S. A., Maurer M. S., Nordvig A. S., Accili D., Bathon J. M., Mohan S., Bauer K. A., Leon M. B., Krumholz H. M., Uriel N., Mehra M. R., Elkind M. S. V., Stone G. W., Schwartz A., Ho D. D., Bilezikian J. P., Landry D. W., Nat. Med. 2020, 26, 1017. - PMC - PubMed
    1. Johns Hopkins University of Medicine (2021 January 11).
    1. Zhu L., She Z.‐G., Cheng X., Qin J.‐J., Zhang X.‐J., Cai J., Lei F., Wang H., Xie J., Wang W., Li H., Zhang P., Song X., Chen X., Xiang M., Zhang C., Bai L., Xiang D., Chen M.‐M., Liu Y., Yan Y., Liu M., Mao W., Zou J., Liu L., Chen G., Luo P., Xiao B., Zhang C., Zhang Z., Lu Z., Wang J., Lu H., Xia X., Wang D., Liao X., Peng G., Ye P., Yang J., Yuan Y., Huang X., Guo J., Zhang B.‐H., Li H., Cell Metab. 2020, 31, 1068. - PMC - PubMed
    1. Song J.‐W., Lam S. M., Fan X., Cao W.‐J., Wang S.‐Y., Tian H., Chua G. H., Zhang C., Meng F.‐P., Xu Z., Fu J.‐L., Huang L., Xia P., Yang T., Zhang S., Li B., Jiang T.‐J., Wang R., Wang Z., Shi M., Zhang J.‐Y., Wang F.‐S., Shui G., Cell Metab. 2020, 32, 188. - PMC - PubMed
    1. Thomas T., Stefanoni D., Reisz J. A., Nemkov T., Bertolone L., Francis R. O., Hudson K. E., Zimring J. C., Hansen K. C., Hod E. A., Spitalnik S. L., D'Alessandro A., JCI Insight 2020, 5, e140327. - PMC - PubMed

Publication types

LinkOut - more resources