

Assessing a transmission network of Mycobacterium tuberculosis in an African city using single nucleotide polymorphism threshold analysis
- PMID: 34180596
- PMCID: PMC8209283
- DOI: 10.1002/mbo3.1211
Assessing a transmission network of Mycobacterium tuberculosis in an African city using single nucleotide polymorphism threshold analysis
Abstract
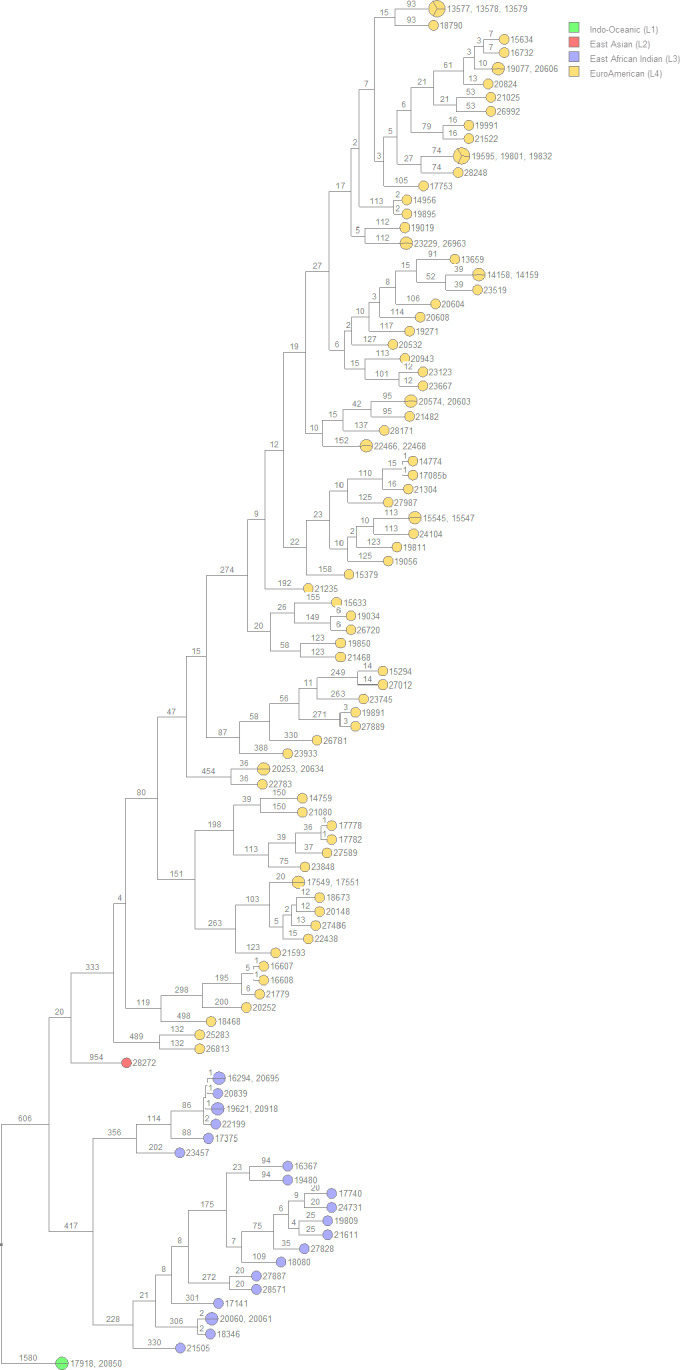
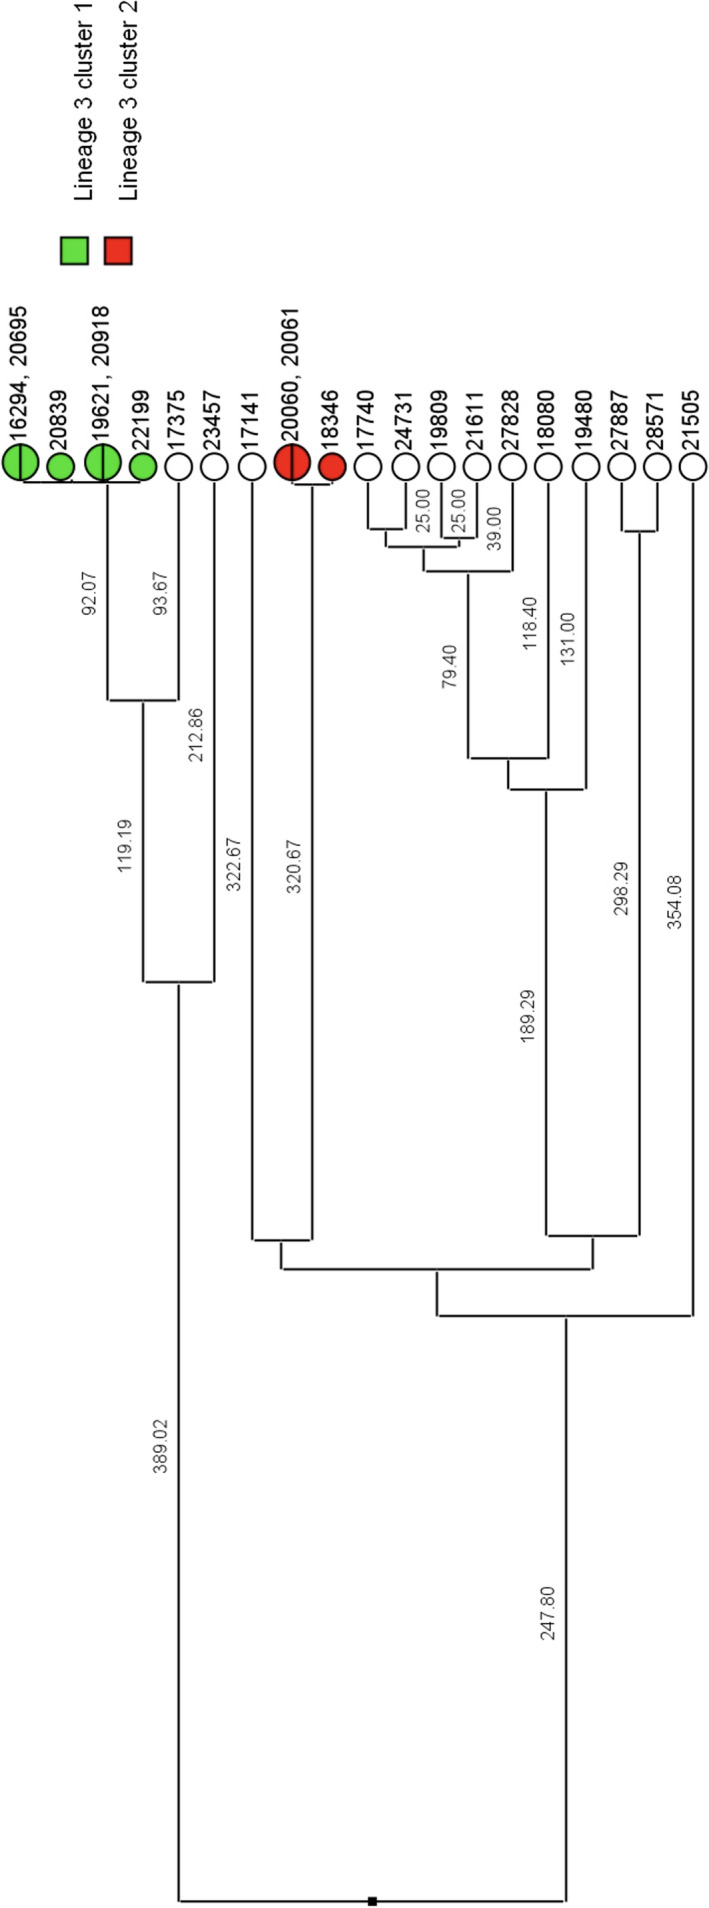
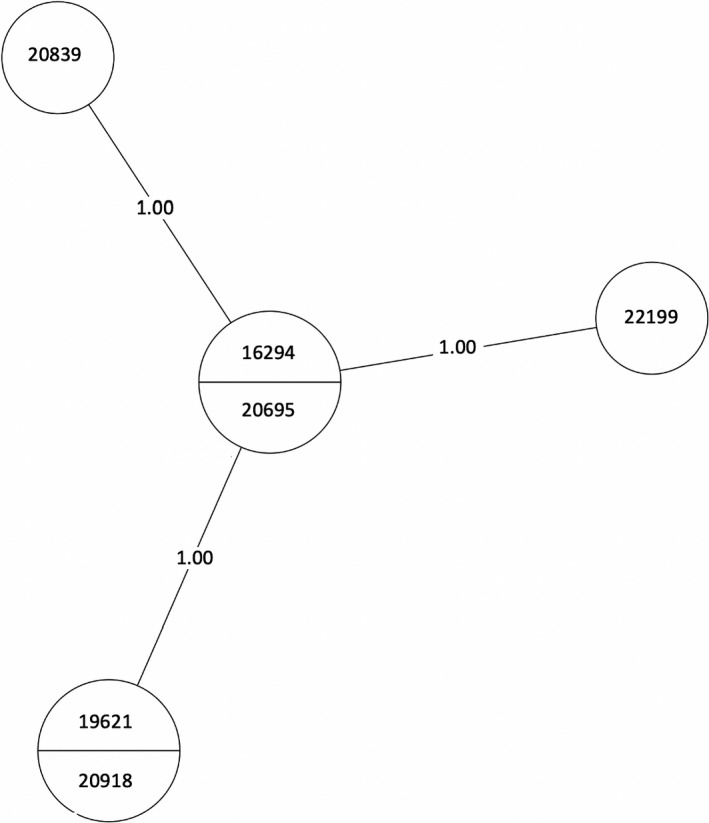
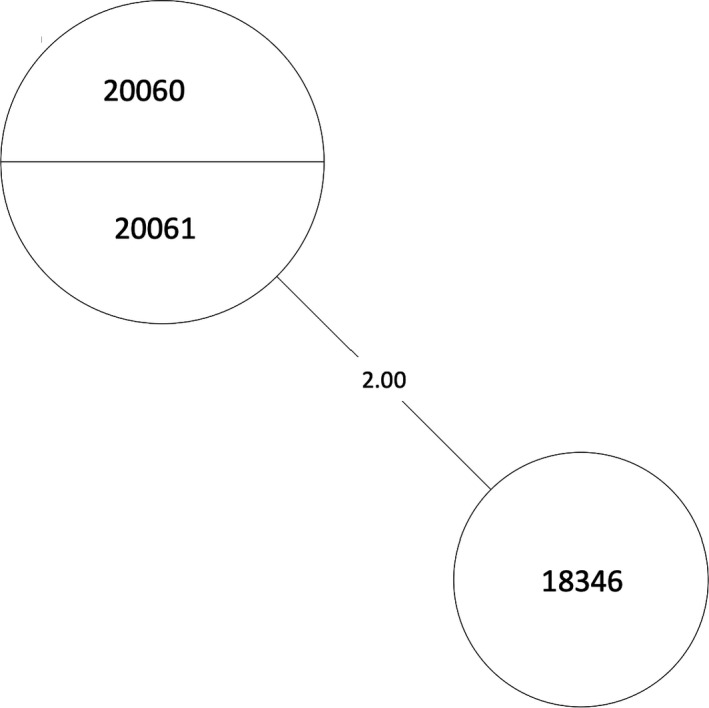
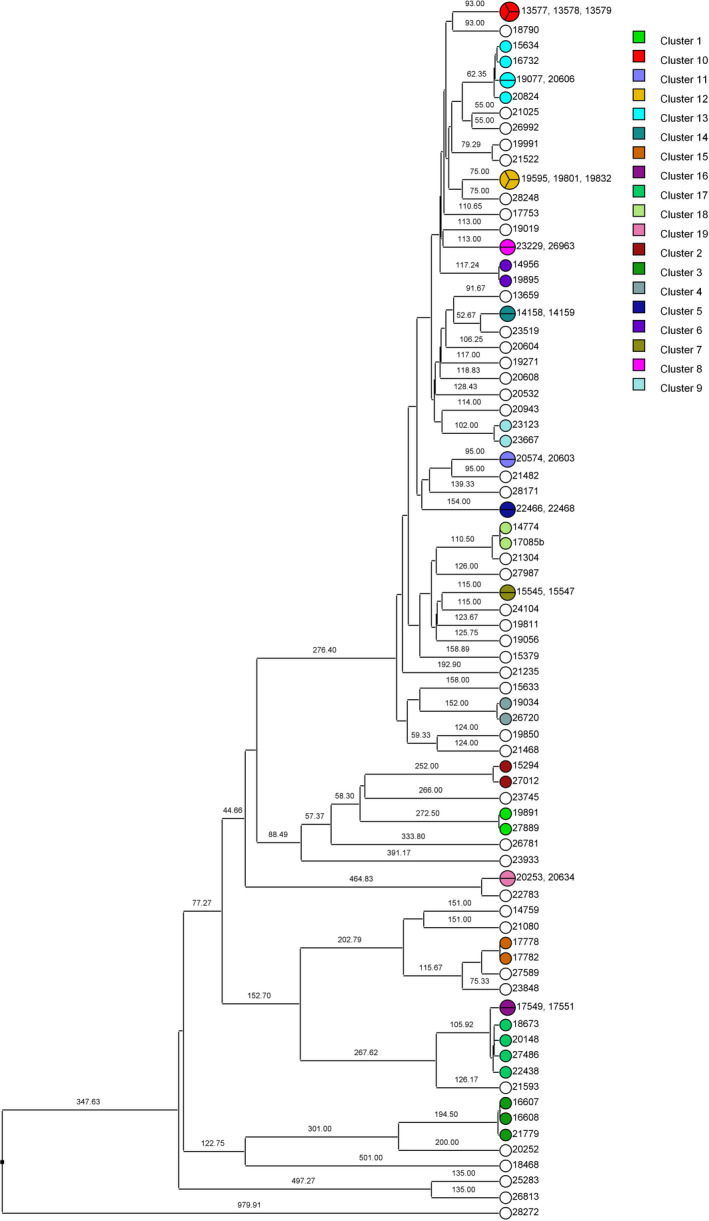
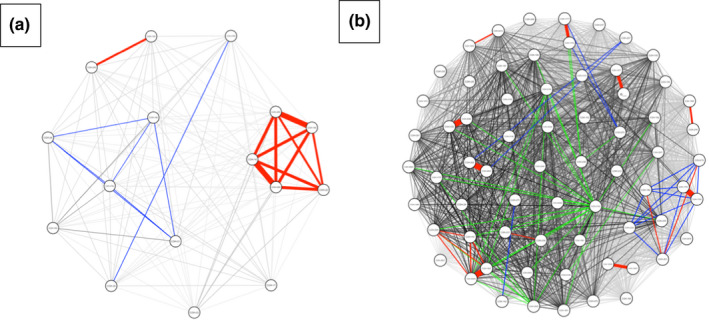
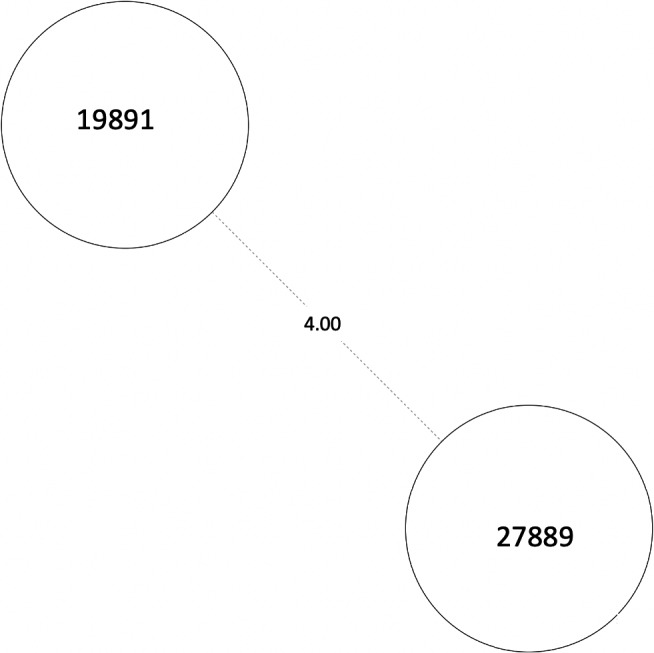
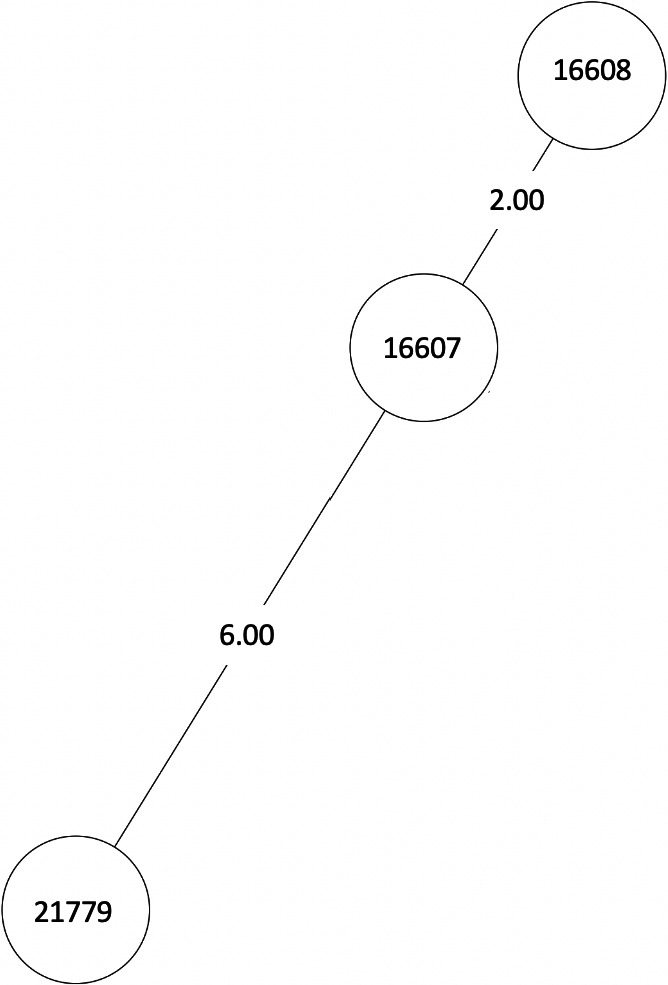
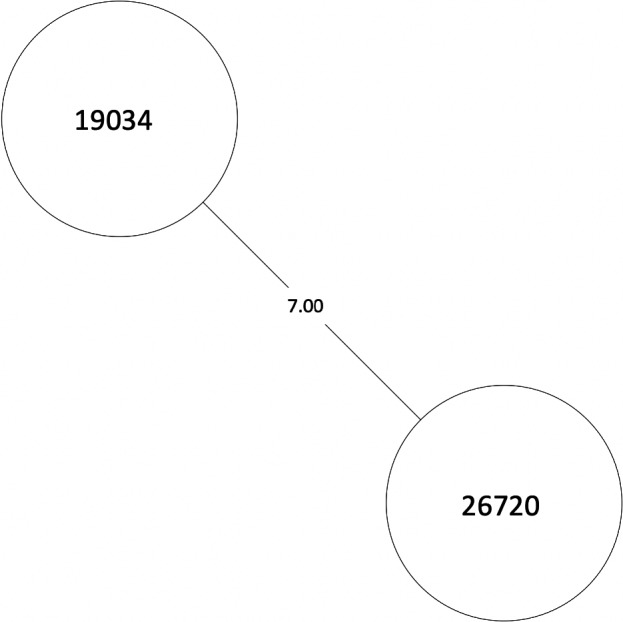
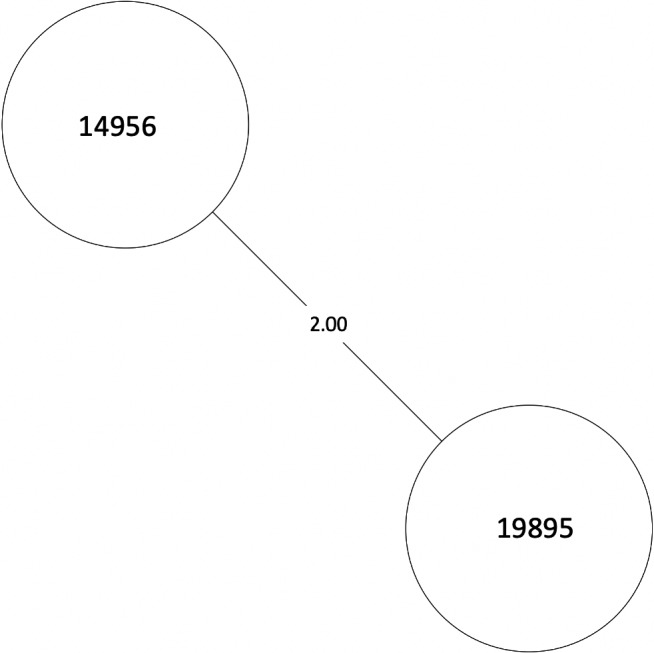
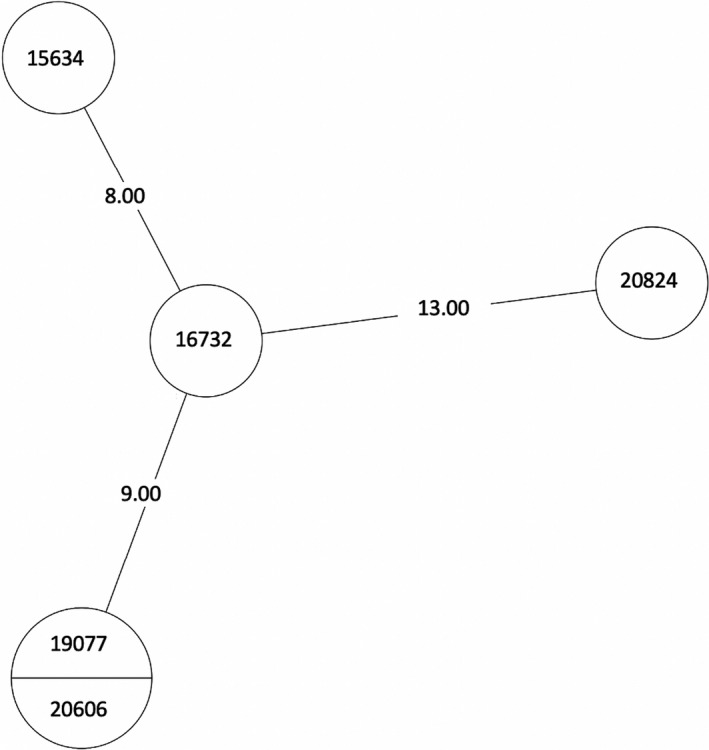
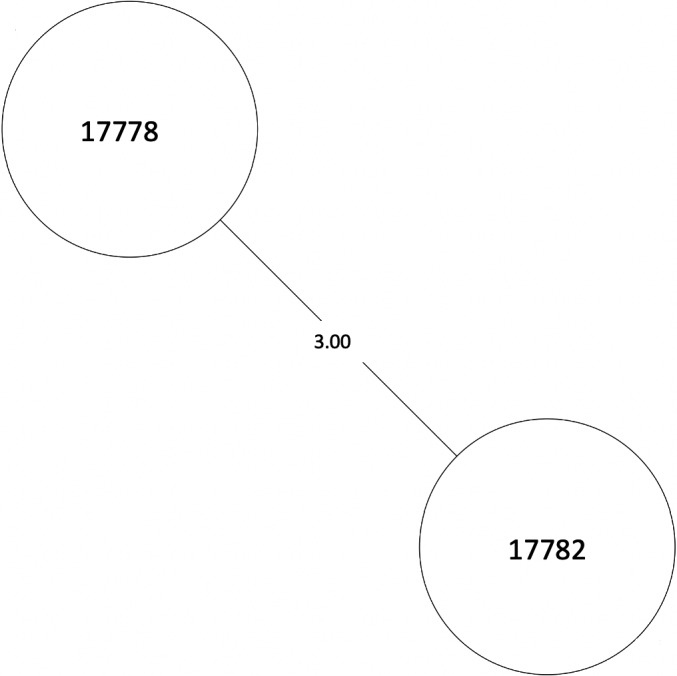
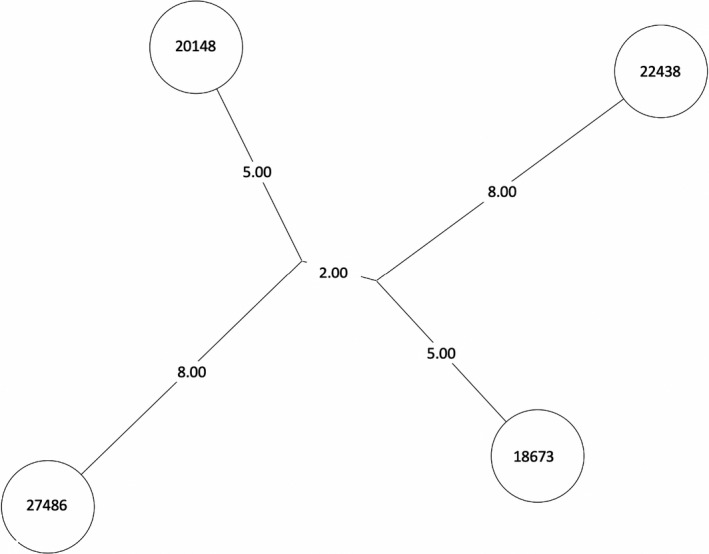
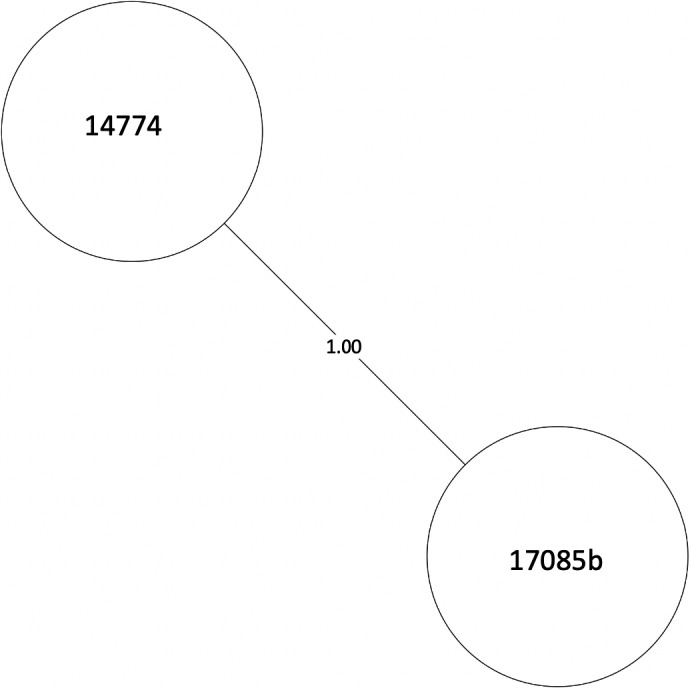
Tuberculosis (TB) is the leading cause of death in humans by a single infectious agent worldwide with approximately two billion humans latently infected with the bacterium Mycobacterium tuberculosis. Currently, the accepted method for controlling the disease is Tuberculosis Directly Observed Treatment Shortcourse (TB-DOTS). This program is not preventative and individuals may transmit disease before diagnosis, thus better understanding of disease transmission is essential. Using whole-genome sequencing and single nucleotide polymorphism analysis, we analyzed genomes of 145 M. tuberculosis clinical isolates from active TB cases from the Rubaga Division of Kampala, Uganda. We established that these isolates grouped into M. tuberculosis complex (MTBC) lineages 1, 2, 3, and 4, with the most isolates grouping into lineage 4. Possible transmission pairs containing ≤12 SNPs were identified in lineages 1, 3, and 4 with the prevailing transmission in lineages 3 and 4. Furthermore, investigating DNA codon changes as a result of specific SNPs in prominent virulence genes including plcA and plcB could indicate potentially important modifications in protein function. Incorporating this analysis with corresponding epidemiological data may provide a blueprint for the integration of public health interventions to decrease TB transmission in a region.
Keywords: Mycobacterium tuberculosis; single nucleotide polymorphism; social network; transmission; tuberculosis.
© 2021 The Authors. MicrobiologyOpen published by John Wiley & Sons Ltd.
Conflict of interest statement
None declared.
Figures
Similar articles
-
Diversified lineages and drug-resistance profiles of clinical isolates of Mycobacterium tuberculosis complex in Malaysia.Int J Mycobacteriol. 2019 Oct-Dec;8(4):320-328. doi: 10.4103/ijmy.ijmy_144_19. Int J Mycobacteriol. 2019. PMID: 31793500
-
Mycobacterium tuberculosis Uganda genotype is the predominant cause of TB in Kampala, Uganda.Int J Tuberc Lung Dis. 2008 Apr;12(4):386-91. Int J Tuberc Lung Dis. 2008. PMID: 18371263
-
A single-nucleotide-polymorphism real-time PCR assay for genotyping of Mycobacterium tuberculosis complex in peri-urban Kampala.BMC Infect Dis. 2015 Sep 30;15:396. doi: 10.1186/s12879-015-1121-7. BMC Infect Dis. 2015. PMID: 26423522 Free PMC article.
-
Biological and Epidemiological Consequences of MTBC Diversity.Adv Exp Med Biol. 2017;1019:95-116. doi: 10.1007/978-3-319-64371-7_5. Adv Exp Med Biol. 2017. PMID: 29116631 Review.
-
Single nucleotide polymorphisms in Mycobacterium tuberculosis and the need for a curated database.Tuberculosis (Edinb). 2013 Jan;93(1):30-9. doi: 10.1016/j.tube.2012.11.002. Epub 2012 Dec 21. Tuberculosis (Edinb). 2013. PMID: 23266261 Free PMC article. Review.
Cited by
-
Global epidemiology of Mycobacterium tuberculosis lineage 4 insights from Ecuadorian genomic data.Sci Rep. 2025 Jan 30;15(1):3823. doi: 10.1038/s41598-025-86079-8. Sci Rep. 2025. PMID: 39885182 Free PMC article.
-
Mycobacterium tuberculosis-macrophage interaction: Molecular updates.Front Cell Infect Microbiol. 2023 Mar 3;13:1062963. doi: 10.3389/fcimb.2023.1062963. eCollection 2023. Front Cell Infect Microbiol. 2023. PMID: 36936766 Free PMC article. Review.
References
-
- Auld, S. C. , Shah, N. S. , Cohen, T. , Martinson, N. A. , & Gandhi, N. R. (2018). Where is tuberculosis transmission happening? Insights from the literature, new tools to study transmission and implications for the elimination of tuberculosis. Respirology, 23(9), 807–817. 10.1111/resp.13333 - DOI - PMC - PubMed
-
- Castro‐Garza, J. , González‐Salazar, F. , Quinn, F. D. , Karls, R. K. , De La Garza‐Salinas, L. H. , Guzmán‐de la Garza, F. J. , & Vargas‐Villarreal, J. (2016). An acidic sphingomyelinase Type C activity from Mycobacterium tuberculosis . Revista Argentina de Microbiologia, 48(1), 21–26. 10.1016/j.ram.2016.01.001 - DOI - PubMed
-
- Cavalcante, S. C. , Durovni, B. , Barnes, G. L. , Souza, A. F. B. , Silva, R. F. , Barroso, P. F. , Mohan, C. I. , Miller, A. , Golub, J. E. , & Chaisson, R. E. (2010). Community‐randomized trial of enhanced DOTS for tuberculosis control in Rio de Janeiro, Brazil. The International Journal of Tuberculosis and Lung Disease, 14(2), 203–209. - PMC - PubMed
-
- Coll, F. , McNerney, R. , Guerra‐Assunção, J. A. , Glynn, J. R. , Perdigão, J. , Viveiros, M. , Portugal, I. , Pain, A. , Martin, N. , & Clark, T. G. (2014). A robust SNP barcode for typing Mycobacterium tuberculosis complex strains. Nature Communications, 5, 4812. 10.1038/ncomms5812 - DOI - PMC - PubMed
Publication types
MeSH terms
Substances
Grants and funding
LinkOut - more resources
Full Text Sources
Medical
