. 2021 Aug 16;131(16):e141083.
doi: 10.1172/JCI141083.

SLIT2/ROBO signaling in tumor-associated microglia and macrophages drives glioblastoma immunosuppression and vascular dysmorphia

Affiliations

SLIT2/ROBO signaling in tumor-associated microglia and macrophages drives glioblastoma immunosuppression and vascular dysmorphia

Luiz H Geraldo et al. J Clin Invest. .

Abstract

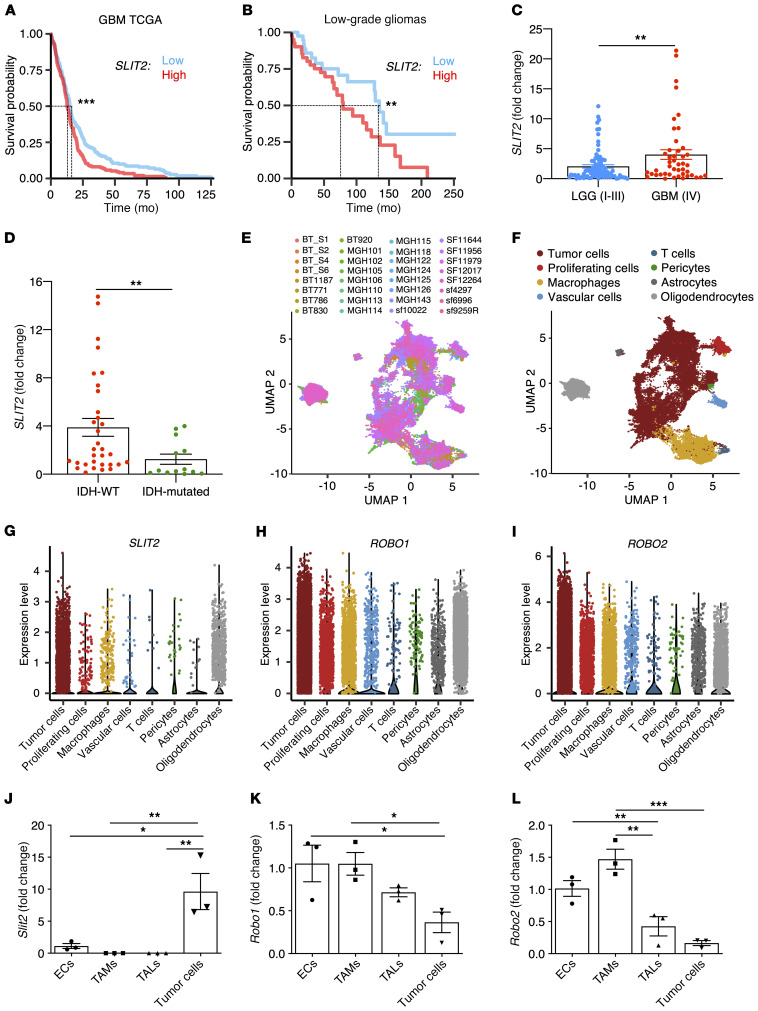
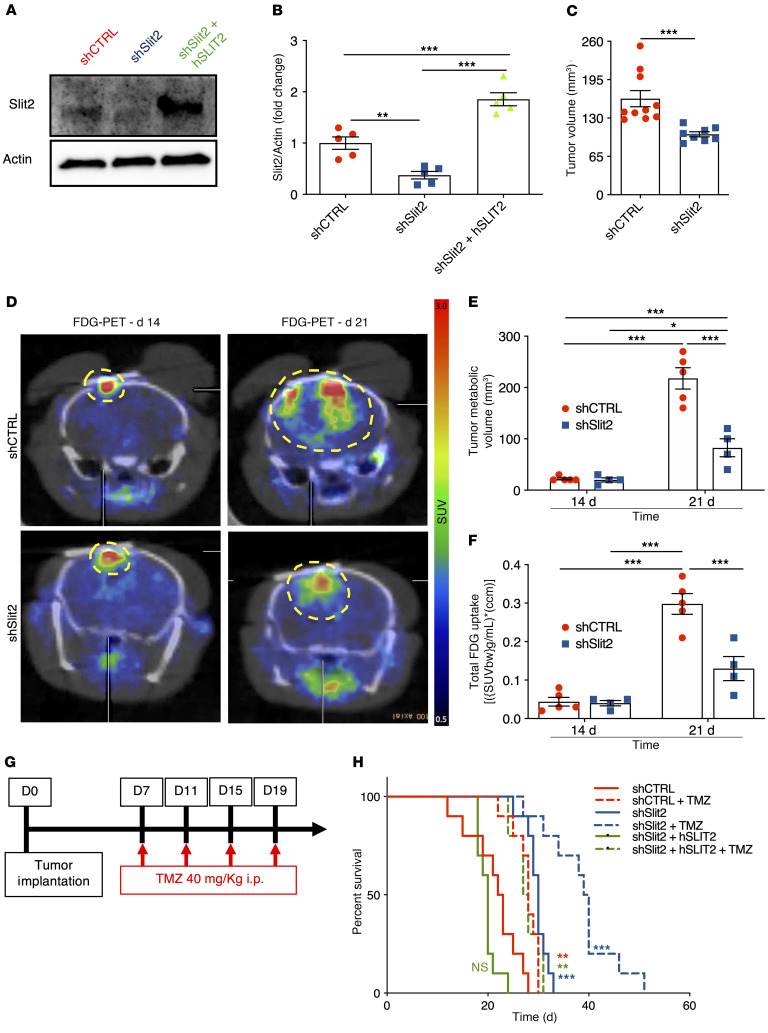
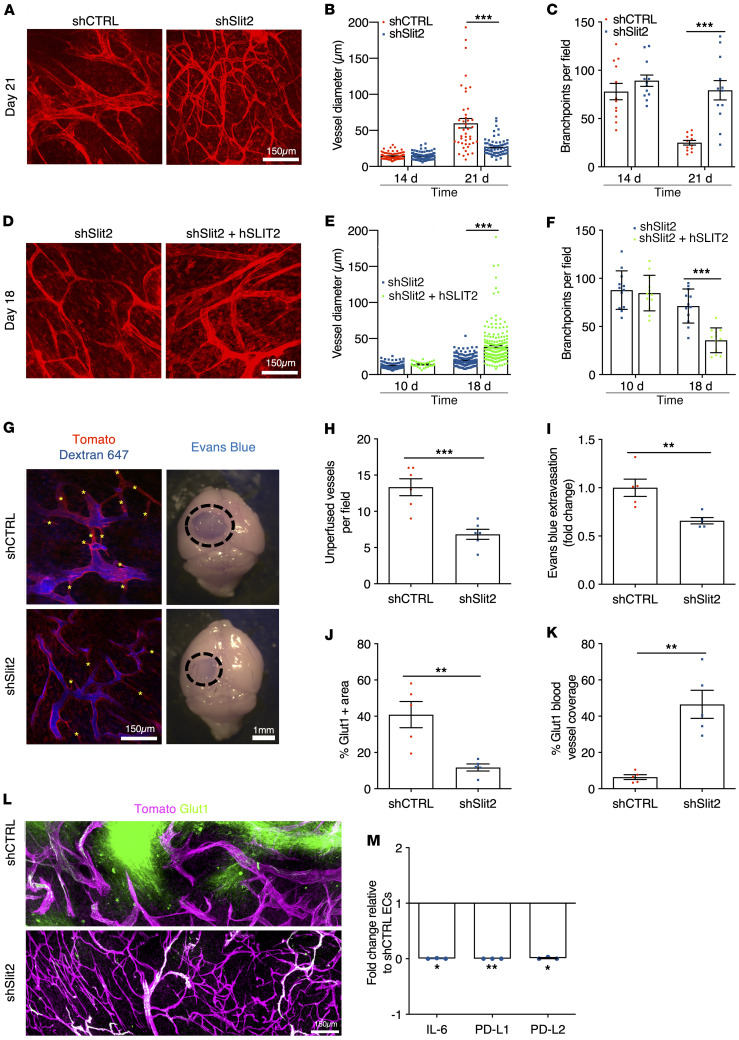
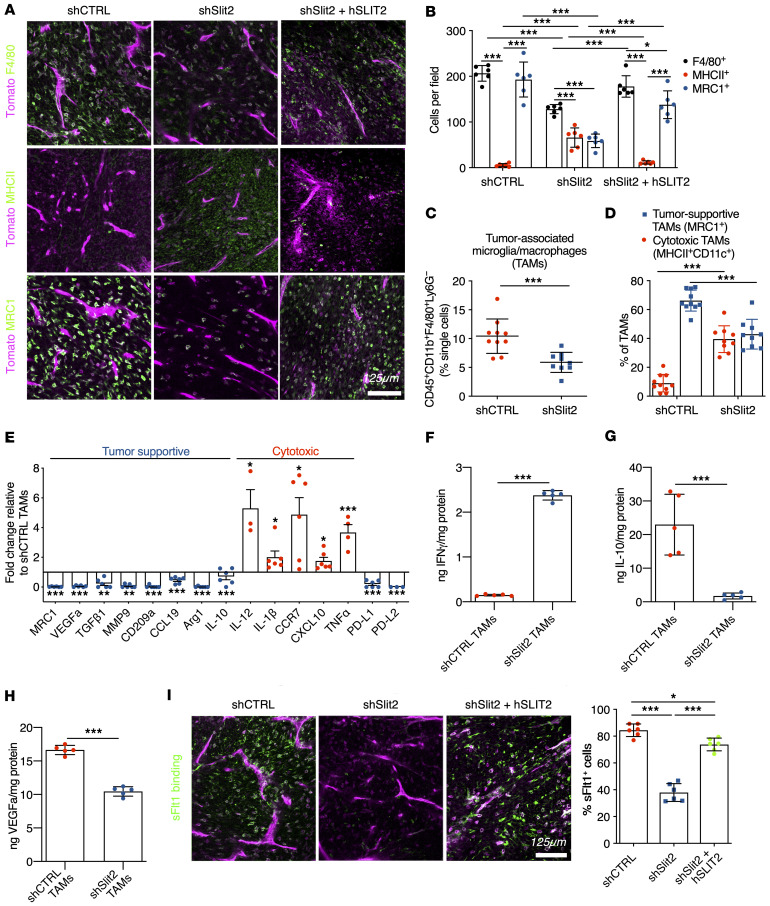
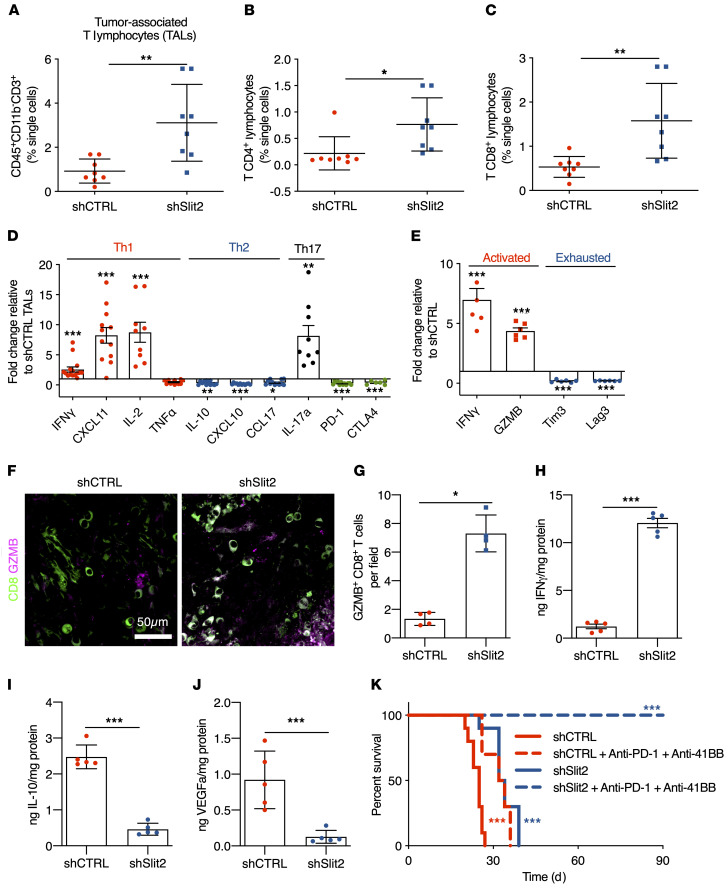
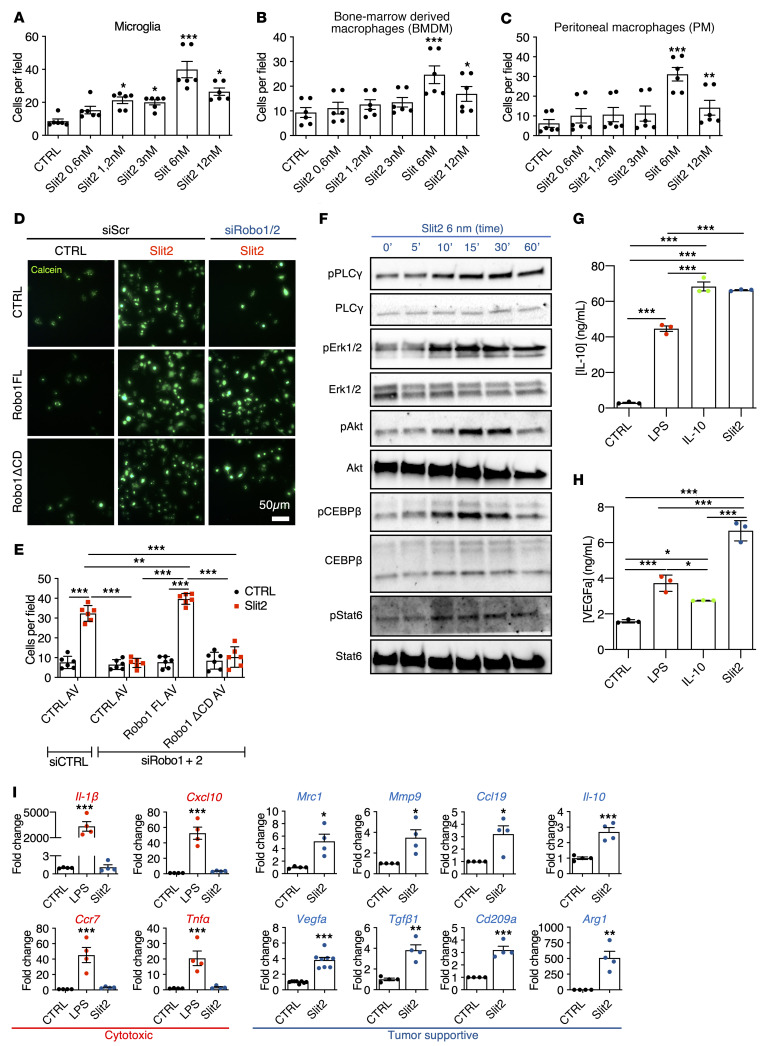
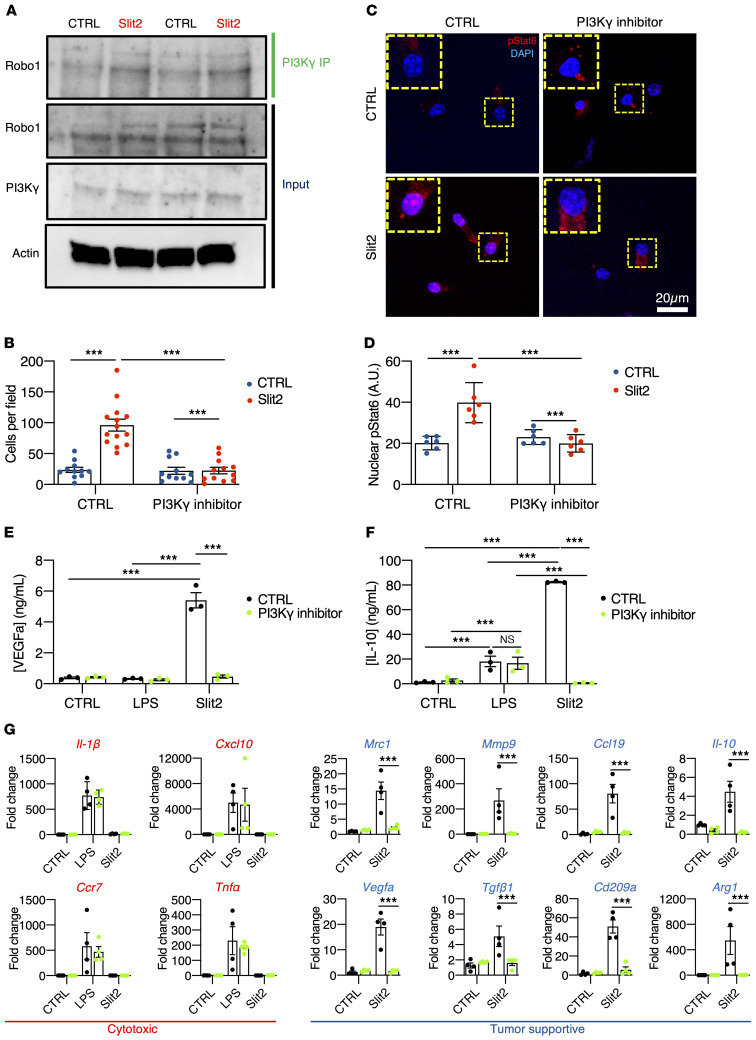
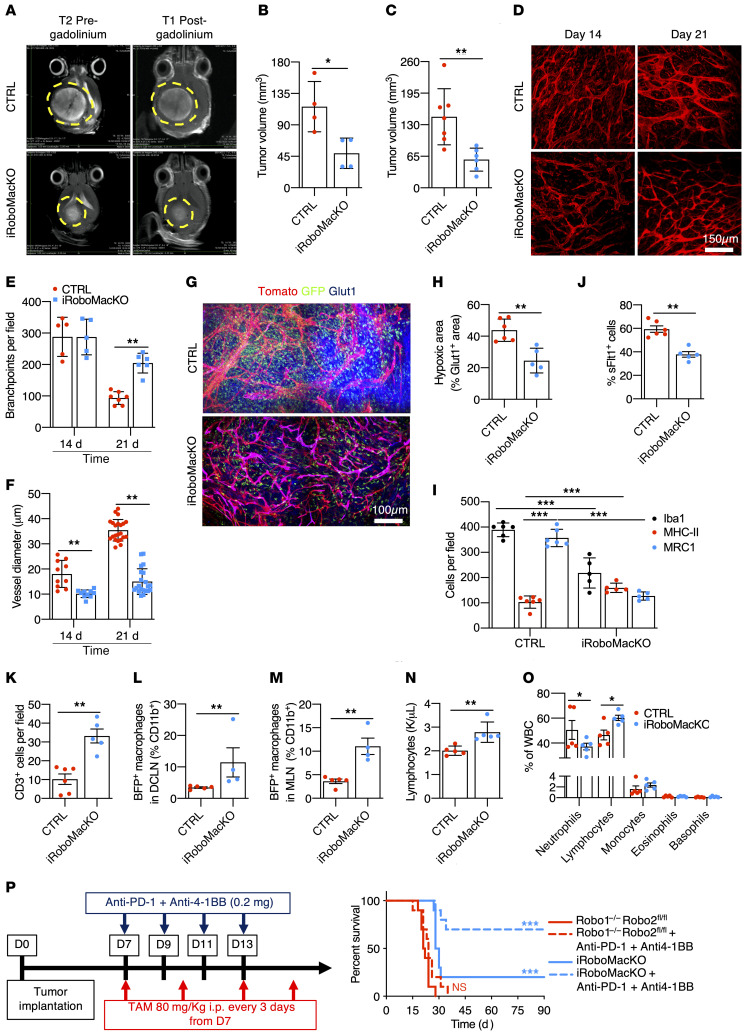
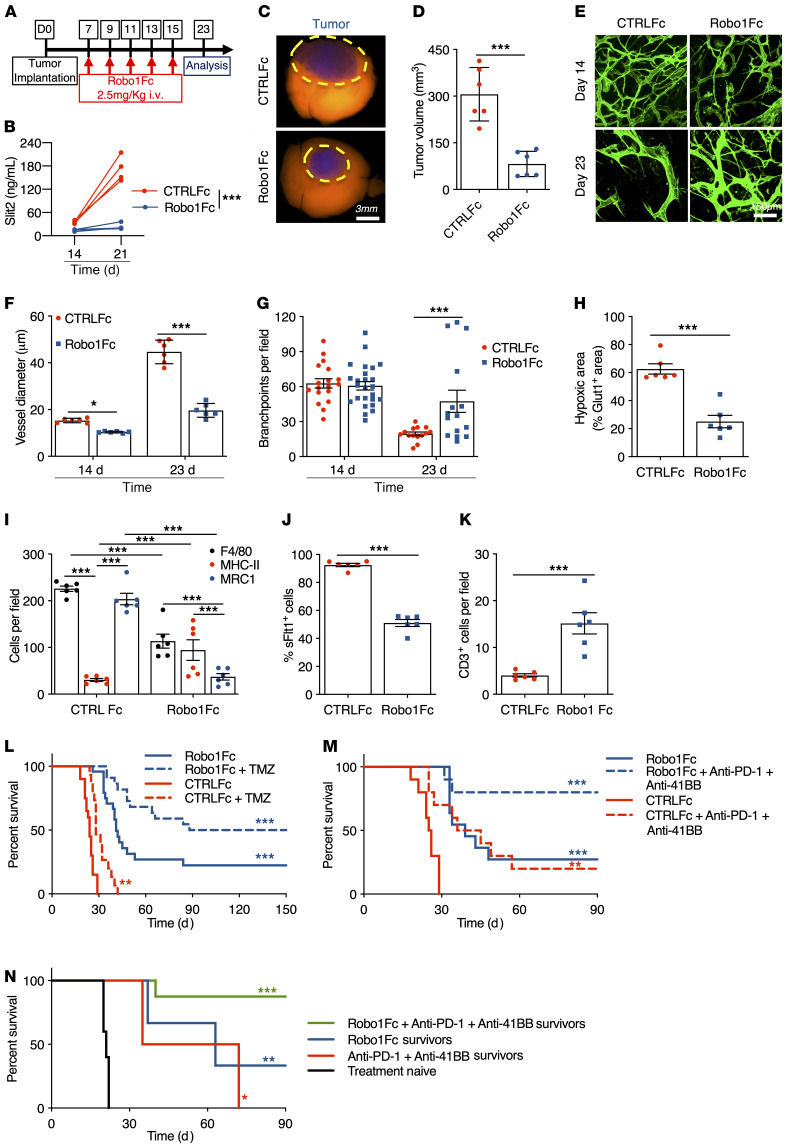
SLIT2 is a secreted polypeptide that guides migration of cells expressing Roundabout 1 and 2 (ROBO1 and ROBO2) receptors. Herein, we investigated SLIT2/ROBO signaling effects in gliomas. In patients with glioblastoma (GBM), SLIT2 expression increased with malignant progression and correlated with poor survival and immunosuppression. Knockdown of SLIT2 in mouse glioma cells and patient-derived GBM xenografts reduced tumor growth and rendered tumors sensitive to immunotherapy. Tumor cell SLIT2 knockdown inhibited macrophage invasion and promoted a cytotoxic gene expression profile, which improved tumor vessel function and enhanced efficacy of chemotherapy and immunotherapy. Mechanistically, SLIT2 promoted microglia/macrophage chemotaxis and tumor-supportive polarization via ROBO1- and ROBO2-mediated PI3K-γ activation. Macrophage Robo1 and Robo2 deletion and systemic SLIT2 trap delivery mimicked SLIT2 knockdown effects on tumor growth and the tumor microenvironment (TME), revealing SLIT2 signaling through macrophage ROBOs as a potentially novel regulator of the GBM microenvironment and immunotherapeutic target for brain tumors.

Keywords: Brain cancer; Immunotherapy; Macrophages; Oncology; Vascular Biology.


Conflict of interest statement

Conflict of interest: The authors have declared that no conflict of interest exists.

Figures

Figure 1
Figure 1. Slit2 expression correlates with glioma aggressiveness and poor patient prognosis.
(A) In silico analysis of TCGA glioblastoma Agilent-4502A patient data set (n = 244 high, 244 low for patients expressing Slit2; OS 12.9 months for high expression and 15.1 months for low expression, log-rank test). (B) Survival analysis of patients with LGG (grades I to III) grouped by their levels of SLIT2 expression (n = 41 high and 41 low; OS 79.4 months for high expression and 135.2 months for low expression, log-rank test). (C) SLIT2 qPCR expression in samples from patients with glioma shown in B (GBM, n = 45; LGG, n = 84; Student’s t test). (D) SLIT2 qPCR expression in grades III and IV glioma patient samples classified by their IDH-1/2 status (IDH-WT, n = 51; IDH-mutated, n = 34; Mann-Whitney U test). (E and F) UMAP plots of scRNAseq of 32 patients with GBM showing different samples (E) and clustering of the different cell types in the GBM microenvironment (F). (GI) Expression plots of SLIT2 (G), ROBO1 (H), and ROBO2 (I) in scRNAseq data from E. (JL) qPCR analysis of Slit2 (J), Robo1 (K), and Robo2 (L) expression in ECs, TAMs, TALs, and tumor cells FACS-sorted from late-stage CT-2A mice glioblastomas (n = 3 independent tumors, day 21 after implantation, 1-way ANOVA). All data are mean ± SEM. *P < 0.05, **P < 0.01, ***P < 0.001.
Figure 2
Figure 2. Slit2 promotes glioblastoma growth and resistance to TMZ.
(A and B) Western blot analysis (A) and quantification (B) of Slit2 expression in shCTRL, shSlit2, and shSlit2 + hSLIT2 CT-2A cells (n = 5, 1-way ANOVA). (C) Tumor volume quantification at 21 days (n = 10 for shCTRL and n = 8 for shSlit2, Student’s t test). (D) FDG-PET imaging over CT-2A shCTRL and shSlit2 glioma growth (n = 5 shCTRL and n = 4 shSlit2). (E and F) Quantification of tumor metabolic volume (E) and total tumor glucose uptake (F) from D (n = 5 for shCTRL and n = 4 for shSlit2, 1-way ANOVA). (G) Survival trial design: 8-week-old mice were engrafted with CT-2A shCTRL, shSlit2, or shSlit2 + hSLIT2 spheroids and randomly assigned to vehicle or TMZ treatment (40 mg/kg on days 7, 11, 15, and 19 after tumor implantation). (H) Survival curves of the mice in G (n = 10 mice per group, OS 22.5 days for shCTRL, 28 days for shCTRL + TMZ, 30 days for shSlit2, 39.5 days for shSlit2 + TMZ, 20 days for shSlit2 + hSLIT2, and 27 days for shSlit2 + hSLIT2 + TMZ; multiple comparisons log-rank test). Data are mean ± SEM. *P < 0.05, **P < 0.01, ***P < 0.001.
Figure 3
Figure 3. Slit2 promotes blood vessel dysmorphia in GBM.
(A) In vivo 2-photon images of ROSAmTmG mice bearing day 21 CT-2A shCTRL or shSlit2 tumors. (B and C) Quantification of vessel diameter (B) and branchpoints (C) (n = 8 mice per group, 1-way ANOVA). (D) In vivo 2-photon images of ROSAmTmG mice bearing day 18 CT-2A shSlit2 or shSlit2 + hSLIT2 tumors. (E and F) Quantification of vessel diameter (E) and branchpoints (F) (n = 7 mice per group, 1-way ANOVA). (GI) Left: 2-photon in vivo imaging following intravenous injection of Alexa Fluor 647–conjugated Dextran highlighting unperfused blood vessel segments in the tumor core (asterisks) of day 21 CT-2A shCTRL and shSlit2 tumors. Right: representative pictures of whole brains of day 21 shCTRL or shSlit2 CT-2A tumors following Evans blue injection. (H) Quantification of unperfused blood vessel segments in the tumor mass presented in G (n = 5 mice per group, Mann-Whitney U test). (I) Quantification of Evans blue extravasation in (G) (n = 5 mice per group, Mann-Whitney U test). (JL) Quantifications of Glut1+ hypoxic areas in the tumor (J) and Glut1 blood vessel coverage (K) from immunohistochemistry on sections (L) (n = 5 mice per group, Mann-Whitney U test). (M) qPCR analyses from FACS-sorted ECs (n = 3 tumors/group, Mann-Whitney U test). Data are mean ± SEM. *P < 0.05, **P < 0.01, ***P < 0.001.
Figure 4
Figure 4. Slit2 promotes TAM recruitment and polarization in mouse gliomas.
(A) Immunohistochemistry on sections of late-stage CT-2A shCTRL, shSlit2, or shSlit2 + hSLIT2 tumors for F4/80, MHC-II, and MRC1+ cells (green). (B) Quantifications of A (n = 7 mice per group, 5 fields per tumor, 2-way ANOVA). (C and D) FACS analysis of day 21 CT-2A shCTRL and shSlit2 tumors for quantification of TAMs (n = 10 tumors/group; Student’s t test and 2-way ANOVA). (E) qPCR analysis from FACS-sorted TAMs (n = 6 tumors/group, Mann-Whitney U test). (FH) ELISA from protein samples extracted from FACS-sorted TAMs from shCTRL and shSlit2 tumors to quantify IFN-γ (F), IL-10 (G), and VEGFa (H) (n = 5 tumors/group, Mann-Whitney U test). (I) Representative images and quantification of soluble-Flt1 binding to sections of day 21 CT-2A shCTRL, shSlit2, and day 18 shSlit2 + hSLIT2 tumors (n = 7 mice per group, 5 fields per tumor, 1-way ANOVA). *P < 0.05, **P < 0.01, ***P < 0.001.
Figure 5
Figure 5. Slit2 inhibits T lymphocyte responses in the glioma microenvironment.
(AC) T lymphocyte FACS analysis of day 21 CT-2A shCTRL and shSlit2 tumors for total CD3+ TALs (A), CD4+ TALs (B), and CD8+ TALs (C) (n = 8 tumors/group; Student’s t test). (D) qPCR analyses from FACS-sorted CD4+ T lymphocytes (n = 10 tumors/group, Mann-Whitney U test). (E) qPCR analyses from FACS-sorted CD8+ T lymphocytes (n = 6 tumors/group, Mann-Whitney U test). (F) Representative images of CD8 and GZMB staining on sections of day 21 CT-2A shCTRL and shSlit2 tumors. (G) Quantification of F (n = 4 mice per group, 5 fields per tumor, Mann-Whitney U test). (HJ) ELISA from protein samples extracted from FACS-sorted CD8+ TALs from shCTRL and shSlit2 tumors to quantify IFN-γ (H), IL-10 (I), and VEGFa (J) (n = 5 tumors/group, Mann-Whitney U test). (K) Eight-week-old mice were engrafted with CT-2A shCTRL or shSlit2 and randomly assigned to vehicle or anti–PD-1 + anti–4-1BB treatment (0.2 mg each on days 7, 9, 11, and 13 after tumor implantation) (n = 10/11 mice per group, OS 25 days for shCTRL, 33 days for shCTRL + anti–PD-1 + anti–4-1BB, 33 days for shSlit2, and undetermined for shSlit2 + anti–PD-1 + anti–4-1BB; multiple comparisons log-rank test). Data are mean ± SEM. *P < 0.05, **P < 0.01, ***P < 0.001.
Figure 6
Figure 6. Slit2 drives microglia and macrophage migration and tumor supportive polarization.
(AC) Transwell assay of microglial cells (A), BMDMs (B), and PMs (C) in response to Slit2 or carrier (CTRL) in the bottom chamber (n = 4, 1-way ANOVA). (D and E) Transwell assay of RAW macrophages treated or not with Robo1/2 siRNA and infected with adenovirus encoding CTRL (GFP construct), Robo1FL, or Robo1ΔCD constructs and stained with calcein. (E) Quantification of D (n = 3, 2-way ANOVA). (F) Western blot analysis of Slit2 downstream signaling in cultured BMDMs (n = 6). (G and H) ELISA from conditioned medium from LPS-, Il-10–, or Slit2-treated BMDMs to quantify IL-10 (G) and VEGFa (H) (n = 3 independent cultures, Mann-Whitney U test). (I) qPCR analysis of BMDM cultures following Slit2 or LPS treatment (n = 4, 1-way ANOVA or Mann-Whitney U test). Data are mean ± SEM. *P < 0.05, **P < 0.01, ***P < 0.001.
Figure 7
Figure 7. Slit2-driven microglia/macrophage polarization via PI3K-γ.
(A) PI3K-γ immunoprecipitation in BMDMs treated or not with Slit2 for 15 minutes and Western blot for Robo1 (n = 3 independent experiments). (B) Transwell assay of BMDMs in response to Slit2 or carrier (CTRL) in the bottom chamber after pretreatment with vehicle control (DMSO) or PI3K-γ inhibitor IPI-549 (1 μM). (C and D) Phospho-Stat6 immunofluorescent staining of BMDMs treated or not with Slit2 and PI3K-γ inhibitor and quantification of nuclear pStat6 intensity (n = 4 independent cultures, 2-way ANOVA). (E and F) ELISA from conditioned medium from LPS- or Slit2-treated BMDMs with vehicle control (DMSO) or PI3K-γ inhibitor, to quantify IL-10 (E) and VEGFa (F) (n = 3 independent cultures, 2-way ANOVA). (G) qPCR analysis of BMDM cultures following Slit2 or LPS treatment with vehicle control or PI3K-γ inhibitor (n = 4 independent cultures, 2-way ANOVA). Data are mean ± SEM. *P < 0.05, ***P < 0.001.
Figure 8
Figure 8. Macrophage-specific Robo1/2 knockout normalizes the TME.
(A) MRI images of CTRL and iRoboMacKO mice 21 days after tumor implantation. (B and C) Quantification of day 21 tumor size on MRI images (B, n = 4 tumors per group, Mann-Whitney U test) and serial vibratome sections (C, n = 7 CTRL and 6 iRoboMacKO tumors, Mann-Whitney U test). (DF) In vivo 2-photon images of tumor-bearing mice (D) and quantification of vessel diameter (E) and branchpoints (F) (n = 6 mice per group, 1-way ANOVA). (G and H) Glut1 (blue) immunohistochemistry on day 21 tumor-bearing mice (G), and quantification of tumor hypoxic areas (H) (n = 6 CTRL and 5 iRoboMacKO tumors, Mann-Whitney U test). (IK) Quantification of F4/80, MHC-II, and MRC1+ cells (I), sFLT1+ GFP+ cells (J), and total TALs (CD3+) (K) (n = 6 CTRL and 5 iRoboMacKO tumors, 2-way ANOVA or Mann-Whitney U test). (L and M) FACS analysis of deep cervical DCLNs and MLNs from day 21 tumor-bearing mice (n = 5 CTRL and 4 iRoboMacKO mice; Mann-Whitney U test). (N and O) Lymphocyte counts (N) and differential WBC counts (O) from peripheral blood of day 21 tumor-bearing mice (n = 5 mice/group; Mann-Whitney U test). (P) Eight-week-old mice engrafted with CT-2A BFP and treated with 80 mg/kg tamoxifen i.p. every 3 days starting 7 days after tumor implantation were randomly assigned to vehicle or anti–PD-1 + anti–4-1BB treatment (0.2 mg/dose on days 7, 9, 11, and 13 after tumor implantation) (n = 10/11 mice per group, OS 21.5 days for Robo1–/–Robo2fl/fl, 24 days for Robo1–/–Robo2fl/fl + anti–PD-1 + anti–4-1BB, 29 days for iRoboMacKO, and undetermined for iRoboMacKO + anti–PD-1 + anti–4-1BB; multiple comparisons log-rank test). Data are mean ± SEM. *P < 0.05, **P < 0.01, ***P < 0.001.
Figure 9
Figure 9. Robo1Fc treatment limits glioma growth.
(A) Eight-week-old mice engrafted with CT-2A spheroids were treated with CTRLFc or Robo1Fc as indicated, and analyzed at day 23. (B) ELISA of serum Slit2 (n = 4, 2-way ANOVA). (C and D) Tumor size at day 23 (n = 6, Student’s t test). (EG) In vivo 2-photon images (E) and quantification of vessel diameter (F) and branchpoints (G) (n = 6 mice per group, 1-way ANOVA). (H) Quantification of Glut1+ area (n = 6 mice per group, Mann-Whitney U test). (IK) Quantification of F4/80, MHC-II, and MRC1 (I), soluble-Flt1 binding (J), and CD3 immunostaining (K) (n = 6 mice per group, 2-way ANOVA (I) or Student’s t test). (L) Eight-week-old tumor-bearing mice were assigned to CTRLFc + vehicle (n = 20), CTRLFc + TMZ (n = 15), Robo1Fc + vehicle (n = 24), or Robo1Fc + TMZ (n = 22; OS 24 days CTRLFc; 28 days CTRLFc + TMZ; 41 days Robo1Fc; 119 days Robo1Fc + TMZ; multiple comparisons Mantel-Cox log-rank). (M) Eight-week-old tumor-bearing mice were assigned to CTRLFc + vehicle, CTRLFc + anti–PD-1 + anti–4-1BB, Robo1Fc + vehicle, or Robo1Fc + anti–PD-1 + anti–4-1BB (n = 10/11 mice per group; OS 25.5 days CTRLFc; 40 days CTRLFc + anti–PD-1 + anti–4-1BB; 39 days Robo1Fc; and undetermined for Robo1Fc + anti–PD-1 + anti–4-1BB; multiple comparisons log-rank test). (N) Ninety days after tumor implantation, surviving mice from M (n = 2 anti–PD-1 + anti–4-1BB, n = 3 Robo1Fc, and n = 8 Robo1Fc + anti–PD-1 + anti–4-1BB) or 8-week-old tumor-naive mice (n = 10) were rechallenged in the contralateral hemisphere (OS 21 days naive mice; 53.5 days CTRLFc + anti–PD-1 + anti–4-1BB survivors; 63 days Robo1Fc survivors; and undetermined for Robo1Fc + anti–PD-1 + anti–4-1BB survivors; multiple comparisons log-rank test). Data are mean ± SEM. *P < 0.05, **P < 0.01, ***P < 0.001.

References

    1. Ostrom QT, et al. CBTRUS statistical report: primary brain and other central nervous system tumors diagnosed in the United States in 2009-2013. Neuro Oncol. 2016;18(Suppl_5):v1–v75. doi: 10.1093/neuonc/now207. - DOI - PMC - PubMed
    1. Louis DN, et al. The 2016 World Health Organization classification of tumors of the central nervous system: a summary. Acta Neuropathol. 2016;131(6):803–820. doi: 10.1007/s00401-016-1545-1. - DOI - PubMed
    1. Omuro A, DeAngelis LM. Glioblastoma and other malignant gliomas: a clinical review. JAMA. 2013;310(17):1842–1850. doi: 10.1001/jama.2013.280319. - DOI - PubMed
    1. Aldape K, et al. Challenges to curing primary brain tumours. Nat Rev Clin Oncol. 2019;16(8):509–520. doi: 10.1038/s41571-019-0177-5. - DOI - PMC - PubMed
    1. Chen Z, et al. Cellular and molecular identity of tumor-associated macrophages in glioblastoma. Cancer Res. 2017;77(9):2266–2278. doi: 10.1158/0008-5472.CAN-16-2310. - DOI - PMC - PubMed

Publication types

MeSH terms

Substances