

Estimating pulse wave velocity from the radial pressure wave using machine learning algorithms
- PMID: 34181640
- PMCID: PMC8238176
- DOI: 10.1371/journal.pone.0245026
Estimating pulse wave velocity from the radial pressure wave using machine learning algorithms
Abstract
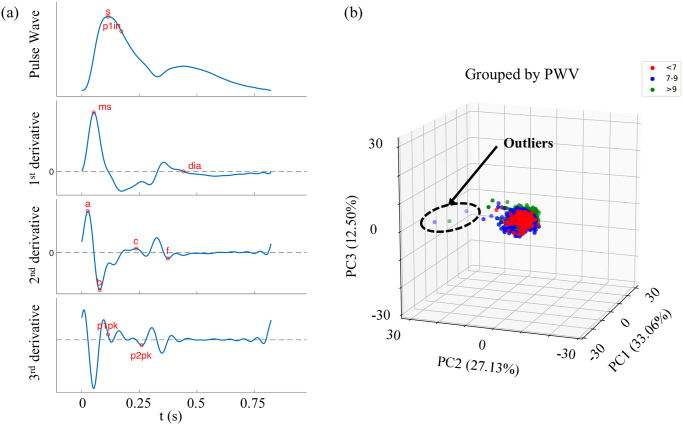
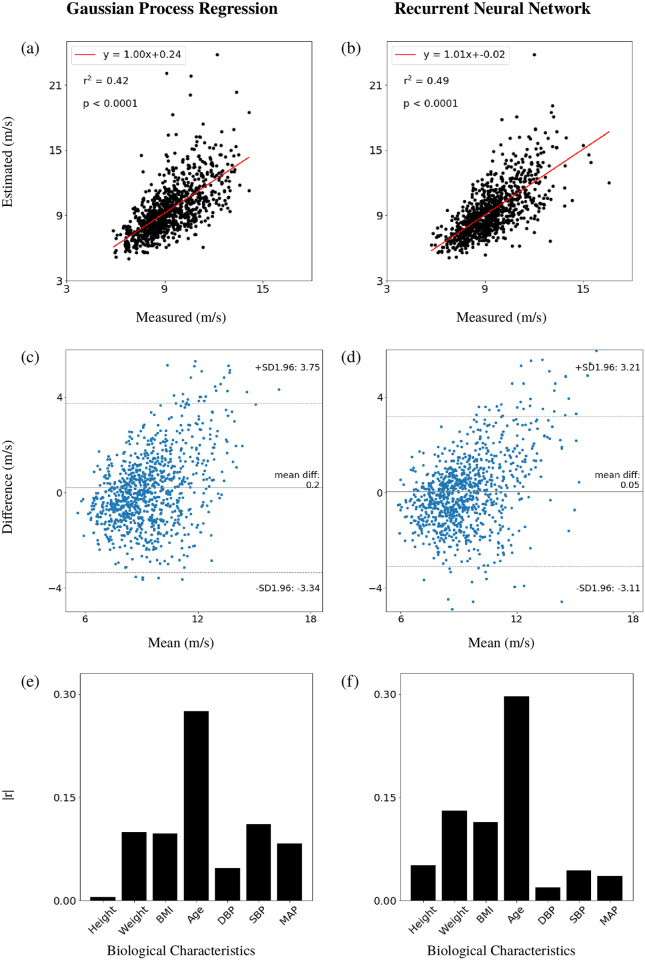
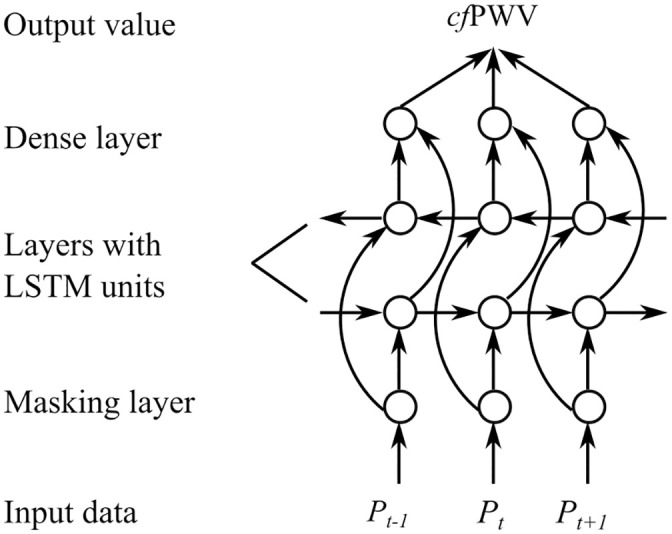
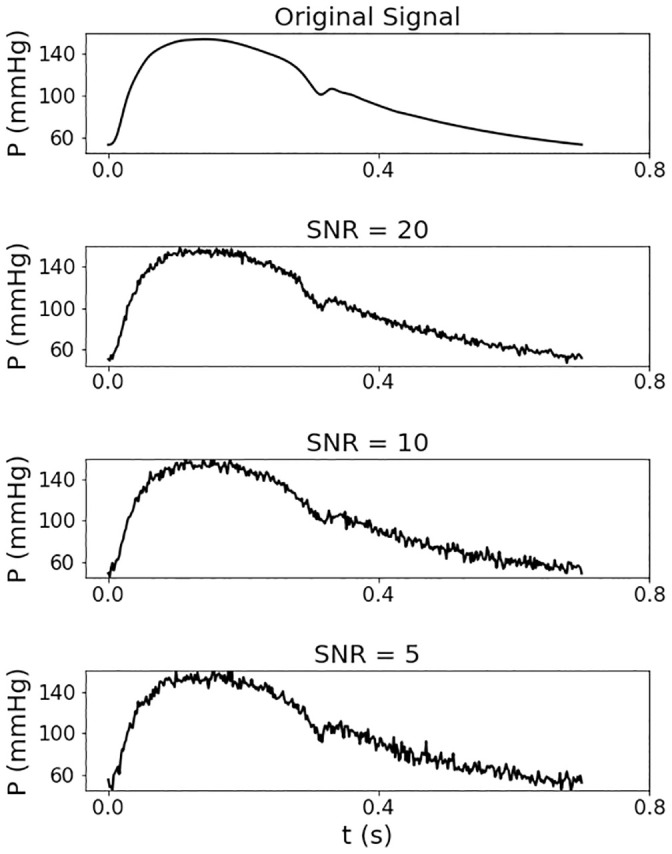
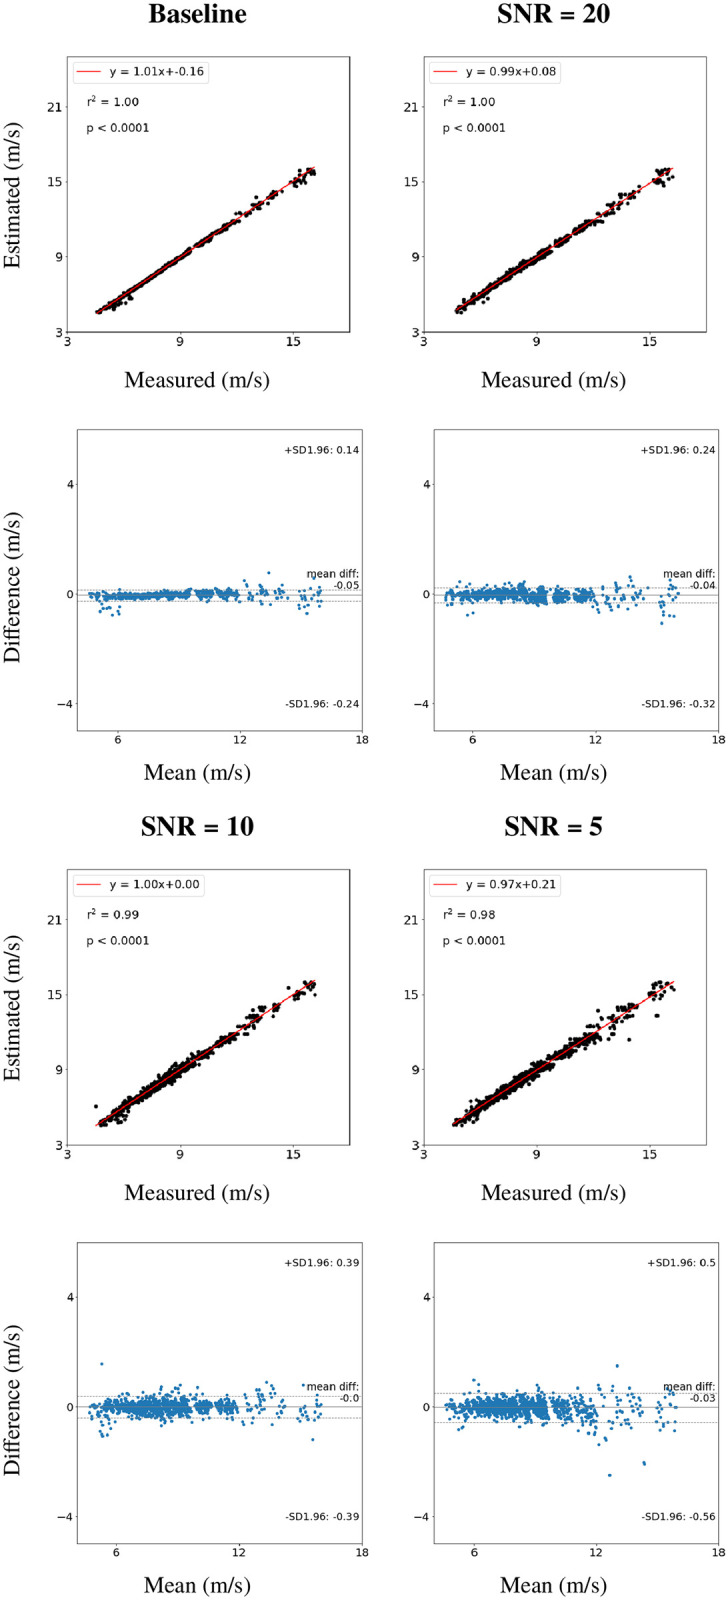
One of the European gold standard measurement of vascular ageing, a risk factor for cardiovascular disease, is the carotid-femoral pulse wave velocity (cfPWV), which requires an experienced operator to measure pulse waves at two sites. In this work, two machine learning pipelines were proposed to estimate cfPWV from the peripheral pulse wave measured at a single site, the radial pressure wave measured by applanation tonometry. The study populations were the Twins UK cohort containing 3,082 subjects aged from 18 to 110 years, and a database containing 4,374 virtual subjects aged from 25 to 75 years. The first pipeline uses Gaussian process regression to estimate cfPWV from features extracted from the radial pressure wave using pulse wave analysis. The mean difference and upper and lower limits of agreement (LOA) of the estimation on the 924 hold-out test subjects from the Twins UK cohort were 0.2 m/s, and 3.75 m/s & -3.34 m/s, respectively. The second pipeline uses a recurrent neural network (RNN) to estimate cfPWV from the entire radial pressure wave. The mean difference and upper and lower LOA of the estimation on the 924 hold-out test subjects from the Twins UK cohort were 0.05 m/s, and 3.21 m/s & -3.11m/s, respectively. The percentage error of the RNN estimates on the virtual subjects increased by less than 2% when adding 20% of random noise to the pressure waveform. These results show the possibility of assessing the vascular ageing using a single peripheral pulse wave (e.g. the radial pressure wave), instead of cfPWV. The proposed code for the machine learning pipelines is available from the following online depository (https://github.com/WeiweiJin/Estimate-Cardiovascular-Risk-from-Pulse-Wave-Signal).
Conflict of interest statement
The authors have declared that no competing interests exist.
Figures
Similar articles
-
Clinical Validation of Carotid-Femoral Pulse Wave Velocity Measurement Using a Multi-Beam Laser Vibrometer: The CARDIS Study.Hypertension. 2024 Sep;81(9):1986-1995. doi: 10.1161/HYPERTENSIONAHA.124.22729. Epub 2024 Jun 27. Hypertension. 2024. PMID: 38934112 Free PMC article. Clinical Trial.
-
Estimation of central pulse wave velocity from radial pulse wave analysis.Comput Methods Programs Biomed. 2022 Jun;219:106781. doi: 10.1016/j.cmpb.2022.106781. Epub 2022 Mar 27. Comput Methods Programs Biomed. 2022. PMID: 35378395
-
The Relationships Among Atherogenic Index of Plasma and Carotid-Femoral Pulse Wave Velocity in Adults.J Clin Hypertens (Greenwich). 2024 Dec;26(12):1424-1432. doi: 10.1111/jch.14910. Epub 2024 Oct 15. J Clin Hypertens (Greenwich). 2024. PMID: 39403044 Free PMC article.
-
Cardiometabolic Health and Carotid-Femoral Pulse Wave Velocity in Children: A Systematic Review and Meta-Regression.J Pediatr. 2020 Mar;218:98-105.e3. doi: 10.1016/j.jpeds.2019.10.065. Epub 2019 Dec 4. J Pediatr. 2020. PMID: 31810627 Free PMC article.
-
Cardiovascular Responses to Muscle Stretching: A Systematic Review and Meta-analysis.Int J Sports Med. 2021 Jun;42(6):481-493. doi: 10.1055/a-1312-7131. Epub 2021 Jan 13. Int J Sports Med. 2021. PMID: 33440445
Cited by
-
Machine Learning for Aiding Blood Flow Velocity Estimation Based on Angiography.Bioengineering (Basel). 2022 Oct 28;9(11):622. doi: 10.3390/bioengineering9110622. Bioengineering (Basel). 2022. PMID: 36354533 Free PMC article.
-
Association between estimated pulse wave velocity and in-hospital mortality of patients with acute kidney injury: a retrospective cohort analysis of the MIMIC-IV database.Ren Fail. 2024 Dec;46(1):2313172. doi: 10.1080/0886022X.2024.2313172. Epub 2024 Feb 15. Ren Fail. 2024. PMID: 38357758 Free PMC article.
-
Central Arterial Dynamic Evaluation from Peripheral Blood Pressure Waveforms Using CycleGAN: An In Silico Approach.Sensors (Basel). 2023 Feb 1;23(3):1559. doi: 10.3390/s23031559. Sensors (Basel). 2023. PMID: 36772599 Free PMC article.
-
Noninvasive hemodynamic indices of vascular aging: an in silico assessment.Am J Physiol Heart Circ Physiol. 2023 Dec 1;325(6):H1290-H1303. doi: 10.1152/ajpheart.00454.2023. Epub 2023 Sep 22. Am J Physiol Heart Circ Physiol. 2023. PMID: 37737734 Free PMC article.
-
Use of a rat model to characterize 35 arterial pulse wave parameters in a comparative study of isoflurane and Zoletil/xylazine anesthesia and the effect of Acanthopanax senticosus extract.Animal Model Exp Med. 2023 Oct;6(5):474-488. doi: 10.1002/ame2.12354. Epub 2023 Oct 12. Animal Model Exp Med. 2023. PMID: 37828718 Free PMC article.
References
-
- Gomez-Sanchez M, Gomez-Sanchez L, Patino-Alonso MC, Cunha PG, Recio-Rodriguez JI, Alonso-Dominguez R, et al.. Vascular aging and its relationship with lifestyles and other risk factors in the general Spanish population: Early Vascular Ageing Study. Journal of hypertension. 2020;38(6):1110–1122. doi: 10.1097/HJH.0000000000002373 - DOI - PubMed
Publication types
MeSH terms
Grants and funding
LinkOut - more resources
Full Text Sources
Other Literature Sources
