The Warburg effect as a therapeutic target for bladder cancers and intratumoral heterogeneity in associated molecular targets
- PMID: 34181805
- PMCID: PMC8409428
- DOI: 10.1111/cas.15047
The Warburg effect as a therapeutic target for bladder cancers and intratumoral heterogeneity in associated molecular targets
Abstract
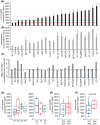
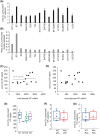
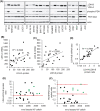
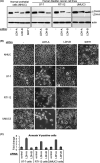
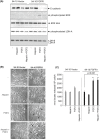
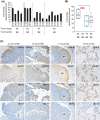
Bladder cancer is the 10th most common cancer worldwide. For muscle-invasive bladder cancer (MIBC), treatment includes radical cystectomy, radiotherapy, and chemotherapy; however, the outcome is generally poor. For non-muscle-invasive bladder cancer (NMIBC), tumor recurrence is common. There is an urgent need for more effective and less harmful therapeutic approaches. Here, bladder cancer cell metabolic reprogramming to rely on aerobic glycolysis (the Warburg effect) and expression of associated molecular therapeutic targets by bladder cancer cells of different stages and grades, and in freshly resected clinical tissue, is investigated. Importantly, analyses indicate that the Warburg effect is a feature of both NMIBCs and MIBCs. In two in vitro inducible epithelial-mesenchymal transition (EMT) bladder cancer models, EMT stimulation correlated with increased lactate production, the end product of aerobic glycolysis. Protein levels of lactate dehydrogenase A (LDH-A), which promotes pyruvate enzymatic reduction to lactate, were higher in most bladder cancer cell lines (compared with LDH-B, which catalyzes the reverse reaction), but the levels did not closely correlate with aerobic glycolysis rates. Although LDH-A is expressed in normal urothelial cells, LDH-A knockdown by RNAi selectively induced urothelial cancer cell apoptotic death, whereas normal cells were unaffected-identifying LDH-A as a cancer-selective therapeutic target for bladder cancers. LDH-A and other potential therapeutic targets (MCT4 and GLUT1) were expressed in patient clinical specimens; however, positive staining varied in different areas of sections and with distance from a blood vessel. This intratumoral heterogeneity has important therapeutic implications and indicates the possibility of tumor cell metabolic coupling.
Keywords: Warburg effect; epithelial-mesenchymal transition; intratumoral heterogeneity; lactate dehydrogenase A; non-muscle-invasive and muscle-invasive bladder cancers.
© 2021 The Authors. Cancer Science published by John Wiley & Sons Australia, Ltd on behalf of Japanese Cancer Association.
Conflict of interest statement
The authors declare that they have no conflict of interest.
Figures

Similar articles
-
LDH-A promotes malignant progression via activation of epithelial-to-mesenchymal transition and conferring stemness in muscle-invasive bladder cancer.Biochem Biophys Res Commun. 2016 Jan 22;469(4):985-92. doi: 10.1016/j.bbrc.2015.12.078. Epub 2015 Dec 22. Biochem Biophys Res Commun. 2016. PMID: 26721441
-
Slug contributes to cadherin switch and malignant progression in muscle-invasive bladder cancer development.Urol Oncol. 2013 Nov;31(8):1751-60. doi: 10.1016/j.urolonc.2012.02.001. Epub 2012 Mar 14. Urol Oncol. 2013. PMID: 22421353
-
Lactate dehydrogenase A negatively regulated by miRNAs promotes aerobic glycolysis and is increased in colorectal cancer.Oncotarget. 2015 Aug 14;6(23):19456-68. doi: 10.18632/oncotarget.3318. Oncotarget. 2015. PMID: 26062441 Free PMC article.
-
Lactate dehydrogenase 5: an old friend and a new hope in the war on cancer.Cancer Lett. 2015 Mar 1;358(1):1-7. doi: 10.1016/j.canlet.2014.12.035. Epub 2014 Dec 17. Cancer Lett. 2015. PMID: 25528630 Review.
-
Metabolic phenotype of bladder cancer.Cancer Treat Rev. 2016 Apr;45:46-57. doi: 10.1016/j.ctrv.2016.03.005. Epub 2016 Mar 8. Cancer Treat Rev. 2016. PMID: 26975021 Review.
Cited by
-
Epigenetic dysregulation-induced metabolic reprogramming fuels tumor progression in bladder cancer.Front Mol Biosci. 2025 Jun 23;12:1602700. doi: 10.3389/fmolb.2025.1602700. eCollection 2025. Front Mol Biosci. 2025. PMID: 40626022 Free PMC article.
-
The Oligostilbene Gnetin H Is a Novel Glycolysis Inhibitor That Regulates Thioredoxin Interacting Protein Expression and Synergizes with OXPHOS Inhibitor in Cancer Cells.Int J Mol Sci. 2023 Apr 23;24(9):7741. doi: 10.3390/ijms24097741. Int J Mol Sci. 2023. PMID: 37175448 Free PMC article.
-
Knockdown of LINC00467 inhibits gastric cancer progression by modulating the sequestration of miR-141-3p.Oncol Lett. 2025 Jul 24;30(4):459. doi: 10.3892/ol.2025.15205. eCollection 2025 Oct. Oncol Lett. 2025. PMID: 40776904 Free PMC article.
-
Prognostic significance and immunoinfiltration analysis of genes associated with epithelial-mesenchymal transition and energy metabolism in bladder urothelial carcinoma.Aging (Albany NY). 2023 Nov 24;15(22):13312-13328. doi: 10.18632/aging.205242. Epub 2023 Nov 24. Aging (Albany NY). 2023. PMID: 38015710 Free PMC article.
-
Targeted therapies in bladder cancer: signaling pathways, applications, and challenges.MedComm (2020). 2023 Dec 15;4(6):e455. doi: 10.1002/mco2.455. eCollection 2023 Dec. MedComm (2020). 2023. PMID: 38107059 Free PMC article. Review.
References
-
- Bray F, Ferlay J, Soerjomataram I, Siegel RL, Torre LA, Jemal A. Global cancer statistics 2018: GLOBOCAN estimates of incidence and mortality worldwide for 36 cancers in 185 countries. CA Cancer J Clin. 2018;68:394‐424. - PubMed
-
- Sternberg CN, Bellmunt J, Sonpavde G, et al. ICUD‐EAU International Consultation on Bladder Cancer 2012: chemotherapy for urothelial carcinoma‐neoadjuvant and adjuvant settings. Eur Urol. 2013;63:58‐66. - PubMed
-
- Babjuk M, Böhle A, Burger M, et al. EAU guidelines on non‐muscle‐invasive urothelial carcinoma of the bladder: update 2016. Eur Urol. 2017;71:447‐461. - PubMed
-
- van Kessel KE, Zuiverloon TC, Alberts AR, Boormans JL, Zwarthoff EC. Targeted therapies in bladder cancer: an overview of in vivo research. Nat Rev Urol. 2015;12:681‐694. - PubMed
MeSH terms
Substances
Grants and funding
LinkOut - more resources
Full Text Sources
Medical
Miscellaneous

