Review
. 2021 Oct 1:239:118316.
doi: 10.1016/j.neuroimage.2021.118316. Epub 2021 Jun 26.

Learning to estimate the fiber orientation distribution function from diffusion-weighted MRI

Affiliations
Review

Learning to estimate the fiber orientation distribution function from diffusion-weighted MRI

Davood Karimi et al. Neuroimage. .

Abstract

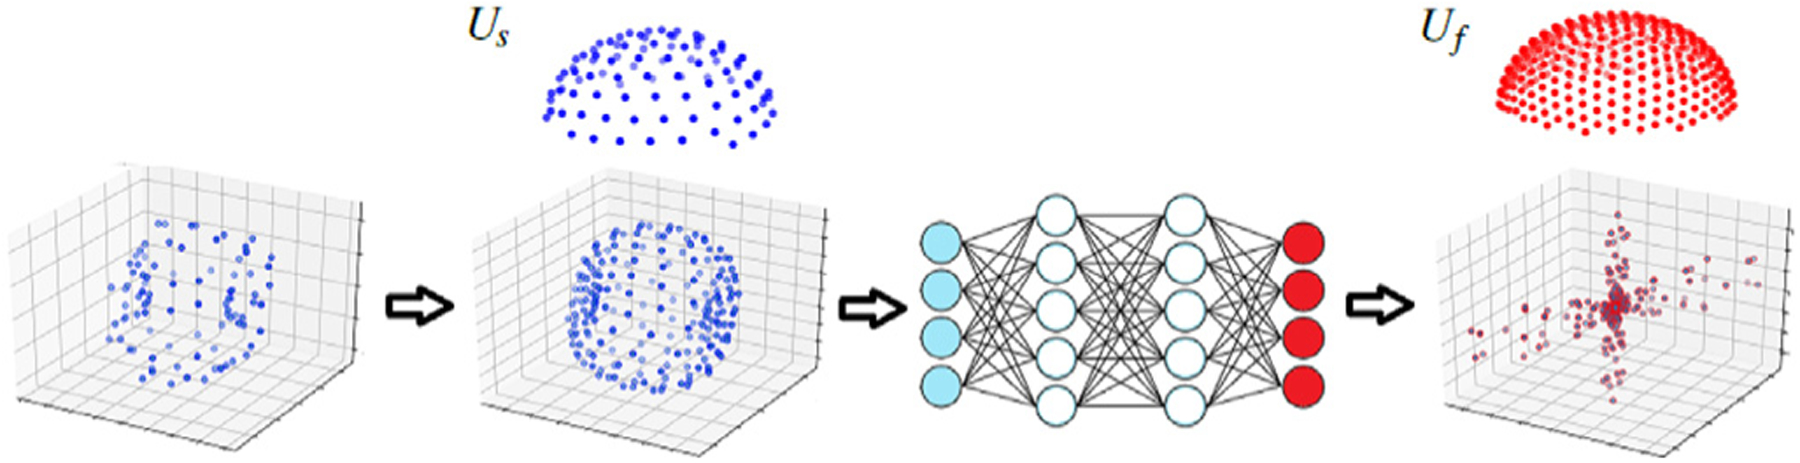
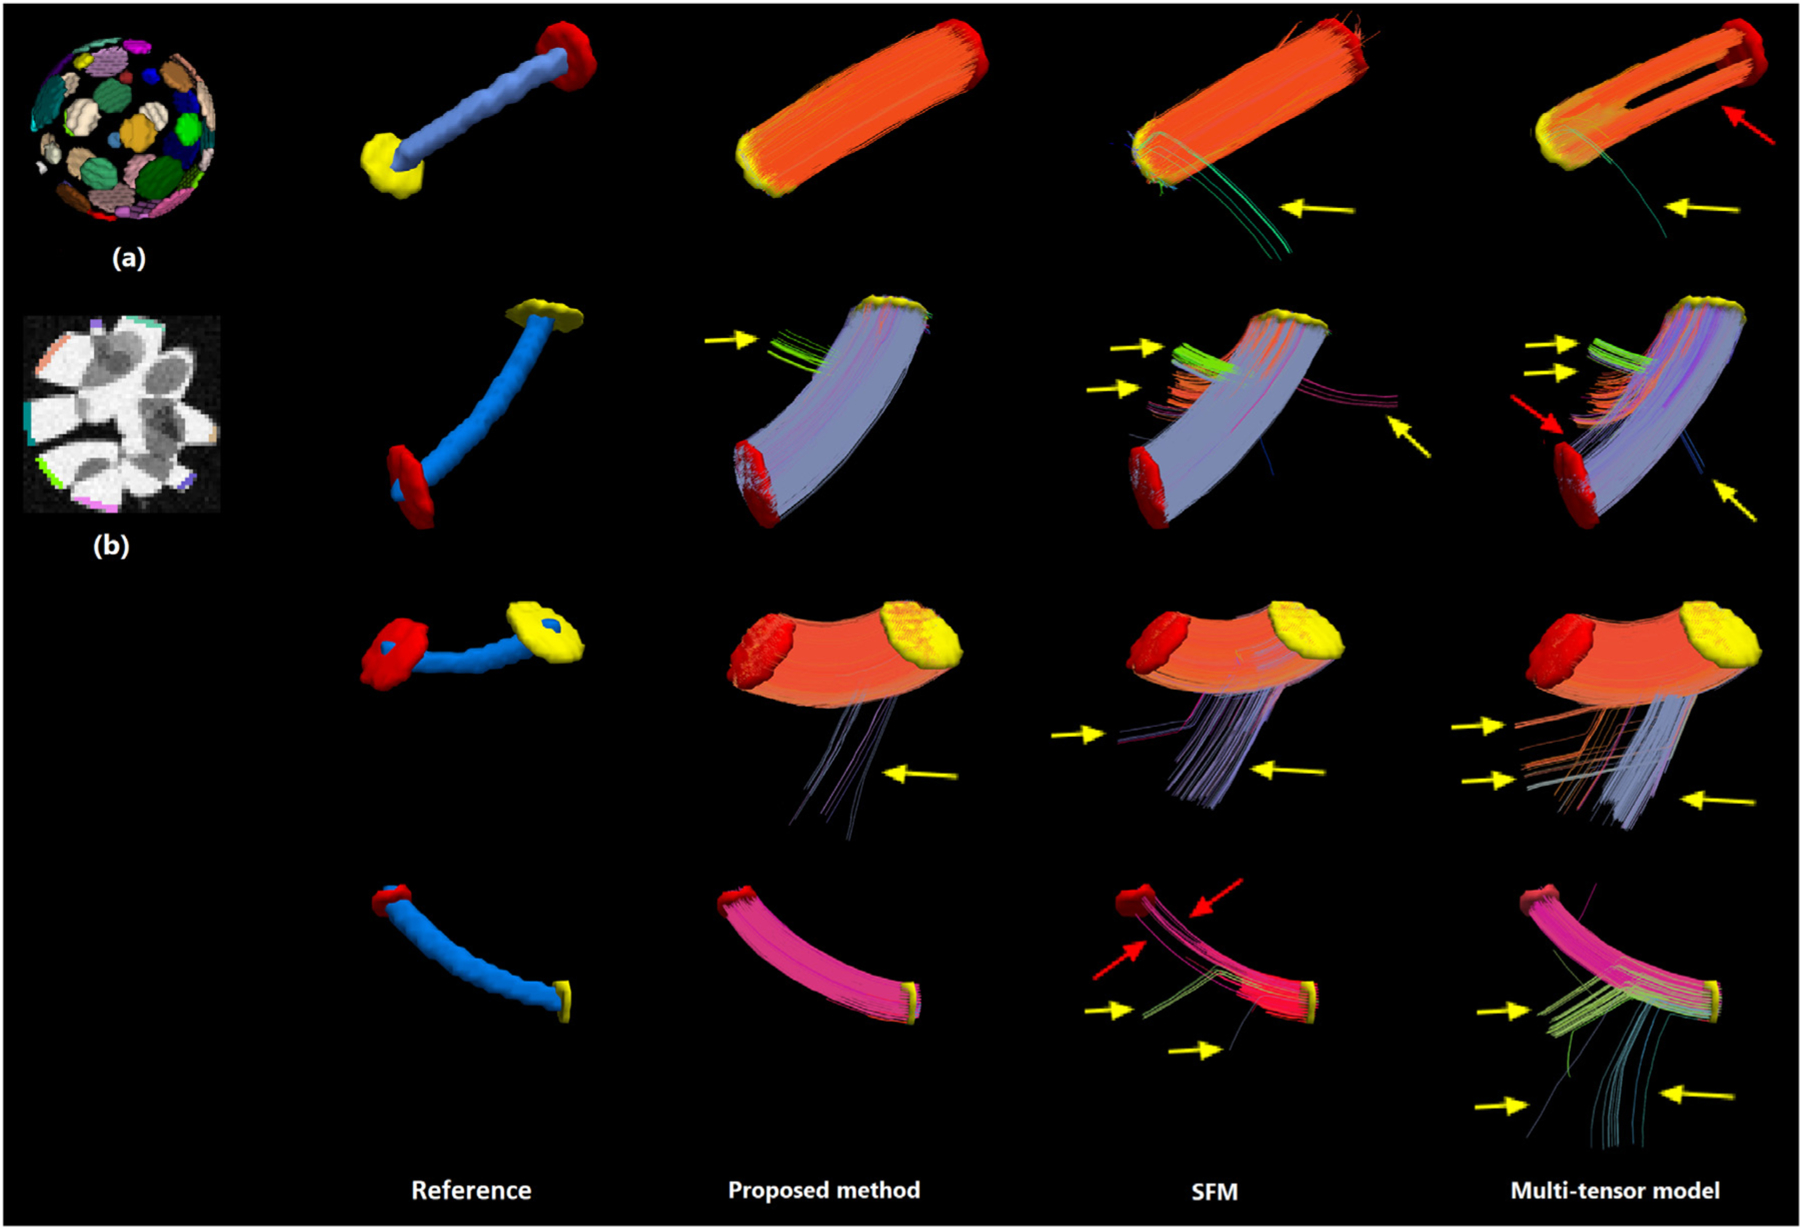
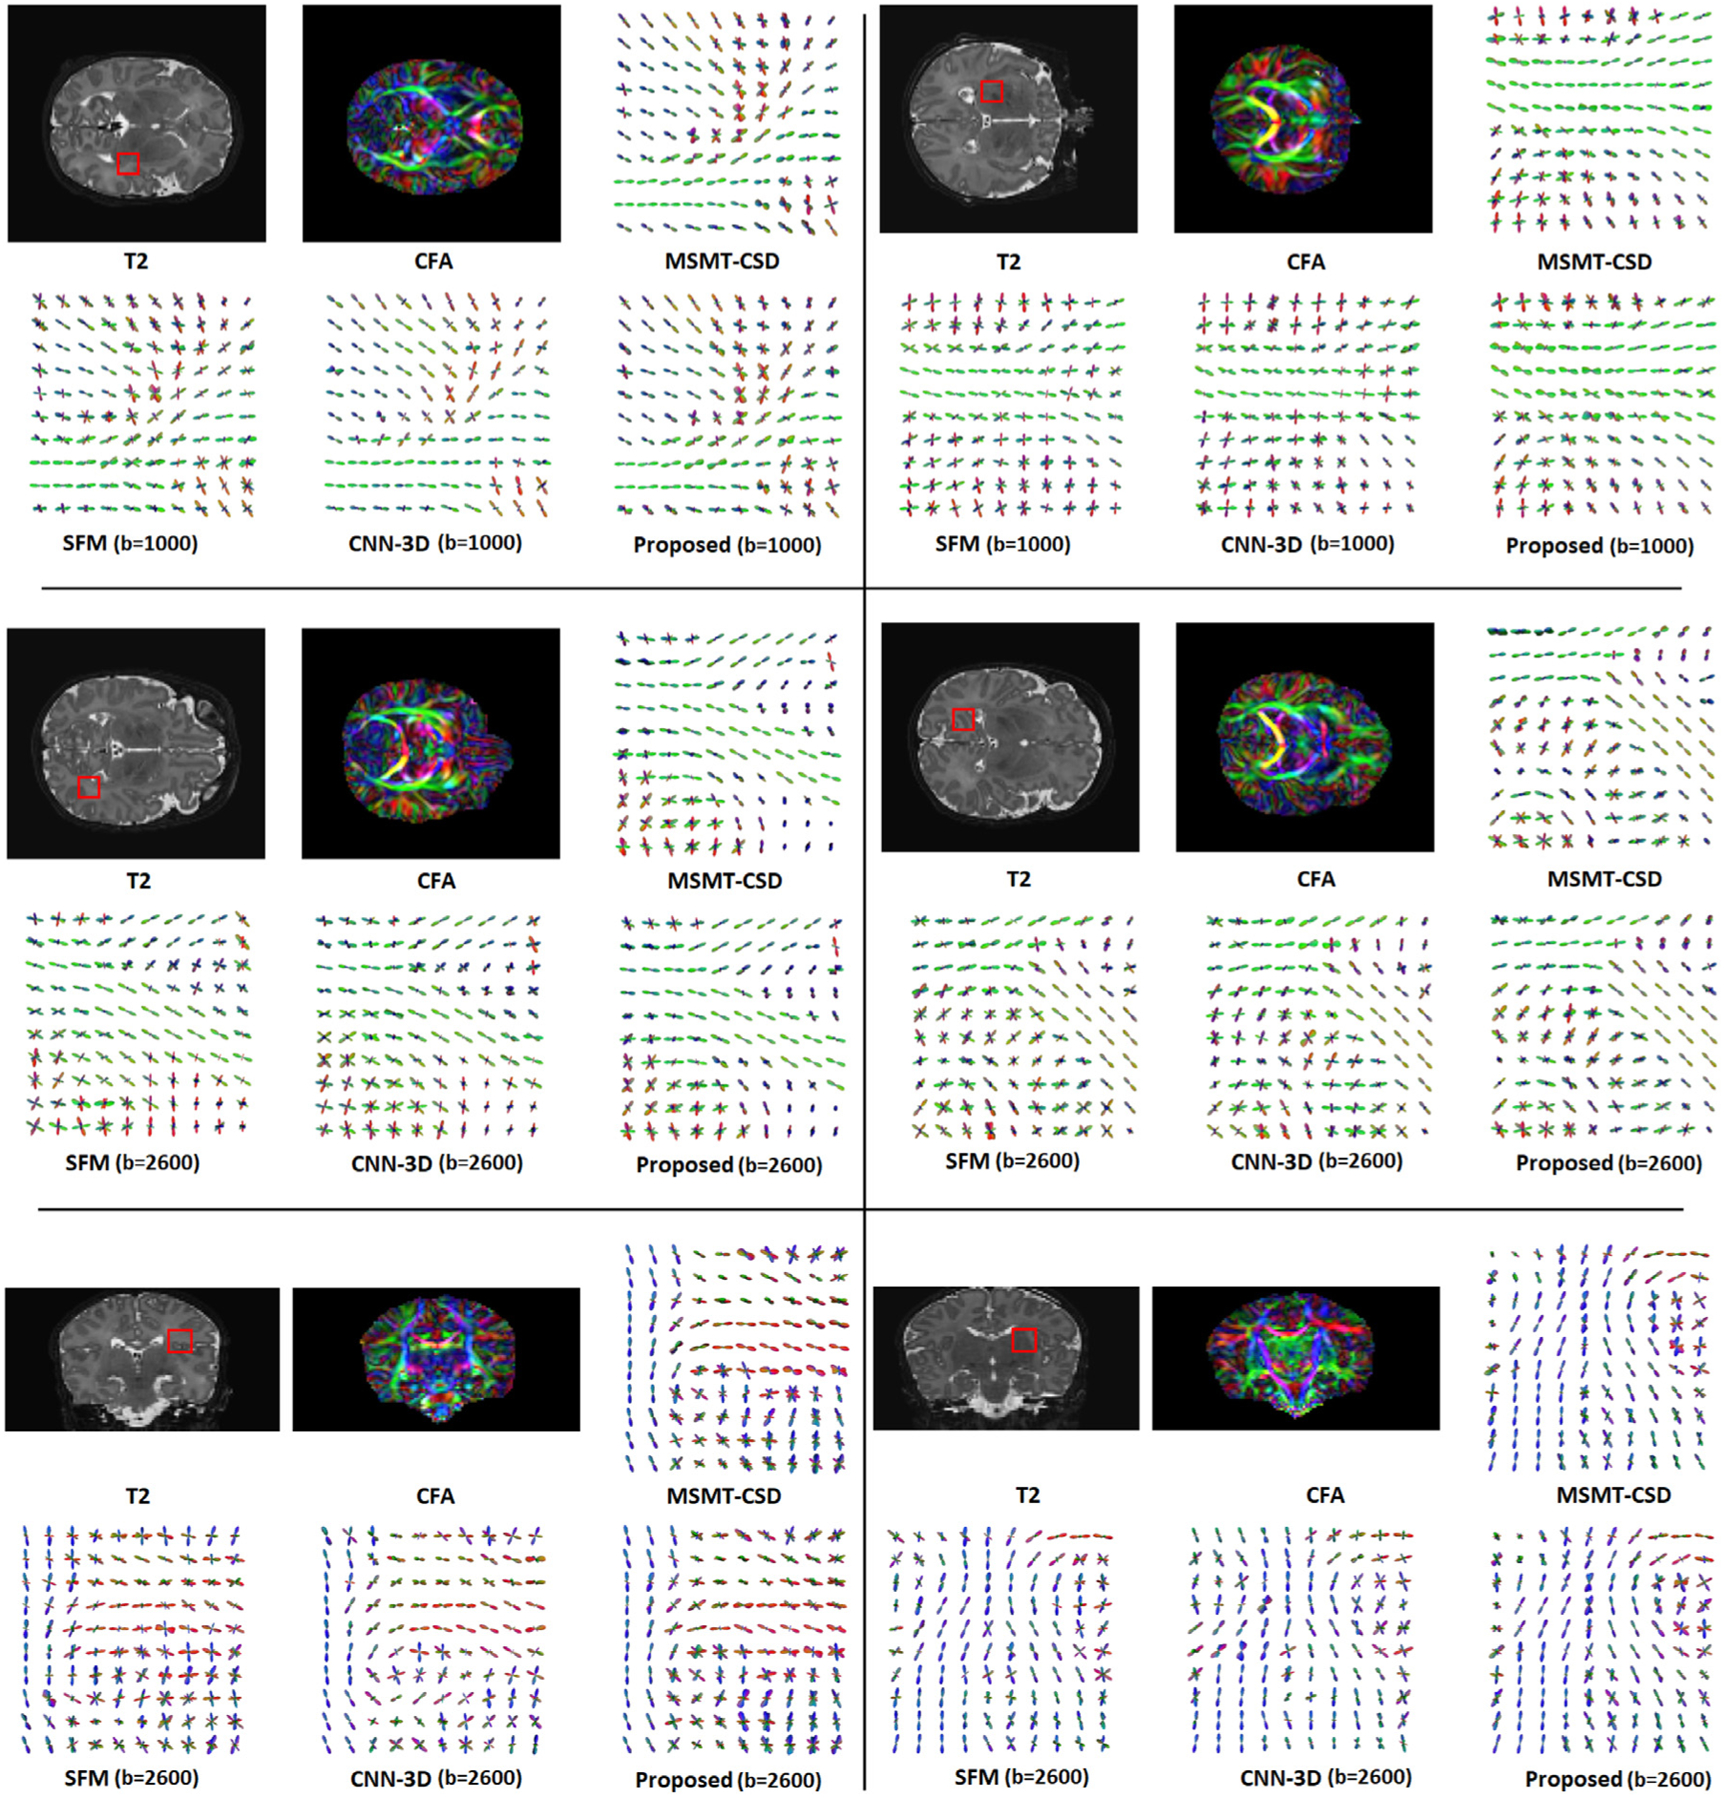
Estimation of white matter fiber orientation distribution function (fODF) is the essential first step for reliable brain tractography and connectivity analysis. Most of the existing fODF estimation methods rely on sub-optimal physical models of the diffusion signal or mathematical simplifications, which can impact the estimation accuracy. In this paper, we propose a data-driven method that avoids some of these pitfalls. Our proposed method is based on a multilayer perceptron that learns to map the diffusion-weighted measurements, interpolated onto a fixed spherical grid in the q space, to the target fODF. Importantly, we also propose methods for synthesizing reliable simulated training data. We show that the model can be effectively trained with simulated or real training data. Our phantom experiments show that the proposed method results in more accurate fODF estimation and tractography than several competing methods including the multi-tensor model, Bayesian estimation, spherical deconvolution, and two other machine learning techniques. On real data, we compare our method with other techniques in terms of accuracy of estimating the ground-truth fODF. The results show that our method is more accurate than other methods, and that it performs better than the competing methods when applied to under-sampled diffusion measurements. We also compare our method with the Sparse Fascicle Model in terms of expert ratings of the accuracy of reconstruction of several commissural, projection, association, and cerebellar tracts. The results show that the tracts reconstructed with the proposed method are rated significantly higher by three independent experts. Our study demonstrates the potential of data-driven methods for improving the accuracy and robustness of fODF estimation.

Keywords: Deep learning; Diffusion tensor imaging; Diffusion-weighted MRI; Machine learning; fiber orientation distribution.


Figures

Fig. 1.
Fig. 1.
A schematic representation of the main steps of the proposed method. The raw diffusion signal measured with an arbitrary gradient table is re-sampled onto a fixed hemi-spherical grid, Us. This will form the input to the MLP, which predicts the fODF directly on the target hemi-spherical grid, Uf. In this schematic, we have shown the example interpolated signal and the predicted fODF using their symmetric representation on the full sphere for better illustration.
Fig. 2.
Fig. 2.
(a) Plot of the Orientation Dispersion Index (ODI) versus the parameter p used to generate fODFs in Eq. (3). (b) Example single-fiber fODFs generated with different values of p.
Fig. 3.
Fig. 3.
A comparison of the tract bundles reconstructed with SFM, multi-tensor model, and the proposed method on the HARDI-2013 phantom. Part (a) of the figure shows how the seed and target ROIs are distributed in 3D. Part (b) shows a slice through the FA image of the phantom in gray-scale with some of the ROIs marked in color. On the right side of the figure, we have shown four seed-target ROI pairs and the bundles reconstructed using the fODFs estimated with the proposed method, SFM, and the multi-tensor method. In each of these four rows, the seed ROI is shown with a yellow disk and the target ROI is shown with a red disk. In the Reference column, the blue cylinder shows the dilated center-line of the true bundle connecting the seed to the target. On the bundles reconstructed with different methods, yellow arrows indicate streamlines diverging from the correct tract path, and red arrows indicate missing streamlines.
Fig. 4.
Fig. 4.
Illustration of the fODFs estimated by the proposed method and two competing techniques. For each of the six displayed cases, the top row shows the T2 image, the CFA image, and the reference fODF estimated with MSMT-CSD using measurements in all three shells. A red square on the T2 image shows the location of the ROI that is selected for displaying the fODFs. In the bottom row for each case we have displayed the fODFs estimated by SFM, CNN-3D, and our proposed method. These single-shell methods were applied on the measurements in either b = 1000 shell of b = 2600 shell. This has been indicated next to the names of these methods.
Fig. 5.
Fig. 5.
Examples fiber tracts dissected from the whole-brain connectomes reconstructed using fODFs estimated with our method (A,C,E) and with SFM (B,D,F). We note that tractography is only an indirect way of assessing fODF estimation methods, and since tractography algorithms are known to have high rates of type I errors (Maier-Hein et al., 2017), they may not show the full range of differences between fODF estimation methods. Knowing this fact, we used the same fiber tracking algorithm (Garyfallidis, 2013) to evaluate the relative impact of our method and SFM on fiber tracking. (A,B) show the cingulum in red and the inferior fronto-occipital fasciculus (IFOF) in green. Compared to (A), the cingulum fibers were terminated early in (B) (arrowhead). (A) shows better delineation of the IFOF with less spurious tracts compared to (B) (arrow). (C,D) show the corticospinal tracts (CST) in blue. Compared to (D), our method (C) showed much better delineation of the CST including better delineation of CST projections into the cortex, whereas the tracts were terminated immaturely in an area of crossing fibers in (D) (arrow). (E,F) show the forceps major (purple) and forceps minor (yellow). For both of these tracts, our method (E) resulted in less spurious fibers than SFM (F) (arrow).

References

    1. Aganj I, Lenglet C, Sapiro G, Yacoub E, Ugurbil K, Harel N, 2010. Reconstruction of the orientation distribution function in single-and multiple-shell q-ball imaging within constant solid angle. Magn. Reson. Med 64, 554–566. - PMC - PubMed
    1. Aliotta E, Nourzadeh H, Sanders J, Muller D, Ennis DB, 2019. Highly accelerated, model-free diffusion tensor MRI reconstruction using neural networks. Med. Phys 46, 1581–1591. - PubMed
    1. Anderson AW, 2005. Measurement of fiber orientation distributions using high angular resolution diffusion imaging. Magn. Reson. Med. Off. J. Int. Soc. Magn. Reson. Med 54, 1194–1206. - PubMed
    1. Assaf Y, Basser PJ, 2005. Composite hindered and restricted model of diffusion (charmed) mr imaging of the human brain. Neuroimage 27, 48–58. - PubMed
    1. Basser PJ, Mattiello J, LeBihan D, 1994. Mr diffusion tensor spectroscopy and imaging. Biophys. J 66, 259–267. - PMC - PubMed

Publication types