. 2021 Aug:282:114157.
doi: 10.1016/j.socscimed.2021.114157. Epub 2021 Jun 21.

From causal loop diagrams to future scenarios: Using the cross-impact balance method to augment understanding of urban health in Latin America

Affiliations

From causal loop diagrams to future scenarios: Using the cross-impact balance method to augment understanding of urban health in Latin America

Ivana Stankov et al. Soc Sci Med. 2021 Aug.

Abstract

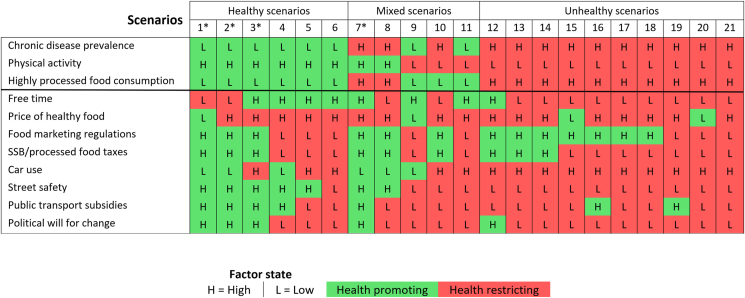
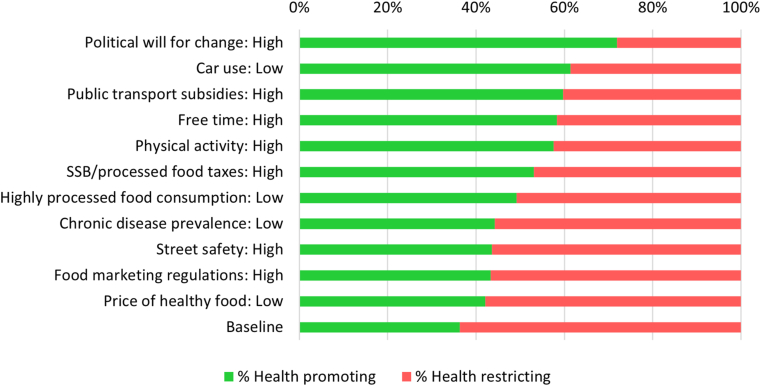
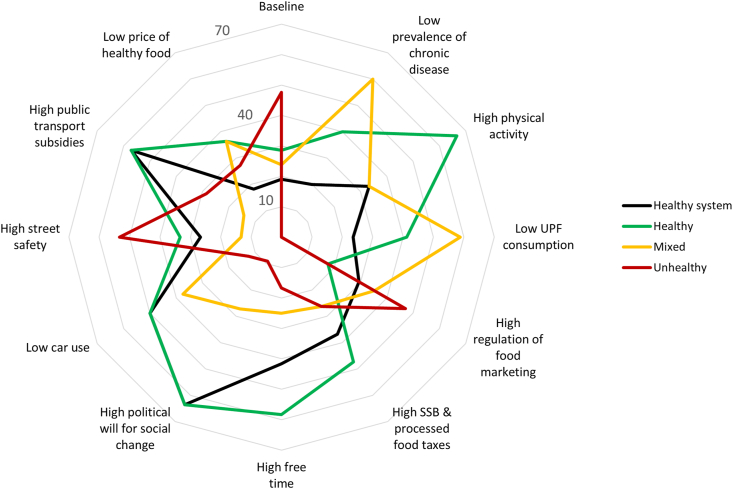
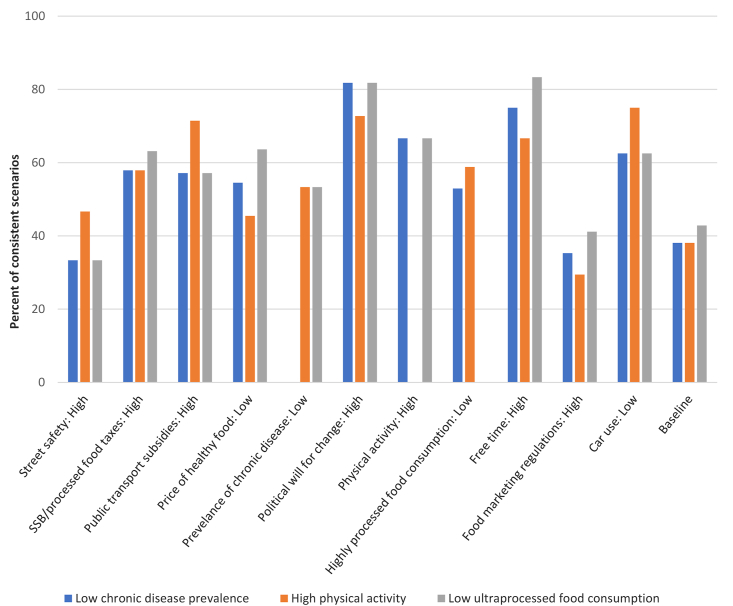
Urban health is shaped by a system of factors spanning multiple levels and scales, and through a complex set of interactions. Building on causal loop diagrams developed via several group model building workshops, we apply the cross-impact balance (CIB) method to understand the strength and nature of the relationships between factors in the food and transportation system, and to identify possible future urban health scenarios (i.e., permutations of factor states that impact health in cities). We recruited 16 food and transportation system experts spanning private, academic, non-government, and policy sectors from six Latin American countries to complete an interviewer-assisted questionnaire. The questionnaire, which was pilot tested on six researchers, used a combination of questions and visual prompts to elicit participants' perceptions about the bivariate relationships between 11 factors in the food and transportation system. Each participant answered questions related to a unique set of relationships within their domain of expertise. Using CIB analysis, we identified 21 plausible future scenarios for the system. In the baseline model, 'healthy' scenarios (with low chronic disease, high physical activity, and low consumption of highly processed foods) were characterized by high public transportation subsidies, low car use, high street safety, and high free time, illustrating the links between transportation, free time and dietary behaviors. In analyses of interventions, low car use, high public transport subsidies and high free time were associated with the highest proportion of factors in a healthful state and with high proportions of 'healthy' scenarios. High political will for social change also emerged as critically important in promoting healthy systems and urban health outcomes. The CIB method can play a novel role in augmenting understandings of complex urban systems by enabling insights into future scenarios that can be used alongside other approaches to guide urban health policy planning and action.

Keywords: Chronic disease; Complex system; Cross-impact balance; Diet; Latin America; Transportation; Urban health.


Figures

Fig. 1
Fig. 1
Baseline scenario table showing the consistent scenarios or possible ‘futures’ identified using the CIB analysis for the three regions. These scenarios are represented in the numbered columns while the rows identify the key factors in the system. The cells in the table characterize the state of each factor within the system, where ‘L’ refers to a ‘low’ state and ‘H’ refers to a ‘high’ state. The colors highlight whether a given factor is in a health promoting (green) or health restricting (red) state while the higher-order column categories characterize whether scenarios were considered ‘healthy’, ‘mixed’ or ‘unhealthy’ based on the health promoting or health restricting state of the three outcome variables, namely, chronic disease prevalence, physical activity, and highly processed food consumption. Scenarios with an asterisk (*) are ‘salubrious system’ scenarios, defined as those with eight or more factors (>70%) in a healthy or health promoting state. (For interpretation of the references to color in this figure legend, the reader is referred to the Web version of this article.)
Fig. 2
Fig. 2
The percentage of factors in a health promoting state (green) across all identified consistent scenarios at baseline and when fixing or stabilizing the state of a given factor (y-axis). (For interpretation of the references to color in this figure legend, the reader is referred to the Web version of this article.)
Fig. 3
Fig. 3
Radar plot showing the baseline scenario and the impact of fixing or stabilizing a given factor state on the percentage of consistent scenarios defined as ‘healthy’ (green), ‘mixed’ (yellow), ‘unhealthy’ (red) and ‘salubrious system’ (black) scenarios. ‘Healthy’ outcome scenarios were those with low chronic disease prevalence, high physical activity, and low consumption of highly processed food, while ‘unhealthy’ scenarios were those with high chronic disease prevalence, low physical activity, and high consumption of highly processed food. ‘Mixed’ scenarios included chronic disease prevalence, physical activity and highly processed food consumption outcomes that were in both health promoting and health restricting states. The ‘salubrious system’ scenarios (a subset of the ‘healthy’ and ‘mixed’ outcome scenarios) were characterized by eight or more (i.e., >70%) factors in a health promoting state. (For interpretation of the references to color in this figure legend, the reader is referred to the Web version of this article.)
Fig. 4
Fig. 4
Percentage of consistent scenarios with low chronic disease prevalence (blue), high physical activity (orange) and low consumption of highly processed food (gray) at baseline and those that arise from the stabilizing influence of a given factor state (x-axis) across the three regions. (For interpretation of the references to color in this figure legend, the reader is referred to the Web version of this article.)

References

    1. Arango C.M., Páez D.C., Reis R.S., Brownson R.C., Parra D.C. Association between the perceived environment and physical activity among adults in Latin America: a systematic review. Int. J. Behav. Nutr. Phys. Activ. 2013;10:122. - PMC - PubMed
    1. Auchincloss A.H., Riolo R.L., Brown D.G., Cook J., Diez-Roux A.V. An agent-based model of income inequalities in diet in the context of residential segregation. Am. J. Prev. Med. 2011;40:303–311. - PMC - PubMed
    1. Barrientos-Gutierrez T., Moore K.A., Auchincloss A.H., Mujahid M.S., August C., Sanchez B.N. Neighborhood physical environment and changes in body mass index: results from the Multi-Ethnic Study of Atherosclerosis. Am. J. Epidemiol. 2017;186:1237–1245. - PMC - PubMed
    1. Branca F., Lartey A., Oenema S., Aguayo V., Stordalen G.A., Richardson R. Transforming the food system to fight non-communicable diseases. BMJ. 2019;364:l296. - PMC - PubMed
    1. Carey G., Malbon E., Carey N., Joyce A., Crammond B., Carey A. Systems science and systems thinking for public health: a systematic review of the field. BMJ Open. 2015;5 - PMC - PubMed

Publication types

LinkOut - more resources