. 2021 Sep 7;144(10):805-822.
doi: 10.1161/CIRCULATIONAHA.120.053047. Epub 2021 Jun 29.

Defective Flow-Migration Coupling Causes Arteriovenous Malformations in Hereditary Hemorrhagic Telangiectasia

Affiliations

Defective Flow-Migration Coupling Causes Arteriovenous Malformations in Hereditary Hemorrhagic Telangiectasia

Hyojin Park et al. Circulation. .

Abstract

Background: Activin receptor-like kinase 1 (ALK1) is an endothelial transmembrane serine threonine kinase receptor for BMP family ligands that plays a critical role in cardiovascular development and pathology. Loss-of-function mutations in the ALK1 gene cause type 2 hereditary hemorrhagic telangiectasia, a devastating disorder that leads to arteriovenous malformations. Here, we show that ALK1 controls endothelial cell polarization against the direction of blood flow and flow-induced endothelial migration from veins through capillaries into arterioles.

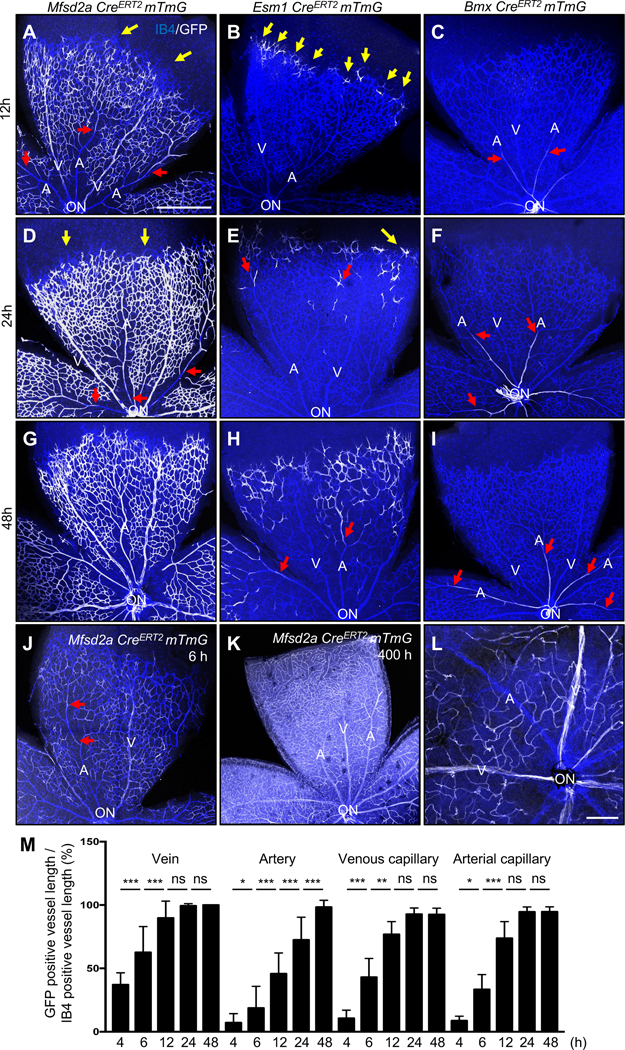
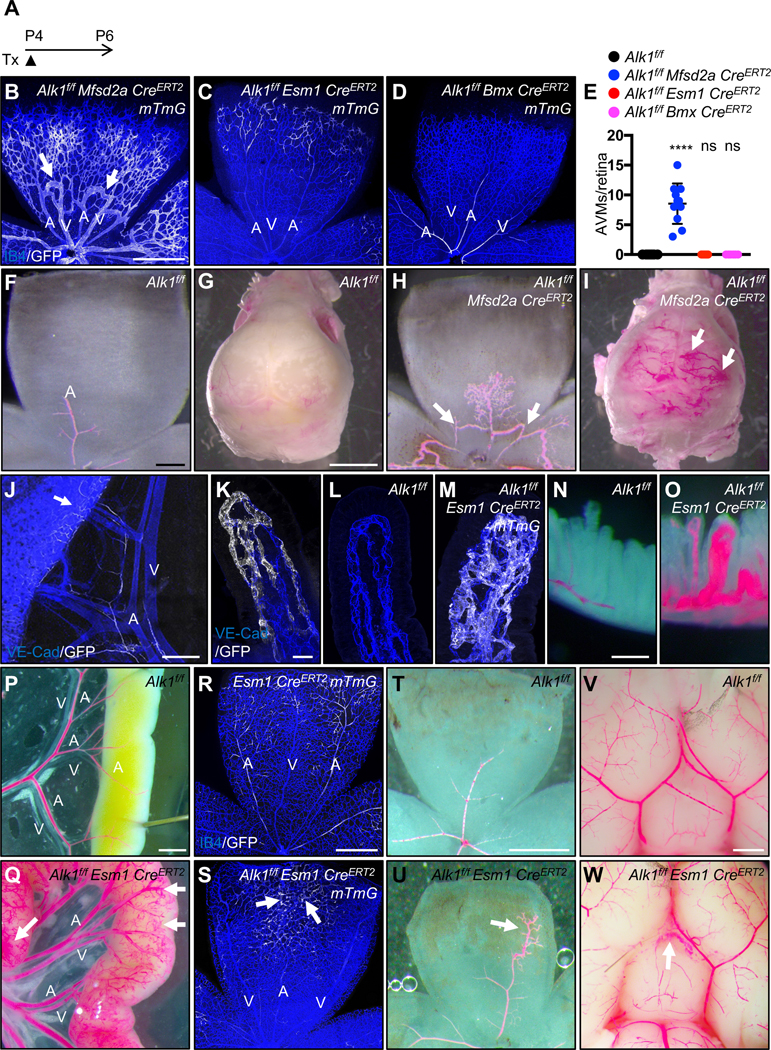
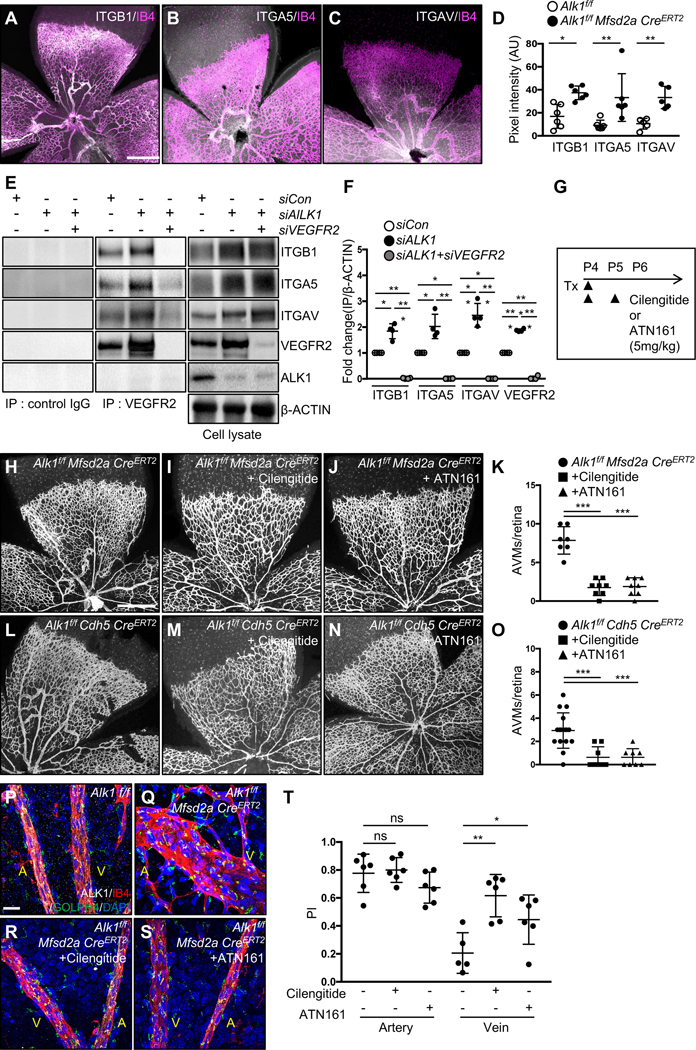
Methods: Using Cre lines that recombine in different subsets of arterial, capillary-venous, or endothelial tip cells, we show that capillary-venous Alk1 deletion was sufficient to induce arteriovenous malformation formation in the postnatal retina.

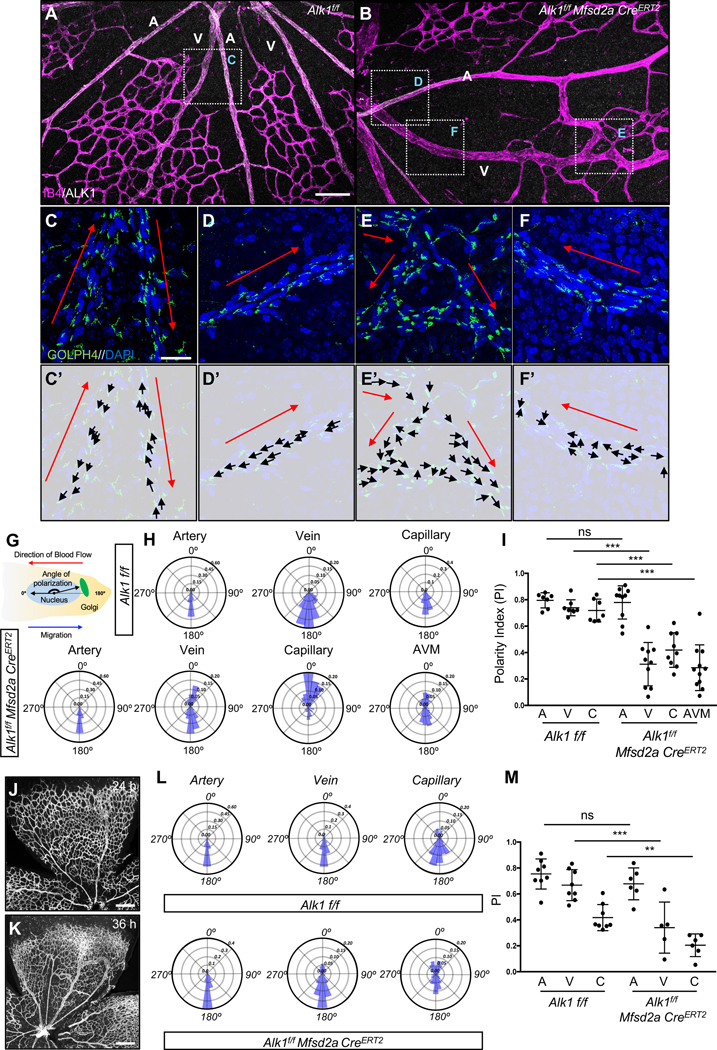
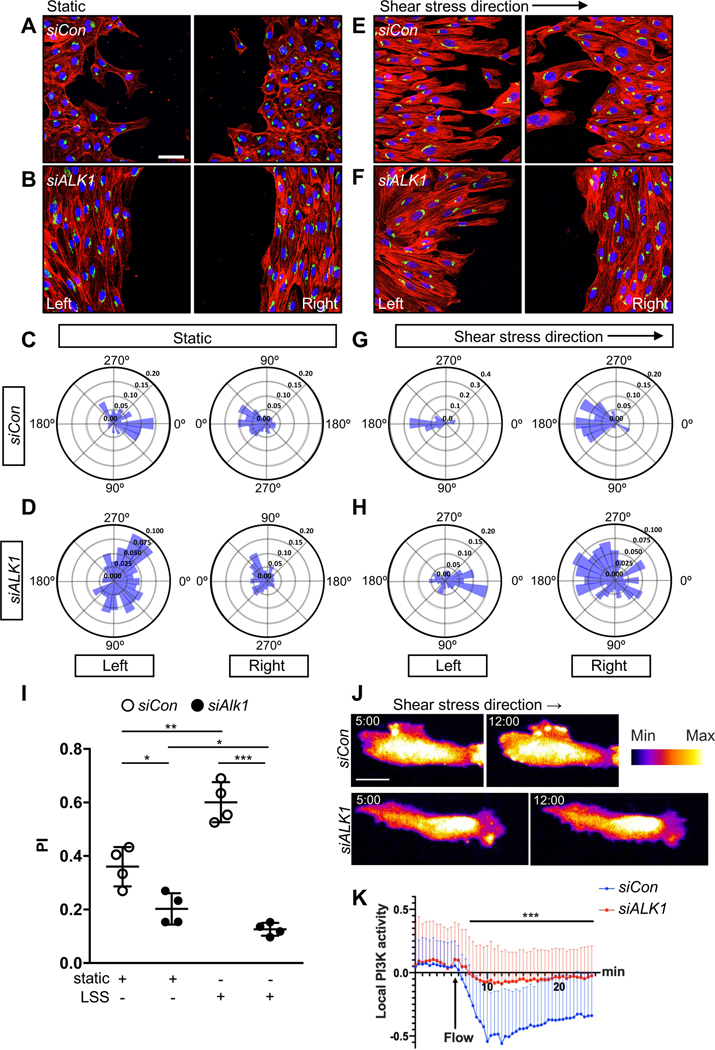
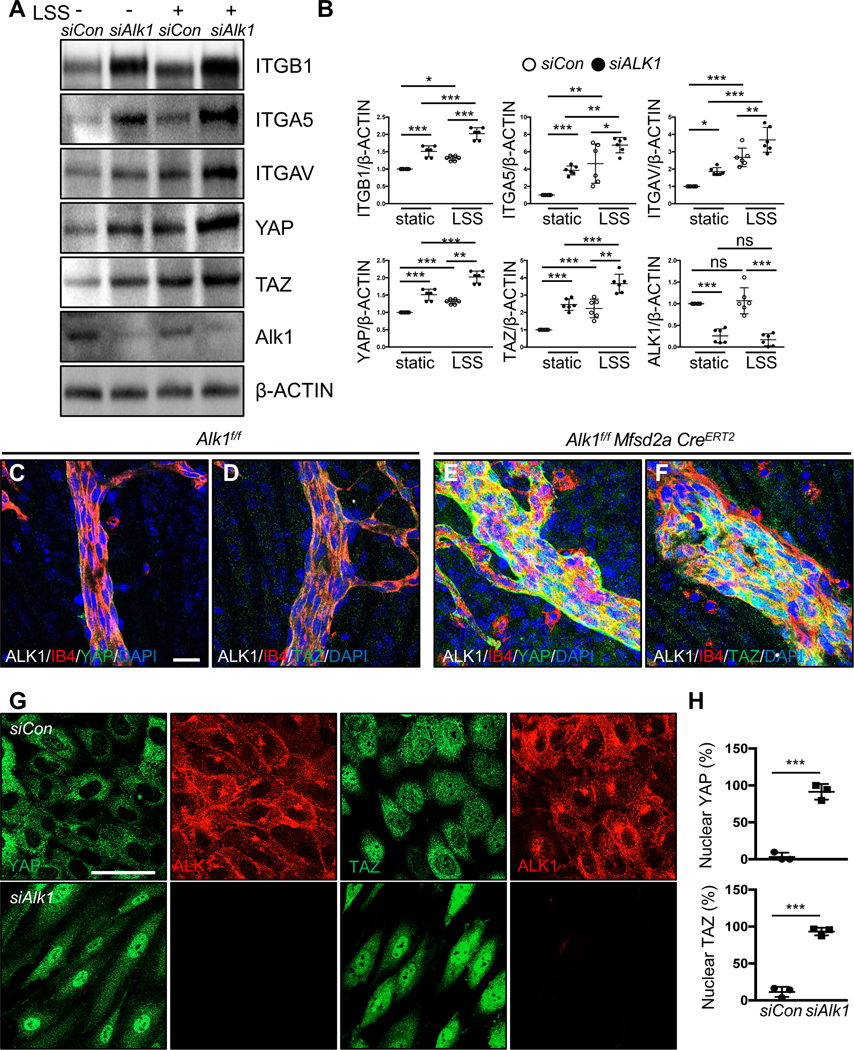
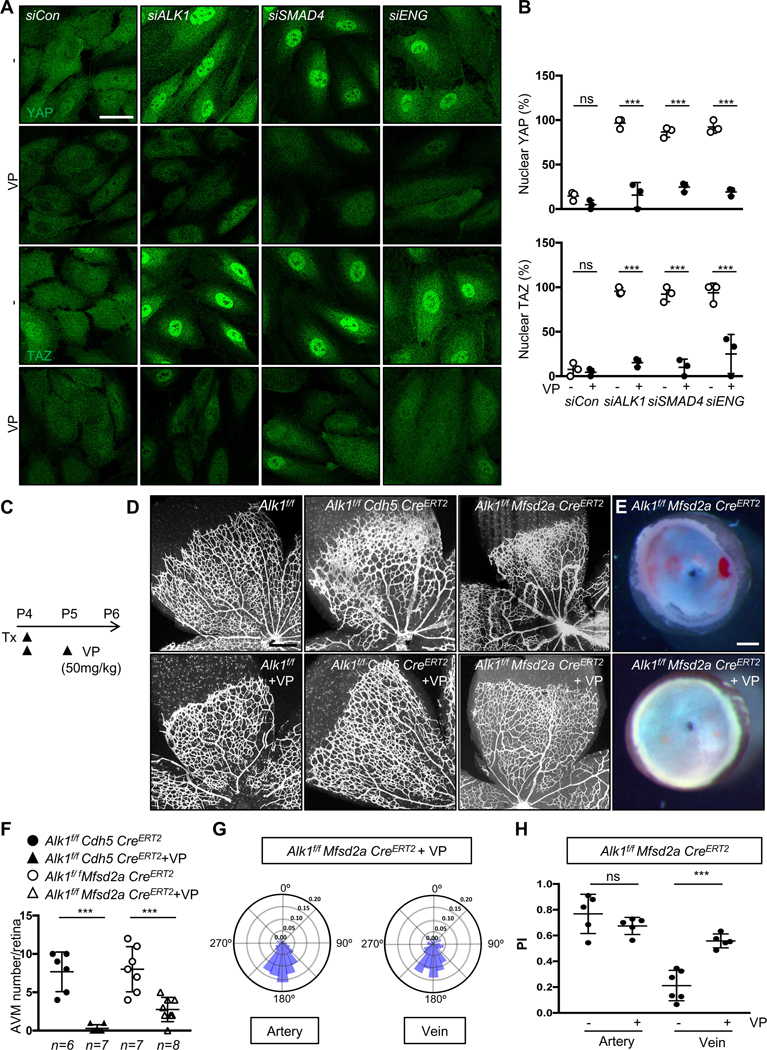
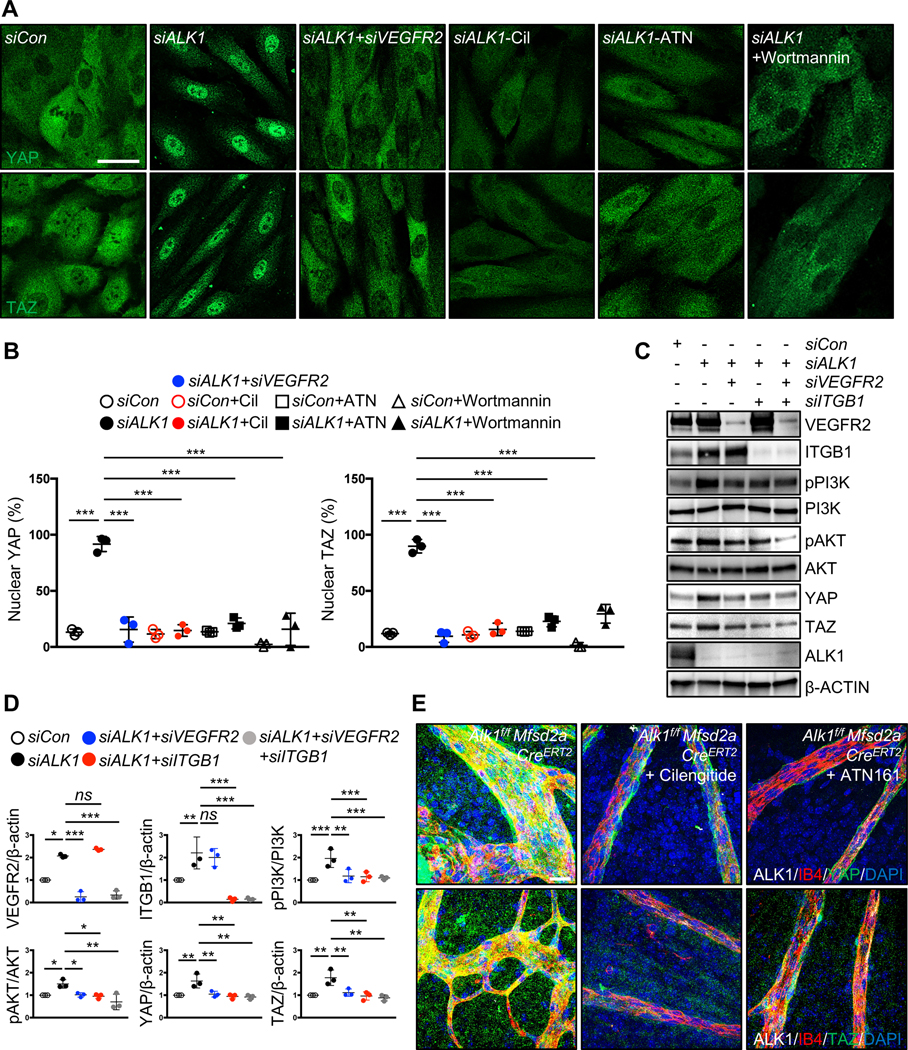
Results: ALK1 deletion impaired capillary-venous endothelial cell polarization against the direction of blood flow in vivo and in vitro. Mechanistically, ALK1-deficient cells exhibited increased integrin signaling interaction with vascular endothelial growth factor receptor 2, which enhanced downstream YAP/TAZ nuclear translocation. Pharmacologic inhibition of integrin or YAP/TAZ signaling rescued flow migration coupling and prevented vascular malformations in Alk1-deficient mice.

Conclusions: Our study reveals ALK1 as an essential driver of flow-induced endothelial cell migration and identifies loss of flow-migration coupling as a driver of arteriovenous malformation formation in hereditary hemorrhagic telangiectasia disease. Integrin-YAP/TAZ signaling blockers are new potential targets to prevent vascular malformations in patients with hereditary hemorrhagic telangiectasia.

Keywords: arteriovenous malformations; cell movement; telangiectasia, hereditary hemorrhagic; vascular endothelial growth factor A.


Figures

Figure 1.
Figure 1.. Retinal endothelial cell lineage tracing
(A-I) P6 retina flat mount images labeled with IB4 (blue) and GFP (white) from Mfsd2a CreERT2 mTmG (A, D, G), Esm1 CreERT2 mTmG (B, E, H) and Bmx CreERT2 mTmG (C, F, I) mice injected with 100 μg tamoxifen (Tx) at P5.5 (12 h, A-C), P5 (for 24 h, D-F) and P4 (for 48 h, G-I) and dissected at P6. (J) 100 μg Tx was injected at P6 and dissected after 6 h in Mfsd2a CreERT2 mTmG mice. (K) 100 μg Tx was injected at P4 and dissected after 400 h (P21) (L) 2 mg/kg Tx was injected in P20 Mfsd2a CreERT2 mTmG mice and dissect at P21. Yellow arrows indicate tip cells and red arrows indicate location of GFP-expressing ECs in arteries. (M) Quantification of Mfsd2a CreERT2 mTmG GFP expressing vessel length over IB4 positive vessel length from optic nerve. n = 6–8 retinas per time point. P-value < 0.001, Error bars: SEM. *P-value < 0.05, **P-value < 0.01, ***P-value < 0.001, ns: nonsignificant, One-way ANOVA with Sidak’s multiple comparisons test. ON: optic nerve, V: vein, A: artery, Scale bars: 500 μm (A-K) and 50 μm (L).
Figure 2.
Figure 2.. Capillary-venous loss of ALK1 leads to AVMs.
(A) Schematic representation of the experimental strategy used to delete Alk1 in mice (P4-P6). (B-D) P6 retina flat mount images labeled with IB4 (blue) and GFP (white) from Alk1f/f Mfsd2a CreERT2 mTmG (B), Alk1f/f Esm1 CreERT2 mTmG (C) and Alk1f/f Bmx CreERT2 mTmG pups (D) injected with 100 μg Tx at P4 and dissected at P6. White arrows indicate AVMs. (E) Quantification of AVM number. n = 6–11 mice per group. Error bars: SEM. **** P-value < 0.0001, ns: nonsignificant, One-way ANOVA with Sidak’s multiple comparisons test. (F-I) Vascular labeling with latex dye (red) of retinal and brain vessels in Alk1f/f (F and G) and Alk1f/f Mfsd2a CreERT2 (H and I) P6 pups. White arrows indicate AVMs. (J and K) GFP (white) and VE-Cad (blue) staining of mesentery and gastrointestinal (GI) tract (J) and lacteals (K) from P14 Esm1 CreERT2 mTmG. 100 μg Tx was injected at P4. An arrow indicates Esm1 positive capillary ECs (J). (L and M) VE-Cad (blue) and GFP (white) staining of jejunum lacteals from P14 Alk1f/f (L) and Alk1f/f Esm1 CreERT2 mTmG (M). (N-Q and T-W) 100 μg Tx was injected at P4 and dissected at P12. Vascular labeling with latex dye (red) of villi, GI tracts, retinas and brains in Alk1f/f (N,P,T and V) and Alk1f/f Esm1 CreERT2 (O, Q, U and W) P12 pups. (R and S) 100 μg Tx was injected at P4 and dissected at P12 (R and S). IB4 (blue) and GFP (white) staining of retinal flat mounts from Esm1 CreERT2 mTmG (R) and Alk1f/f Esm1 CreERT2 mTmG (S) P12 mice. An arrow indicates vascular malformations (Q, U and W). A: artery, V: vein, Scale bars: 500 μm (B-D), 200 μm (F and H), 2 mm (G and I). 400 μm (J), 25 μm (K-M), 200 μm (N and O), 1 mm (P-G and V-W), 500 μm (R-U), 200 μm.
Figure 3.
Figure 3.. ALK1 controls cell polarization against the blood flow direction.
(A-B) IB4 (Magenta) and ALK1 (white) staining of retinal flat mounts from Alk1f/f (A) and Alk1f/f Mfsd2a CreERT2 (B) pups injected with 100 μg Tx at P4 and dissected at P6. (C-F) Higher magnification of insets in A and B. GOLPH4 (green) and DAPI (blue) staining of retina flat mounts. Red arrows indicate the blood flow direction. (C’-F’) Background images from Figure 2C–2F and corresponding polarity vectors (black arrows). (G) The polarity axis of each cell was defined as the angle between the direction of blood flow and the cell polarity axis, defined by a vector drawn from the center of the cell nucleus to the center of the Golgi apparatus. (H) Angular histograms showing the distribution of polarization angles of ECs in the artery, vein and capillaries from Alk1f/f and artery, vein, capillary and AVM from Alk1f/f Mfsd2a CreERT2 mouse retinas. n = 7–11 retinas. (I) polarity index (PI) box plots of ECs from artery, vein and capillary from Alk1f/f and artery, vein, capillary and AVM from Alk1f/f Mfsd2a CreERT2 P6 retinas. n = 7–11 retinas. (J and K) IB4 (gray) staining of retinal flat mounts from Alk1f/f Mfsd2a CreERT2 pups injected with 100 μg at P4 and dissected after 24 h (P5) (J) and 36 h (P5.5) (K). (L) Angular histograms showing the distribution of polarization angles of ECs in the artery, vein and capillary from Alk1f/f and Alk1f/f Mfsd2a CreERT2 P5 retinas at 24 h after Tx injection. (M) PI box plots of ECs from artery, vein and capillary from Alk1f/f and Alk1f/f Mfsd2a CreERT2 retinas at 24 h after Tx injection. n = 5–8 retinas/group. Error bars: SEM. **P-value < 0.01, ***P-value < 0.001, ns: nonsignificant, Two-way ANOVA with Tukey’s multiple comparisons test. Scale bars: 100 μm (A-B), 20 μm (C-F) and 500 μm (J-K)
Figure 4.
Figure 4.. ALK1 controls EC polarization against the flow direction in vitro.
(A-B) Representative images of scratch wound assays after 18 h showing polarity angles of HUVECs transfected with Control (siCon) (A) or ALK1 (siALK1) (B) siRNAs under static conditions and immunolabeled with phalloidin(red), GM130 (green), and DAPI (blue). (E-F) Representative images of scratch wound assays showing polarity angles of siCon (E) or siALK1 (F) HUVECs with 18 h exposure to laminar shear stress (LSS) at 15 dynes/cm2. Left panels are upstream and right panels are downstream of flow. (C-D and G-H) Angular histograms showing polarization angles of siCon (C and G) or siALK1 ECs (D and H) at 18 h after scratch with (G-H) or without (C-D) LSS. Left is upstream and right is downstream of flow (G and H). (I) PI box plots of upstream (left) scratch areas from siCon or siALK1 transfected HUVECs at 18 h after with or without LSS. (C-I) n=6–8 images from 3 independent experiments. Error bars: SEM. *P-value < 0.05, **P-value < 0.01, ***P-value < 0.001, Two-way ANOVA with Sidak’s multiple comparison test. (J) Representative time lapse images of siCon or siALK1 HUVECs stably transduced with PH-AKT-mClover3 and plasma membrane targeting sequence of LCK-mRuby3. HUVEC monolayers in microfluidic chambers were exposed to 12 dynes/cm2 LSS under the microscope. 5 min (static) and 12 min (LSS) images were selected from the movies. The surface is color-coded by the value of PH-AKT intensity. (K) Local activation of PI3K was quantified by image analysis. PH-AKT intensity was normalized with average static intensity at each time point. 0 – 5 min : static and 5 – 24.5 min : LSS, n= 61, 41 cells from 3 independent experiments, Error bar : SEM. ***P-value < 0.001, Two-tailed unpaired t-test between siCon and siALK1 in average over the time. Scale bars : 50 μm (A-B and E-F), 20 μm (J).
Figure 5.
Figure 5.. Integrin inhibition prevents AVM formation in Alk1 mutant retinas.
(A-C) IB4 (Magenta) and ITGB1(A, white), ITGA5 (B, white) or ITGAV (C, white) staining of retinal flat mounts from P8 Alk1f/f Mfsd2a CreERT2 pups. (D) Quantification of ITGB1, ITGA5 and ITGAV in P8 Alk1f/f Mfsd2a CreERT2 retinas. (E) VEGFR2 immunoprecipitation in siCon, siALK1 or siALK1+siVEGFR2 HUVECs and western blot analysis for ITGB1, ITGA5, ITGAV and ALK1. VEGFR2, ITGB1, ITGA5, ITGAV, ALK1 and β-ACTIN expression from the total cell lysates are shown as loading controls. Rabbit IgG was used as control. (F) Quantification of ITGB1, ITGA5 or ITGAV levels from immunoprecipitation normalized to β-ACTIN from total cell lysates. *P<0.05, **P<0.01, ***P-value < 0.001, One-way ANOVA with Sidak’s multiple comparisons test. (G) Experimental strategy to assess the effects of integrin inhibitors in Alk1 deleted retinas. Arrowheads indicate the time course of Tx (100 μg) and cilengitide (5mg/kg), ATN161 (5mg/kg) or vehicle administration. (H-J and L-N) IB4 staining of P6 retinal flat mounts from Alk1f/f Mfsd2a CreERT2 (H-J) or Alk1f/f CDH5 CreERT2 (L-N) injected with cilengitide (I and M) or ATN161 (J and N) at P4 and P5. (K and O) Quantification of the AVM number. Each dot represents one retina. n = 7–16 retinas per group. Error bars: SEM. ***P-value < 0.001, One-way ANOVA with Sidak’s multiple comparisons test. (P-S) IB4 (Magenta), ALK1 (white), GOLPH4 (green) and DAPI (blue) staining of retina flat mounts from Alk1f/f (P), Alk1f/f Mfsd2a CreERT2 (Q), Cilengitide (R) or ATN161 (S) injected Alk1f/f Mfsd2a CreERT2 pups. A: artery, V: vein, (T) PI box plots of ECs from artery and vein from Alk1f/f Mfsd2a CreERT2 injected cilengitide or ATN161 retinas. n=5–8 retinas/group. Error bars: SEM. *P-value < 0.05, **P-value < 0.01, ns: nonsignificant, One-way ANOVA with Sidak’s multiple comparisons test. Scale bars: 500 μm (A-C, G-I and K-M), 20 μm (P-S).
Figure 6.
Figure 6.. ALK1 controls YAP/TAZ expression and localization.
(A) Western blot analysis of HUVECs transfected with control and ALK1 siRNAs followed by 18 h exposure to LSS (15 dynes/cm2). (B) Quantification of ITGB1, ITGA5, ITGAV, YAP or TAZ levels normalized to β-ACTIN. *P<0.05, **P<0.01, ***P<0.001, Two-way ANOVA with Sidak’s multiple comparison test. (C-F) YAP and TAZ (green), ALK1 (gray), IB4 (red), DAPI (blue) staining of retinal flat mounts from P8 Alk1f/f (C-D) or Alk1f/f Mfsd2aCreERT2 (E-F) pups. A scale bar: 20 μm (C-F) (G) YAP or TAZ (green) and ALK1 (red) staining of siCon and siALK1 HUVECs. A scale bar: 50 μm. (H) Quantification of nuclear YAP and TAZ from siCon and siALK1 transfected HUVECs. ***P<0.001, n = 3 independent experiments. Two-tailed unpaired t-test between siCon and siALK1.
Figure 7.
Figure 7.. YAP/TAZ inhibition improves AVM formation in Alk1 mutant retinas.
(A) YAP and TAZ staining of siCon, ALK1, SMAD4 or ENG siRNAs transfected HUVECs treated with DMSO or Verteporfin (VP, 5 μM) for 6 h. Nuclear YAP/TAZ localization in siALK1, siSMAD4 or siENG ECs is blocked by VP treatment. A scale bar: 50 μm. (B) Quantification of nuclear YAP and TAZ from siCon, siALK1,siSMAD4 and siENG transfected HUVECs. ***P<0.001, ns: nonsignificant, Two-way ANOVA with Tukey’s multiple comparisons test. (C) Experimental strategy to assess the effects of YAP/TAZ inhibition in EC specific Alk1 deleted vasculature. Arrowheads indicate the time course of Tx (100 μg) and VP (50mg/kg) or vehicle administration. (D) IB4 staining of P6 retinal flat mounts from VP injected Alk1f/f, Alk1f/f CDH5 CreERT2 or Alk1f/f Mfsd2a CreERT2 mice. (E) Stereomicroscopy images of vehicle or VP injected Alk1f/f Mfsd2a CreERT2 retinas. (F) Quantification of the AVM number/retina. Each dot represents one retina. n = 6–8 retinas per group. Error bars: SEM. ***P-value < 0.001, One-way ANOVA with Sidak’s multiple comparisons test. (G) Angular histograms showing polarization angles of artery and vein from Alk1f/f Mfsd2a CreERT2 with VP. (H) PI box plots of Alk1f/f Mfsd2a CreERT2 with vehicle or VP. n=5–6 retinas, Error bars: SEM, ***P-value < 0.001, ns: nonsignificant, Two-way ANOVA with Tukey’s multiple comparisons test. Scale bars : 50 μm (A), 500 μm (D), 300 μm (E)
Figure 8.
Figure 8.. VEGFR2, integrin and PI3K function upstream of YAP/TAZ in Alk1 mutants
(A) YAP and TAZ staining for siCon, siALK1 and siALK1+siVEGFR2 transfected HUVECs and ALK1 siRNA transfected HUVECs treated with cilengitide (Cil, 5 μM), ATN161 (ATN, 5 μM) and wortmannin (100 mM) for 12 h. Nuclear YAP/TAZ localization in siALK1 ECs is blocked by siVEGFR2, cilengitide, ATN161 and wortmannin treatment. (B) Quantification of nuclear YAP and TAZ from for siCon, siALK1 and siALK1+siVEGFR2 transfected HUVECs and ALK1 siRNA transfected HUVECs treated with cilengitide, ATN16, wortmannin. ***P<0.001, n = 3 independent experiments. Error bars: SEM. ***P-value < 0.001, Two-way ANOVA with Tukey’s multiple comparisons test. (C) Western blot analysis of HUVECs transfected with control, ALK1, ALK1+VEGFR2, ALK1+ITGB1 or ALK1+VEGFR2+ITGB1 siRNAs. (D) Quantification of pPI3K/PI3K, pAKT/AKT and YAP or TAZ levels normalized to β-ACTIN. *P<0.05, **P<0.01, ***P<0.001, ns: nonsignificant, One-way ANOVA with Sidak’s multiple comparisons test. (E) YAP and TAZ (green), ALK1 (white), IB4 (red) and DAPI (blue) staining of retinal flat mounts from cilengitide or ATN161 injected Alk1f/f Mfsd2a CreERT2 P6 mice. Scale bars: 50 μm (A), 20 μm (E)

References

    1. Shovlin CL. Hereditary haemorrhagic telangiectasia: Pathophysiology, diagnosis and treatment. Blood Reviews. 2010;24:203–219. doi: 10.1016/j.blre.2010.07.001 - DOI - PubMed
    1. McAllister KA, Grogg KM, Johnson DW, Gallione CJ, Baldwin MA, Jackson CE, Helmbold EA, Markel DS, McKinnon WC, Murrel J, et al.Endoglin, a TGF-β binding protein of endothelial cells, is the gene for hereditary haemorrhagic telangiectasia type 1. Nature Genetics. 1994;8:345–351. doi: 10.1038/ng1294-345 - DOI - PubMed
    1. Johnson DW, Berg JN, Baldwin MA, Gallione CJ, Marondel I, Yoon SJ, Stenzel TT, Speer M, Pericak-Vance MA, Diamond A, et al.Mutations in the activin receptor–like kinase 1 gene in hereditary haemorrhagic telangiectasia type 2. Nature Genetics. 1996;13:189–195. doi: 10.1038/ng0696-189 - DOI - PubMed
    1. Gallione CJ, Repetto GM, Legius E, Rustgi AK, Schelley SL, Tejpar S, Mitchell G, Drouin E, Westermann CJ and Marchuk DA. A combined syndrome of juvenile polyposis and hereditary haemorrhagic telangiectasia associated with mutations in MADH4 (SMAD4). Lancet. 2004;363:852–9. doi: 10.1016/s0140-6736(04)15732-2 - DOI - PubMed
    1. Gallione CJ, Klaus DJ, Yeh EY, Stenzel TT, Xue Y, Anthony KB, McAllister KA, Baldwin MA, Berg JN, Lux A, et al.Mutation and expression analysis of the endoglin gene in Hereditary Hemorrhagic Telangiectasia reveals null alleles. Human Mutation. 1998;11:286–294. doi: 10.1002/(SICI)1098-1004(1998)11:4<286::AID-HUMU6>3.0.CO;2-B - DOI - PubMed

Publication types

MeSH terms

Substances