. 2021 Jun 29;12(3):e0122921.
doi: 10.1128/mBio.01229-21. Epub 2021 Jun 29.

Diverse Humoral Immune Responses in Younger and Older Adult COVID-19 Patients

Affiliations

Diverse Humoral Immune Responses in Younger and Older Adult COVID-19 Patients

Jennifer M Sasson et al. mBio. .

Abstract

We sought to discover links between antibody responses to severe acute respiratory syndrome coronavirus 2 (SARS-CoV-2) and patient clinical variables, cytokine profiles, and antibodies to endemic coronaviruses. Serum samples from 30 patients of younger (26 to 39 years) and older (69 to 83 years) age groups and with varying clinical severities ranging from outpatient to mechanically ventilated were collected and used to probe a novel multi-coronavirus protein microarray. This microarray contained variable-length overlapping fragments of SARS-CoV-2 spike (S), envelope (E), membrane (M), nucleocapsid (N), and open reading frame (ORF) proteins created through in vitro transcription and translation (IVTT). The array also contained SARS-CoV, Middle East respiratory syndrome coronavirus (MERS-CoV), human coronavirus OC43 (HCoV-OC43), and HCoV-NL63 proteins. IgG antibody responses to specific epitopes within the S1 protein region spanning amino acids (aa) 500 to 650 and within the N protein region spanning aa 201 to 300 were found to be significantly higher in older patients and further significantly elevated in those older patients who were ventilated. Additionally, there was a noticeable overlap between antigenic regions and known mutation locations in selected emerging SARS-CoV-2 variants of current clinical consequence (B.1.1.7, B1.351, P.1, CAL20.C, and B.1.526). Moreover, the older age group displayed more consistent correlations of antibody reactivity with systemic cytokine and chemokine responses than the younger adult group. A subset of patients, however, had little or no response to SARS-CoV-2 antigens and disproportionately severe clinical outcomes. Further characterization of these slow-low-responding individuals with cytokine analysis revealed significantly higher interleukin-10 (IL-10), IL-15, and interferon gamma-induced protein 10 (IP-10) levels and lower epidermal growth factor (EGF) and soluble CD40 ligand (sCD40L) levels than those of seroreactive patients in the cohort. IMPORTANCE As numerous viral variants continue to emerge in the coronavirus disease 2019 (COVID-19) pandemic, determining antibody reactivity to SARS-CoV-2 epitopes becomes essential in discerning changes in the immune response to infection over time. This study enabled us to identify specific areas of antigenicity within the SARS-CoV-2 proteome, allowing us to detect correlations of epitopes with clinical metadata and immunological signals to gain holistic insight into SARS-CoV-2 infection. This work also emphasized the risk of mutation accumulation in viral variants and the potential for evasion of the adaptive immune responses in the event of reinfection. We additionally highlighted the correlation of antigenicity between structural proteins of SARS-CoV-2 and endemic HCoVs, raising the possibility of cross-protection between homologous lineages. Finally, we identified a subset of patients with minimal antibody reactivity to SARS-CoV-2 infection, prompting discussion of the potential consequences of this alternative immune response.

Keywords: SARS-CoV-2; clinical severity; endemic coronaviruses; epitopes; humoral immunity; viral variants.


Figures

FIG 1
FIG 1
Reactivity of COVID-19 patient IgG to SARS-CoV-2 proteins displayed separately for younger, older ventilated, and older nonventilated groups. (A) Circular graphic mapping the amino acid (aa) positions of SARS-CoV-2 fragments, showing a heat map of antibody levels in each group for overlapping regions of different amino acid lengths. Proteins are indicated outside the circle plot above an axis that shows amino acid positions from the N terminus to the C terminus of each protein. The following graph moving inward shows the positions of amino acid mutations in currently circulating variants compared with the USA-WA1 variant that is represented on the protein array. ‡ at S1 aa 242 represents a 3-aa deletion from positions 242 to 244 and an R246I mutation in the B1.351 variant. Asterisks represent deletions. The following line graph shows the sequence homology of other HCoVs with SARS-CoV-2 for each gene. The inner circular heat map shows proteins and protein fragments produced in vitro with bars that represent the length and position of each fragment in each protein. Each fragment is drawn three times and shows the group mean normalized signal intensity (SI) of antibody binding to each fragment for COVID-19 patient serum samples in the older ventilated group (“V”) (69 to 83 years of age), the older nonventilated group (“O”) (69 to 83 years), and the younger age group (“Y”) (26 to 39 years). The IgG signal intensity is shown by a color gradient (gray to deep blue). Bar triads shown with a gold outline represent significantly differential antibody binding among all three groups, defined as a mean log2 signal intensity of ≥0.1 in at least one group and an unadjusted ANOVA P value of ≤0.05 (adjusted P values are provided in Tables S1 and S2 in the supplemental material). The regions of greatest reactivity for each protein are outlined in magenta. The innermost circle bands represent the responses to full-length purified recombinant S protein (shown crossing both the S1 and S2 regions) and receptor binding domain (RBD) proteins from the array. This is followed by full-length S1, S2, and N and RBD responses acquired in the Milliplex assay. (B) A sector of the circular graphic enlarged and labeled in more detail as a guide to interpreting the full figure. IgG reactivity with the C-terminal region of the S1 protein spanning aa 501 to 685 is shown.
FIG 2
FIG 2
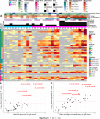
Heat map depicting relative IgG antibody responses to SARS-CoV-2 compared to other HCoVs and clinical data. (A) Heat maps presenting the signals of antibody binding to individual proteins and protein fragments within the antigenic regions of SARS-CoV-2 as well as the full-length structural proteins of MERS-CoV, HCoV-NL63, and HCoV-OC43 for individual samples. Columns represent serum samples, and rows represent proteins or protein fragments: 128 SARS-CoV-2 proteins or fragments and 5 proteins each of MERS-CoV, HCoV-OC43, and HCoV-NL63. The antibody signal intensity is shown on a color scale from gray to red. Sample clinical information is overlaid above the heat maps and includes sex (male [M]/female [F]), age category, clinical status (hospitalized, admitted to the ICU, ventilated, and/or deceased), longevity of symptoms (number of days sick prior to sample collection and length of stay [LOS] at the hospital), maximum oxygen levels required (liters per minute [LPM]), and patient measurements, including maximum body temperature, body mass index (BMI), and composite score encompassing the patient’s other comorbidities (“Comorbidity Score”). Protein/fragment information is annotated to the left of the heat maps and includes the virus, the full-length protein name, and the amino acid length of the protein fragments (“Tile Length”) (full length, or 100, 50, or 30 aa). Only fragments that were reactive (normalized log2 signal intensity of >1.0) in at least 10% of the study population were included in the heat map. NC, nasal cannula; RA, room air. (B and C) Volcano plots showing the statistical effect estimates of days sick prior to serum sample collection (B) and length of hospital stay (C) on IgG levels. The x axis shows the linear regression coefficients that were adjusted by age category, sex, and requirement of a ventilator, and the y axis shows the inverse log10 P values for each of the SARS-CoV-2 proteins that were reactive (normalized log2 signal intensity of >1.0) in at least 10% of the study population. The proteins/fragments with significant associations with length of stay and days sick after correction for the false discovery rate are highlighted as red triangles and red labels.
FIG 3
FIG 3
Correlation of reactive SARS-CoV-2 proteins and fragments with selected cytokine/chemokine levels stratified by age group. The heat map shows Pearson’s correlation coefficient between antibody and cytokine levels on a colorimetric scale from negative correlations in green to positive correlations in red. Significances of the correlations are shown by overlaid asterisks (*, P < 0.05; **, P < 0.005; ***, P < 0.0005). Plots are separated by the younger age group (26 to 39 years of age; n = 10) (left) and the older age group (69 to 83 years; n = 20) (right). The antigens displayed correspond to proteins and fragments produced in vitro that were seropositive (normalized log2 signal intensity of ≥1.0) in at least 10% of the study population. The cytokines displayed were selected based on significant associations with antibody levels in linear mixed-effects regression models, adjusted for age category, sex, and requirement of a ventilator. IL-17A and IL-5 were selected due to significant associations with individual antibody responses in ordinary least-squares regression models adjusted for age category, sex, and ventilator. Protein/fragment information is annotated to the right of the heat maps and includes the protein name, the amino acid coordinates in parentheses, and the lengths of the protein fragments (“Tile Length”).
FIG 4
FIG 4
Correlation of IgG responses to full-length proteins of SARS-CoV-2 and two endemic human coronaviruses. A correlogram depicts Pearson’s rank correlation coefficient (rho) between IgG-normalized signal intensities for SARS-CoV-2, HCoV-OC43, and HCoV-NL63 full-length S2 and N proteins produced in vitro. The lower left half of the diagonal (shaded in yellow) shows correlations between the reactivities of sera from the younger age group (27 to 39 years of age), and the upper right half of the diagonal (shaded in pink) shows the older group (69 to 84 years). Lines of seropositivity defined as a normalized log2 signal intensity of ≥1 are depicted by horizontal and vertical dotted lines within each scatterplot. Slow-low responders are represented by dots that fall below these dotted lines. The rho coefficient is listed in blue lettering in each box. The outermost right and bottom boxes represent density plots for the older and younger age groups, respectively.
FIG 5
FIG 5
Differences in cytokine and chemokine levels between slow-low responders and seroreactive older adult COVID-19 patients. The box plot illustrates the top 11 differences in cytokine levels of those not responding to SARS-CoV-2 full-length S2 proteins (S2) (“slow-low responders”) and those responding (S2+) (“seroreactive”). Cytokine/chemokine levels are plotted on a log2 scale. Unadjusted Wilcoxon’s rank sum P values are denoted below each pair of boxes, with an asterisk above P values that remain significant after correction for the false discovery rate.

References

    1. Tay MZ, Poh CM, Rénia L, MacAry PA, Ng LFP. 2020. The trinity of COVID-19: immunity, inflammation and intervention. Nat Rev Immunol 20:363–374. doi:10.1038/s41577-020-0311-8. - DOI - PMC - PubMed
    1. Ren L, Fan G, Wu W, Guo L, Wang Y, Li X, Wang C, Gu X, Li C, Wang Y, Wang G, Zhou F, Liu Z, Ge Q, Zhang Y, Li H, Zhang L, Xu J, Wang C, Wang J, Cao B. 2021. Antibody responses and clinical outcomes in adults hospitalized with severe coronavirus disease 2019 (COVID-19): a post hoc analysis of LOTUS China trial. Clin Infect Dis 72:e545–e551. doi:10.1093/cid/ciaa1247. - DOI - PMC - PubMed
    1. Carlson CR, Asfaha JB, Ghent CM, Howard CJ, Hartooni N, Safari M, Frankel AD, Morgan DO. 2020. Phosphoregulation of phase separation by the SARS-CoV-2 N protein suggests a biophysical basis for its dual functions. Mol Cell 80:1092–1103.e4. doi:10.1016/j.molcel.2020.11.025. - DOI - PMC - PubMed
    1. Cai Y, Zhang J, Xiao T, Peng H, Sterling SM, Walsh RM, Rawson S, Rits-Volloch S, Chen B. 2020. Distinct conformational states of SARS-CoV-2 spike protein. Science 369:1586–1592. doi:10.1126/science.abd4251. - DOI - PMC - PubMed
    1. Lynch KL, Whitman JD, Lacanienta NP, Beckerdite EW, Kastner SA, Shy BR, Goldgof GM, Levine AG, Bapat SP, Stramer SL, Esensten JH, Hightower AW, Bern C, Wu AHB. 2021. Magnitude and kinetics of anti-severe acute respiratory syndrome coronavirus 2 antibody responses and their relationship to disease severity. Clin Infect Dis 72:301–308. doi:10.1093/cid/ciaa979. - DOI - PMC - PubMed

Publication types

MeSH terms