. 2021 Jun 28;18(1):17.
doi: 10.1186/s12014-021-09320-2.

The plasma peptides of Alzheimer's disease

Affiliations

The plasma peptides of Alzheimer's disease

Angelique Florentinus-Mefailoski et al. Clin Proteomics. .

Abstract

Background: A practical strategy to discover proteins specific to Alzheimer's dementia (AD) may be to compare the plasma peptides and proteins from patients with dementia to normal controls and patients with neurological conditions like multiple sclerosis or other diseases. The aim was a proof of principle for a method to discover proteins and/or peptides of plasma that show greater observation frequency and/or precursor intensity in AD. The endogenous tryptic peptides of Alzheimer's were compared to normals, multiple sclerosis, ovarian cancer, breast cancer, female normal, sepsis, ICU Control, heart attack, along with their institution-matched controls, and normal samples collected directly onto ice.

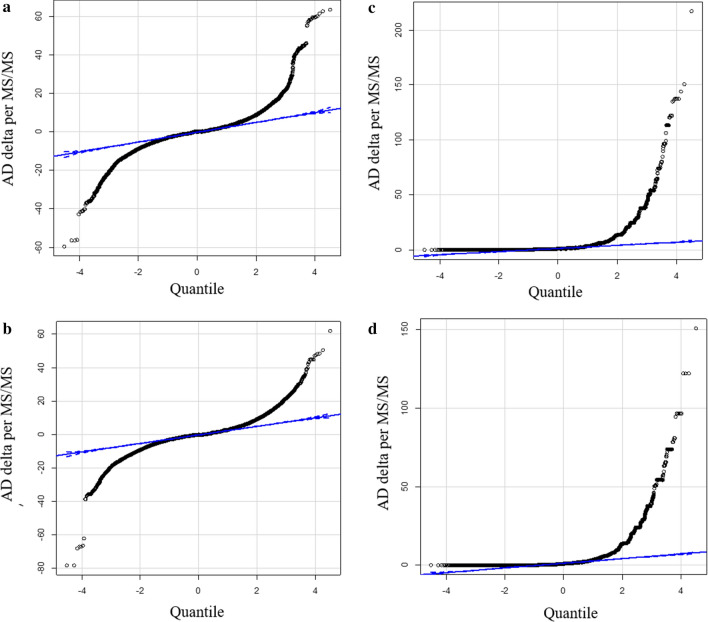
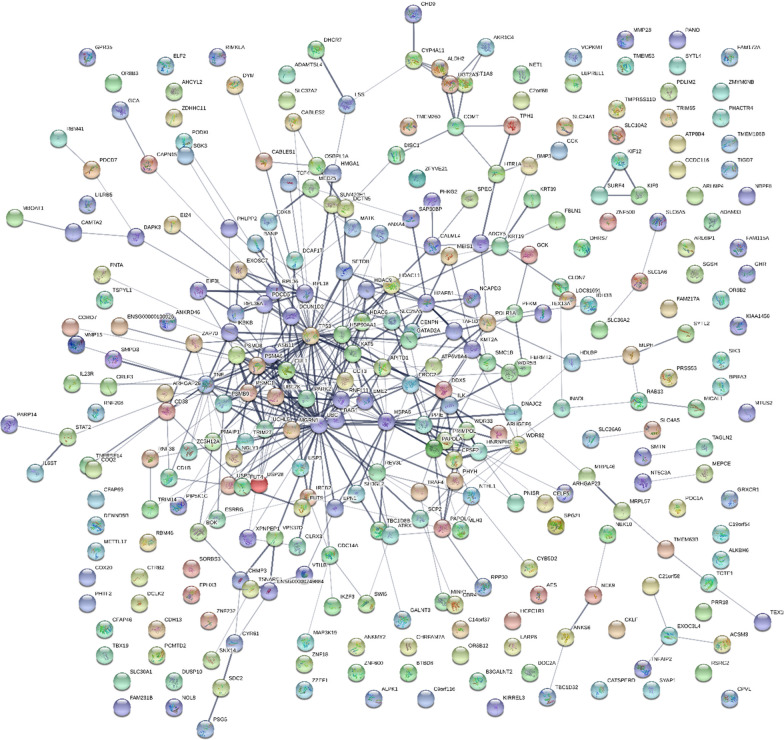
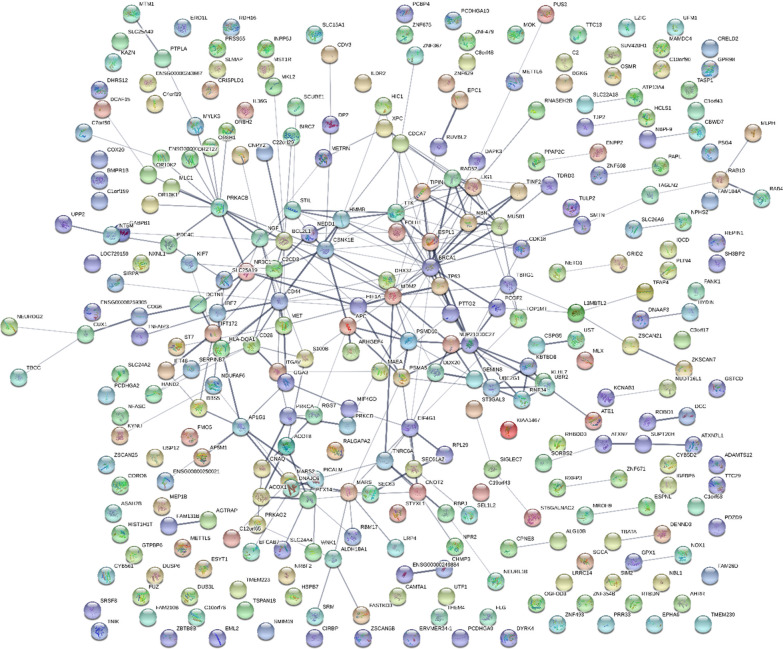
Methods: Endogenous tryptic peptides were extracted from blinded, individual AD and control EDTA plasma samples in a step gradient of acetonitrile for random and independent sampling by LC-ESI-MS/MS with a set of robust and sensitive linear quadrupole ion traps. The MS/MS spectra were fit to fully tryptic peptides within proteins identified using the X!TANDEM algorithm. Observation frequency of the identified proteins was counted using SEQUEST algorithm. The proteins with apparently increased observation frequency in AD versus AD Control were revealed graphically and subsequently tested by Chi Square analysis. The proteins specific to AD plasma by Chi Square with FDR correction were analyzed by the STRING algorithm. The average protein or peptide log10 precursor intensity was compared across disease and control treatments by ANOVA in the R statistical system.

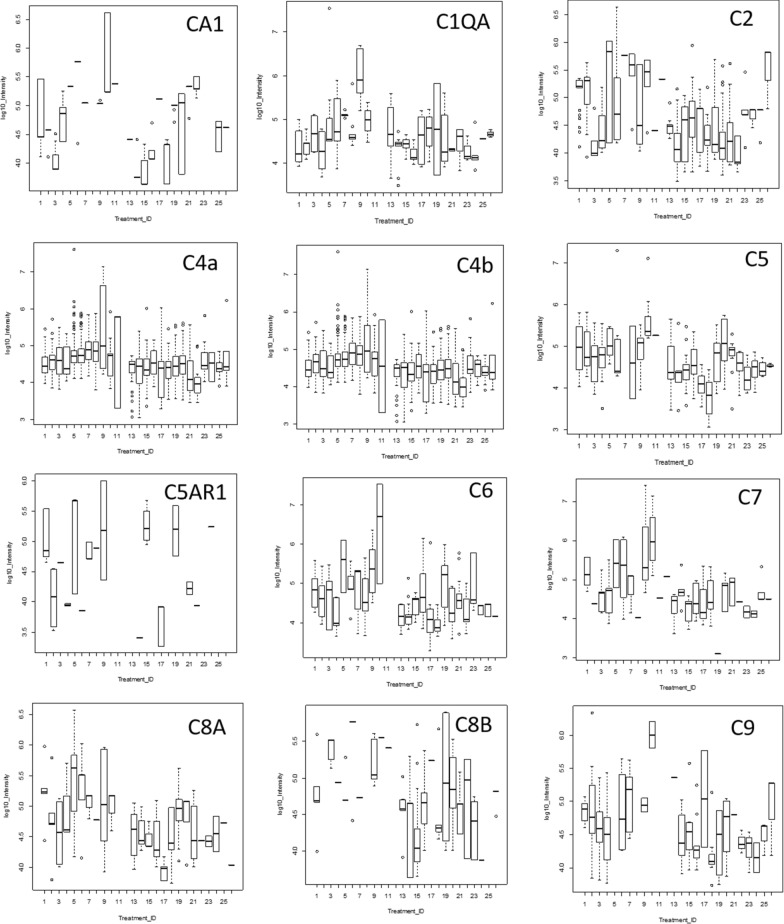
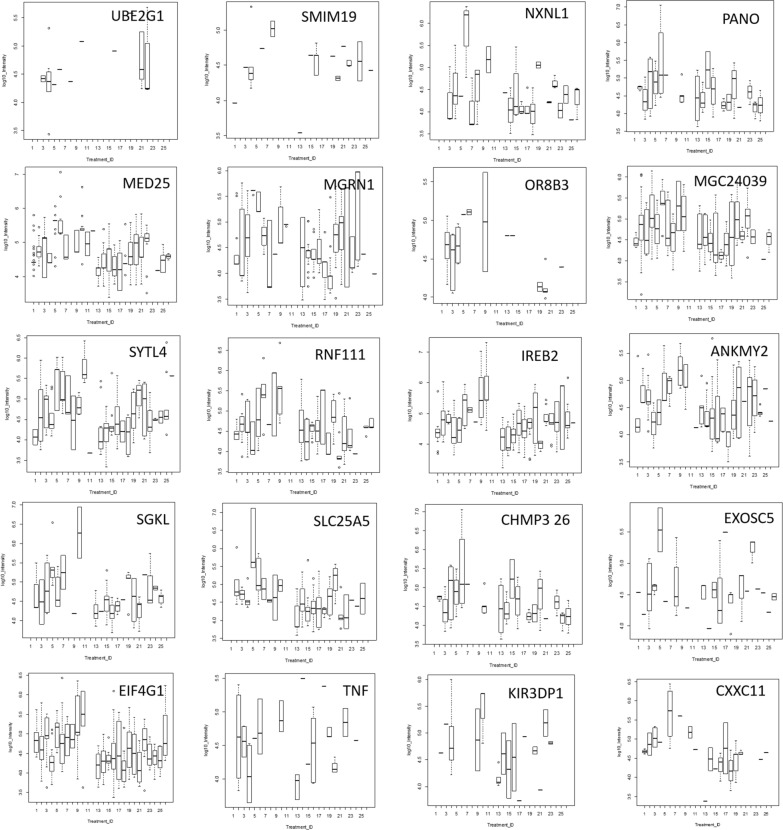
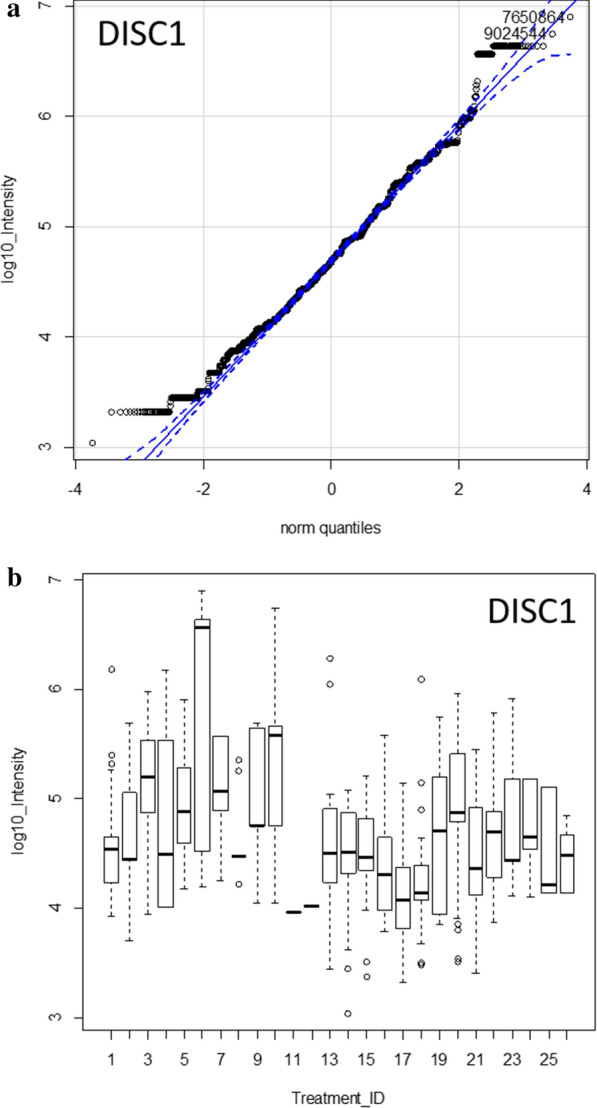
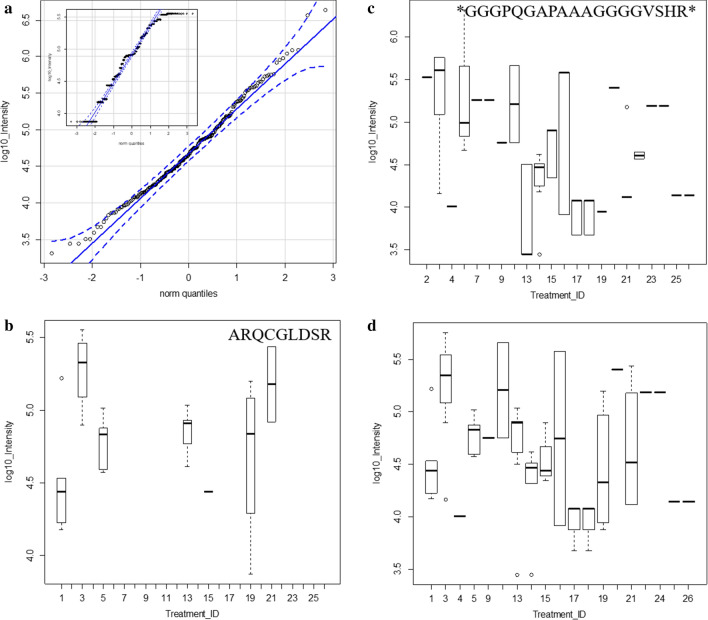
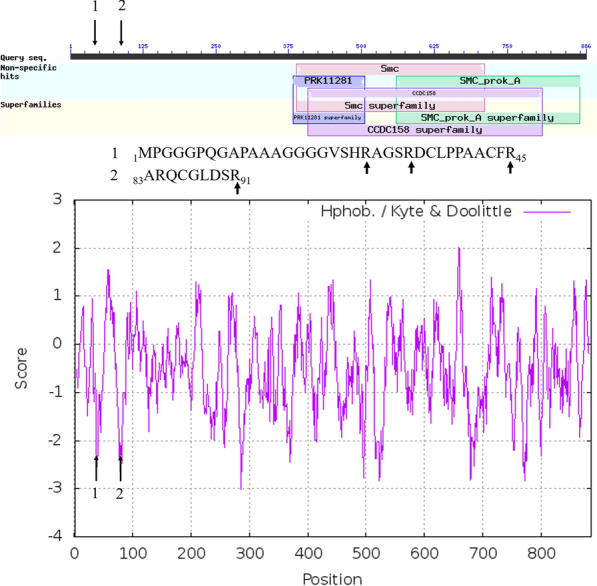
Results: Peptides and/or phosphopeptides of common plasma proteins such as complement C2, C7, and C1QBP among others showed increased observation frequency by Chi Square and/or precursor intensity in AD. Cellular gene symbols with large Chi Square values (χ2 ≥ 25, p ≤ 0.001) from tryptic peptides included KIF12, DISC1, OR8B12, ZC3H12A, TNF, TBC1D8B, GALNT3, EME2, CD1B, BAG1, CPSF2, MMP15, DNAJC2, PHACTR4, OR8B3, GCK, EXOSC7, HMGA1 and NT5C3A among others. Similarly, increased frequency of tryptic phosphopeptides were observed from MOK, SMIM19, NXNL1, SLC24A2, Nbla10317, AHRR, C10orf90, MAEA, SRSF8, TBATA, TNIK, UBE2G1, PDE4C, PCGF2, KIR3DP1, TJP2, CPNE8, and NGF amongst others. STRING analysis showed an increase in cytoplasmic proteins and proteins associated with alternate splicing, exocytosis of luminal proteins, and proteins involved in the regulation of the cell cycle, mitochondrial functions or metabolism and apoptosis. Increases in mean precursor intensity of peptides from common plasma proteins such as DISC1, EXOSC5, UBE2G1, SMIM19, NXNL1, PANO, EIF4G1, KIR3DP1, MED25, MGRN1, OR8B3, MGC24039, POLR1A, SYTL4, RNF111, IREB2, ANKMY2, SGKL, SLC25A5, CHMP3 among others were associated with AD. Tryptic peptides from the highly conserved C-terminus of DISC1 within the sequence MPGGGPQGAPAAAGGGGVSHRAGSRDCLPPAACFR and ARQCGLDSR showed a higher frequency and highest intensity in AD compared to all other disease and controls.

Conclusion: Proteins apparently expressed in the brain that were directly related to Alzheimer's including Nerve Growth Factor (NFG), Sphingomyelin Phosphodiesterase, Disrupted in Schizophrenia 1 (DISC1), the cell death regulator retinitis pigmentosa (NXNl1) that governs the loss of nerve cells in the retina and the cell death regulator ZC3H12A showed much higher observation frequency in AD plasma vs the matched control. There was a striking agreement between the proteins known to be mutated or dis-regulated in the brains of AD patients with the proteins observed in the plasma of AD patients from endogenous peptides including NBN, BAG1, NOX1, PDCD5, SGK3, UBE2G1, SMPD3 neuronal proteins associated with synapse function such as KSYTL4, VTI1B and brain specific proteins such as TBATA.

Keywords: Alzheimer's; Alzheimer’s dementia; C18; Chi square test and ANOVA; Discovery of variation; Electrospray ionization tandem mass spectrometry; Human EDTA plasma; LC–ESI–MS/MS; Linear quadrupole ion trap; Mass spectrometry; Nano chromatography; Organic extraction; Peptides; Peptidome; Plasma; Random and independent sampling; SQL SERVER & R.


Conflict of interest statement

The authors declare that they have no competing interests.

Figures

Fig. 1
Fig. 1
Quantile plots of the corrected difference in observation frequency and Chi Square values of the AD (n ≥ 10) versus Normal Control (n ≥ 9). Panels: a Quantile plot of the observation frequency of tryptic peptides from AD versus Normal Control.; b χ2 plot of the observation frequency of tryptic peptides from AD versus Normal Control tryptic peptides; c Quantile plot of the observation frequency of tryptic STYP peptides from AD versus AD control; d χ2 plot of the observation frequency of tryptic STYP peptides from AD versus AD control tryptic peptides
Fig. 2
Fig. 2
The AD STRING network where tryptic (TRYP) peptide frequency difference greater than 10 and Chi Square χ2 ≥ 25 (p < 0.001)
Fig. 3
Fig. 3
The AD STRING network where phospho-tryptic (STYP) and/or tryptic peptide frequency difference greater than 10 and Chi Square χ2 ≥ 25 (p < 0.001)
Fig. 4
Fig. 4
The distributions of log10 precursor intensity by quantile and box plots of complement proteins across the disease and control treatments. Treatment ID numbers: 1, Alzheimer normal; 2, Alzheimer’s normal control STYP; 3, Alzheimer’s dementia; 4, Alzheimer’s dementia STYP; 5, Cancer breast; 6, Cancer breast STYP; 7, Cancer control; 8, Cancer control STYP; 9, Cancer ovarian; 10, Cancer ovarian STYP; 11, Ice Cold; 12, Ice Cold STYP; 13, Heart attack Arterial; 14 Heart attack Arterial STYP; 15, Heart attack normal control, 16, Heart attack normal Control STYP; 17, Heart attack; 18, Heart attack STYP; 19, Multiple Sclerosis normal control; 20, Multiple sclerosis normal control STYP; 21, Multiple sclerosis; 22, Multiple Sclerosis STYP, 23 Sepsis; 24, Sepsis STYP; 25, Sepsis normal control; 26, Sepsis normal control STYP. There was significant effects of treatments and peptides by two-way ANOVA. Analysis of the proteins shown across treatments produced a significant F Statistic by one-way ANOVA. Note the C3 results were previously published [165]
Fig. 5
Fig. 5
The distributions of log10precursor intensity by box plots of the cellular proteins across the disease and control treatments. Treatment ID numbers: 1, Alzheimer normal; 2, Alzheimer’s normal control STYP; 3, Alzheimer’s dementia; 4, Alzheimer’s dementia STYP; 5, Cancer breast; 6, Cancer breast STYP; 7, Cancer control; 8, Cancer control STYP; 9, Cancer ovarian; 10, Cancer ovarian STYP; 11, Ice Cold; 12, Ice Cold STYP; 13, Heart attack Arterial; 14 Heart attack Arterial STYP; 15, Heart attack normal control, 16, Heart attack normal Control STYP; 17, Heart attack; 18, Heart attack STYP; 19, Multiple Sclerosis normal control; 20, Multiple sclerosis normal control STYP; 21, Multiple Sclerosis; 22, Multiple sclerosis STYP, 23 Sepsis; 24, Sepsis STYP; 25, Sepsis normal control; 26, Sepsis normal control STYP. There was significant effects of treatments and peptides by two-way ANOVA. Analysis of the proteins shown across treatments produced a significant F Statistic by one-way ANOVA
Fig. 6
Fig. 6
The quantile and box plot of all DISC1 peptides compared over disease treatments. Panels: a quantile plot showing the Gaussian intensity distribution; b the quantile box plot showing the intensity distribution of each treatment. Treatment ID numbers: 1, Alzheimer normal; 2, Alzheimer’s normal control STYP; 3, Alzheimer’s dementia; 4, Alzheimer’s dementia STYP; 5, Cancer breast; 6, Cancer breast STYP; 7, Cancer control; 8, Cancer control STYP; 9, Cancer ovarian; 10, Cancer ovarian STYP; 11, Ice Cold; 12, Ice Cold STYP; 13, Heart attack Arterial; 14 Heart attack Arterial STYP; 15, Heart attack normal control, 16, Heart attack normal Control STYP; 17, Heart attack; 18, Heart attack STYP; 19, Multiple Sclerosis normal control; 20, Multiple Sclerosis normal control STYP; 21, Multiple sclerosis; 22, Multiple sclerosis STYP, 23 Sepsis; 24, Sepsis STYP; 25, Sepsis normal control; 26, Sepsis normal control STYP. There was significant effects of treatments and peptides by one way and two-way ANOVA
Fig. 7
Fig. 7
The intensity distributions of the peptides from the conserved N terminus of DISC1 across disease and controls treatments. Panels: a The quantile plot of all DISC1 peptide intensity from within the sequence MPGGGPQGAPAAAGGGGVSHRAGSRDCLPPAACFR (inset, the quantile plot of the selected DISC1 peptides ARQCGLDS; b the quantile box plot of the DISC1 peptide ARQCGLDS; c the quantile box plot of the DISC1 peptides within the sequence MPGGGPQGAPAAAGGGGVSHRAGSRDCLPPAACFR; d the quantile box plot of the DISC1 peptides from ARQCGLDS and within the sequence MPGGGPQGAPAAAGGGGVSHRAGSRDCLPPAACFR. Treatment ID numbers: 1, Alzheimer normal; 2, Alzheimer’s normal control STYP; 3, Alzheimer’s dementia; 4, Alzheimer’s dementia STYP; 5, Cancer breast; 6, Cancer breast STYP; 7, Cancer control; 8, Cancer control STYP; 9, Cancer ovarian; 10, Cancer ovarian STYP; 11, Ice Cold; 12, Ice Cold STYP; 13, Heart attack Arterial; 14 Heart attack Arterial STYP; 15, Heart attack normal control, 16, Heart attack normal Control STYP; 17, Heart attack; 18, Heart attack STYP; 19, Multiple Sclerosis normal control; 20, Multiple Sclerosis normal control STYP; 21, Multiple sclerosis; 22, Multiple sclerosis STYP, 23 Sepsis; 24, Sepsis STYP; 25, Sepsis normal control; 26, Sepsis normal control STYP. There was significant effects of treatments and peptides by two-way ANOVA
Fig. 8
Fig. 8
The primary structure and hydrophobicity plot of Disrupted in Schizophrenia 1 protein isoform a [Homo sapiens] DISC1 NP_001158009.1. The long arrow shows the cleavage site of the tryptic peptides sequences: 1, 1MPGGGPQGAPAAAGGGGVSHRAGSRDCLPPAACFR45; and 2, 83ARQCGLDSR91 from the conserved and unique C-terminal domain of DISC1 that is conserved within humans and across mammals in sequences available to date. The short arrows show the location of the tryptic cleavage sites observed

References

    1. Khan AT, et al. Alzheimer's disease: are blood and brain markers related? A systematic review. Ann Clin Transl Neurol. 2016;3(6):455–462. doi: 10.1002/acn3.313. - DOI - PMC - PubMed
    1. Biamonti G, et al. Alternative splicing in Alzheimer's disease. Aging Clin Exp Res. 2019;33:747. doi: 10.1007/s40520-019-01360-x. - DOI - PubMed
    1. Love JE, Hayden EJ, Rohn TT. Alternative splicing in Alzheimer's Disease. J Parkinsons Dis Alzheimers Dis. 2015;2(2):6. - PMC - PubMed
    1. Cuello AC, Pentz R, Hall H. The brain NGF metabolic pathway in health and in Alzheimer's Pathology. Front Neurosci. 2019;13:62. doi: 10.3389/fnins.2019.00062. - DOI - PMC - PubMed
    1. Malekzadeh A, et al. Plasma proteome in multiple sclerosis disease progression. Ann Clin Transl Neurol. 2019;6(9):1582–1594. doi: 10.1002/acn3.771. - DOI - PMC - PubMed