. 2021:655:245-263.
doi: 10.1016/bs.mie.2021.03.018. Epub 2021 Apr 23.

Quantifying alternative polyadenylation in RNAseq data with LABRAT

Affiliations

Quantifying alternative polyadenylation in RNAseq data with LABRAT

Austin E Gillen et al. Methods Enzymol. 2021.

Abstract

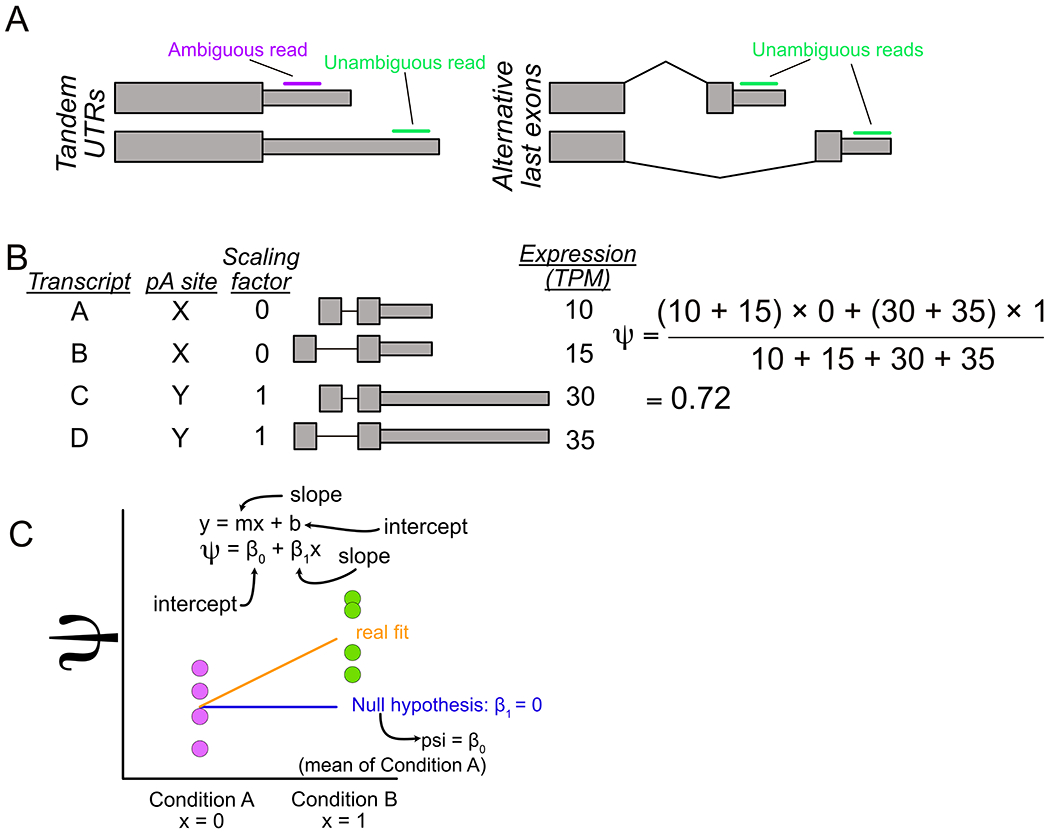
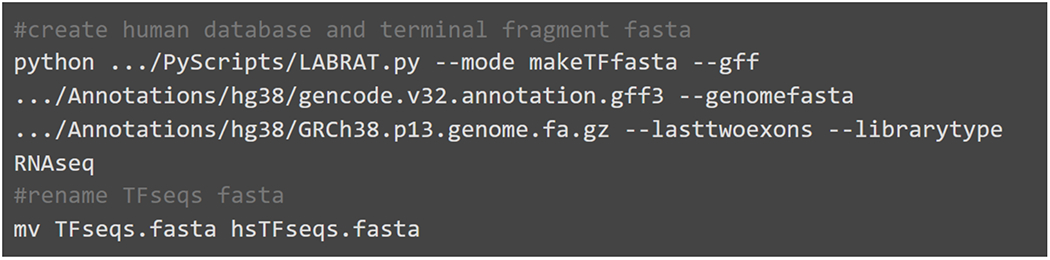
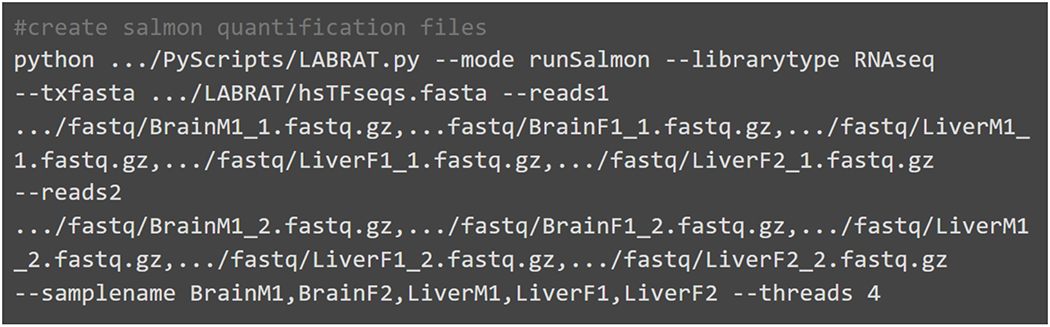
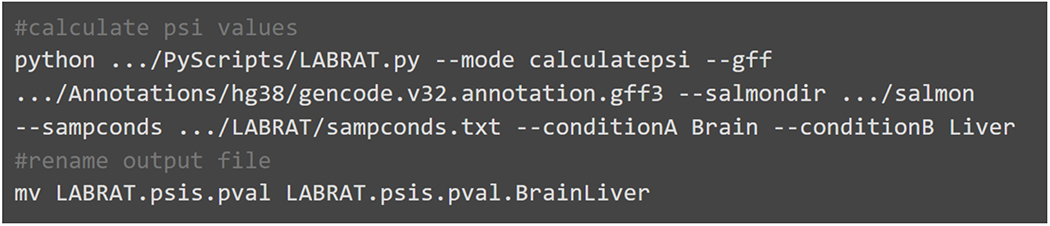
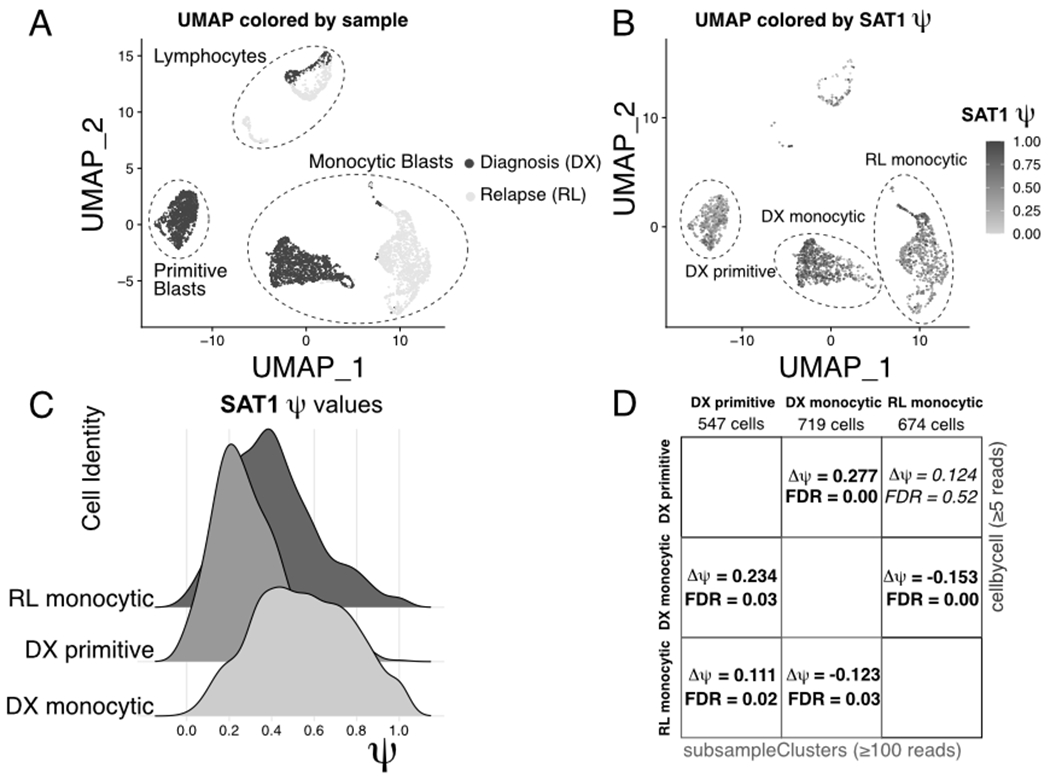
Alternative polyadenylation (APA) generates transcript isoforms that differ in their 3' UTR content and may therefore be subject to different regulatory fates. Although the existence of APA has been known for decades, quantification of APA isoforms from high-throughput RNA sequencing data has been difficult. To facilitate the study of APA in large datasets, we developed an APA quantification technique called LABRAT (Lightweight Alignment-Based Reckoning of Alternative Three-prime ends). LABRAT leverages modern transcriptome quantification approaches to determine the relative abundances of APA isoforms. In this manuscript we describe how LABRAT produces its calculations, provide a step-by-step protocol for its use, and demonstrate its ability to quantify APA in single-cell RNAseq data.

Keywords: 3′ UTR regulation; Alternative polyadenylation; Post-transcriptional regulation; Single cell RNAseq; Transcriptomics.


Figures

Fig. 1
Fig. 1
Overview of LABRAT approach. (A) Tandem UTR (left) and alternative last exon (right) gene structures. (B) Visualization of procedure for calculating ψ. (C) Linear model used by LABRAT for identification of genes with significant changes in ψ across conditions.
Fig. 2
Fig. 2
Example code to install python environments compatible with LABRAT.
Fig. 3
Fig. 3
Example code for creating both the terminal fragment fasta file and a genome annotation database. Gencode’s genome annotation gff file and genome fasta are required inputs. TFseqs.fasta is created in the current directory while the database file is generated in the same directory as the gff.
Fig. 4
Fig. 4
Example code for running LABRAT’s runSalmon function. RNAseq forward reads (reads1), reverse reads (reads2) and sample names are required inputs. Three prime end sequencing reads can also be used however the librarytype option should reflect the type of library provided. This code must be run in an empty directory as it outputs quantifications in new salmon directories for each sample.
Fig. 5
Fig. 5
Example code for running LABRAT’s calculatepsi function. Gencode’s genome annotation gff, the directories produced by runSalmon, a tab-delimited sampconds text file and defined conditions are required inputs. This code produces several output files within the current directory.
Fig. 6
Fig. 6
Schematic of resulting directories after completing this LABRAT quickstart guide. While not explicitly required, similar directory organization for LABRAT projects is best practice.
Fig. 7
Fig. 7
Example code showing the use of alevin to generate input matrices for LABRATsc.
Fig. 8
Fig. 8
Example code showing the use of LABRATsc to calculate psi and delta psi values in both cellbycell and subsampleClusters modes.
Fig. 9
Fig. 9
Alternative polyadenylation of SAT1 in acute myeloid leukemia. (A) UMAP projection showing the diagnosis and relapse samples from GSE143363. Major cell types are indicated with dashed circles. (B) UMAP projection from (A), with cells colored by SAT1 ψ value. Important clusters are indicated with dashed circles. (C) Ridge plot showing distributions of SAT1 ψ values in the clusters highlighted in (C). (D) Table comparing SAT1 pairwise delta-ψ tests between the clusters highlighted in (C) using “--mode subsampleClusters” and “--mode cellbycell.”

References

    1. Benjamini Y, & Hochberg Y (1995). Controlling the false discovery rate: A practical and powerful approach to multiple testing. Journal of the Royal Statistical Society. Series B, Statistical Methodology, 57(1), 289–300.
    1. Bray NL, Pimentel H, Melsted P, & Pachter L (2016). Near-optimal probabilistic RNA-seq quantification. Nature Biotechnology, 34(5), 525–527. - PubMed
    1. Cho PF, Poulin F, Cho-Park YA, Cho-Park IB, Chicoine JD, Lasko P, et al. (2005). A new paradigm for translational control: Inhibition via 5′-3’ mRNA tethering by Bicoid and the eIF4E cognate 4EHP. Cell, 121(3), 411–423. - PubMed
    1. Goering R, Engel KL, Gillen AE, Fong N, Bentley DL, & Matthew Taliaferro J (2020). LABRAT reveals association of alternative polyadenylation with transcript localization, RNA binding protein expression, transcription speed, and cancer survival. Cold Spring Harbor Laboratory. 2020.10.05.326702 10.1101/2020.10.05.326702. - DOI - PMC - PubMed
    1. Grassi E, Mariella E, Lembo A, Molineris I, & Provero P (2016). Roar: Detecting alternative polyadenylation with standard mRNA sequencing libraries. BMC Bioinformatics, 17(1), 423. - PMC - PubMed

Publication types

LinkOut - more resources