

Presymptomatic transmission of SARS-CoV-2 infection: a secondary analysis using published data
- PMID: 34183334
- PMCID: PMC8245290
- DOI: 10.1136/bmjopen-2020-041240
Presymptomatic transmission of SARS-CoV-2 infection: a secondary analysis using published data
Abstract
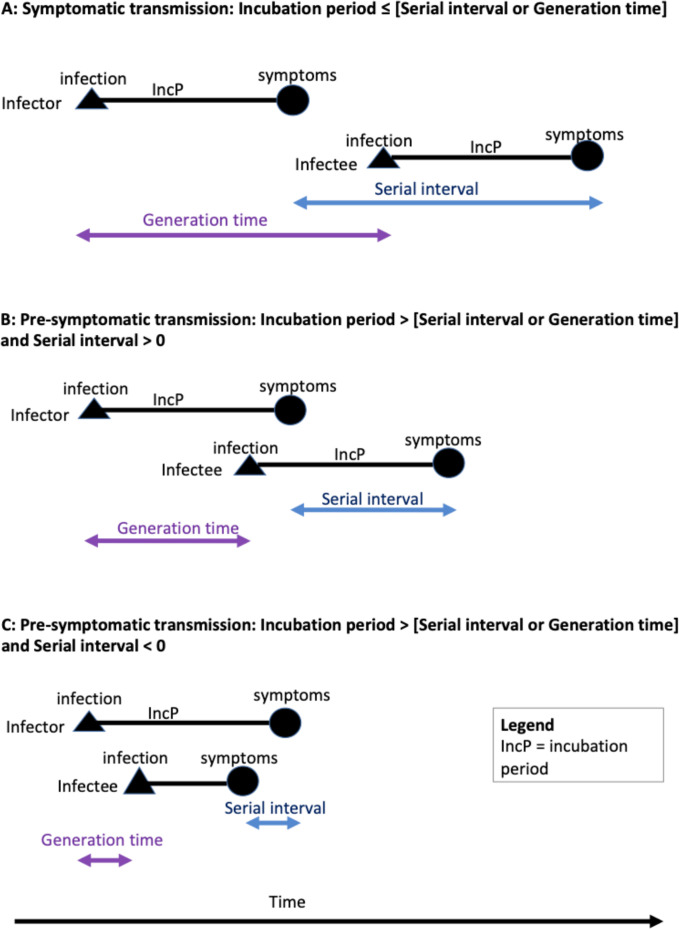
Objective: To estimate the proportion of presymptomatic transmission of SARS-CoV-2 infection that can occur, and the timing of transmission relative to symptom onset.
Setting/design: Secondary analysis of international published data.
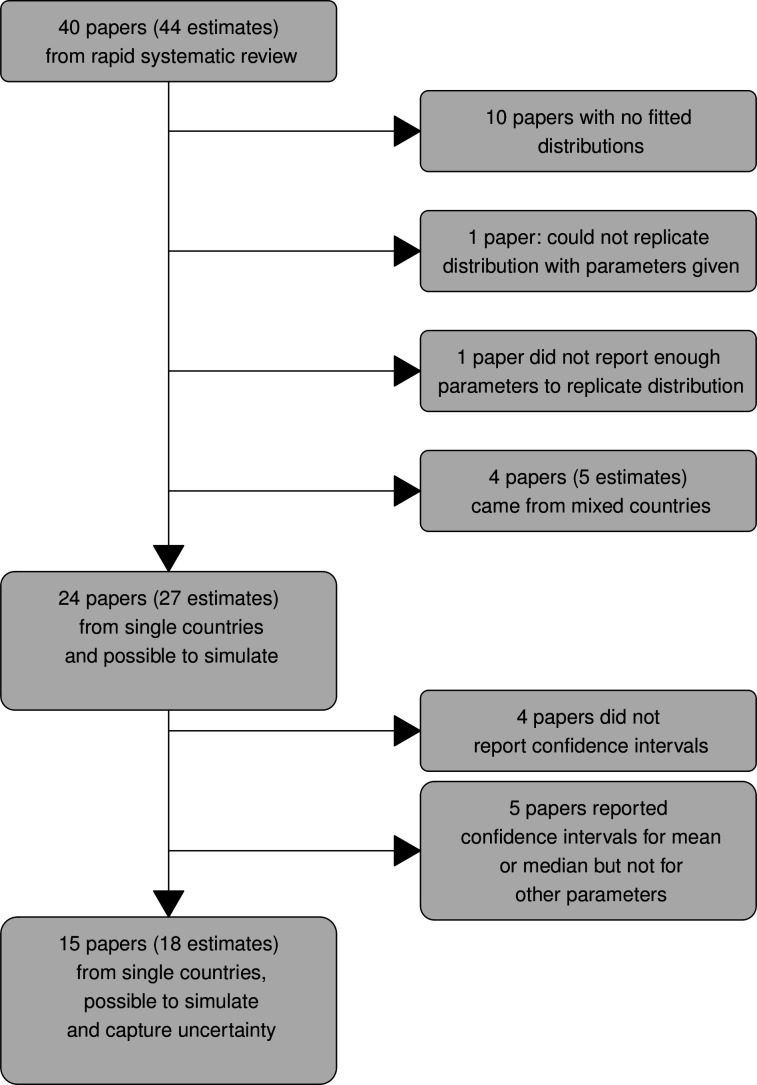
Data sources: Meta-analysis of COVID-19 incubation period and a rapid review of serial interval and generation time, which are published separately.
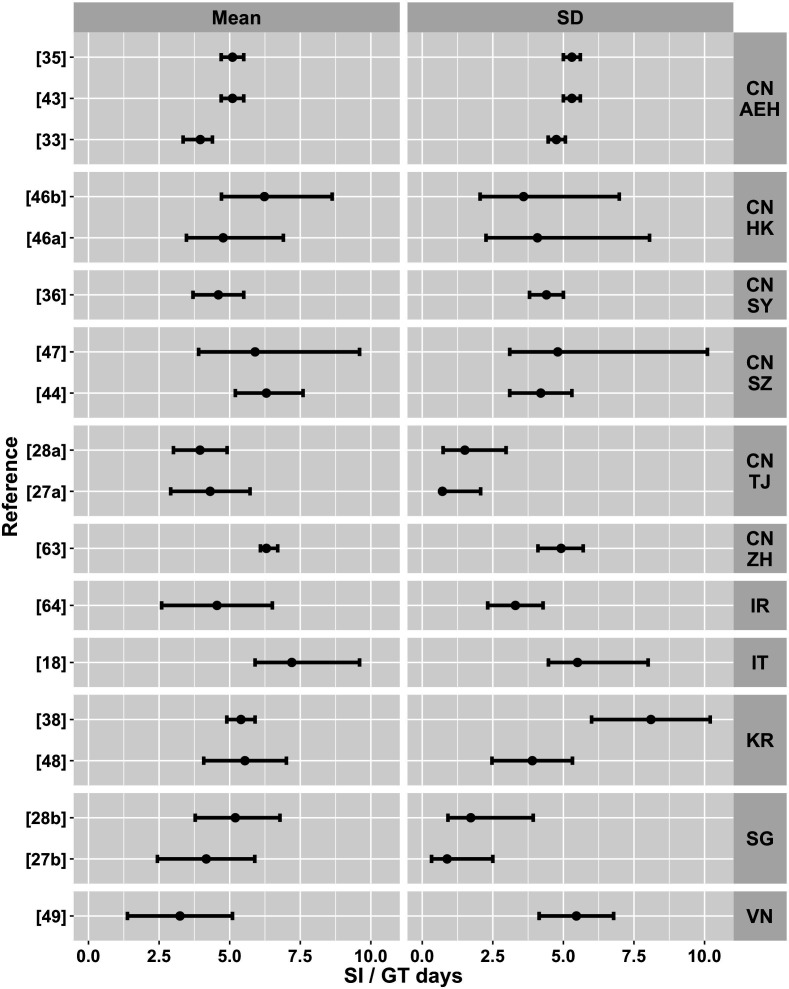
Participants: Data from China, the Islamic Republic of Iran, Italy, Republic of Korea, Singapore and Vietnam from December 2019 to May 2020.
Methods: Simulations were generated of incubation period and of serial interval or generation time. From these, transmission times relative to symptom onset, and the proportion of presymptomatic transmission, were estimated.
Outcome measures: Transmission time of SARS-CoV-2 relative to symptom onset and proportion of presymptomatic transmission.
Results: Based on 18 serial interval/generation time estimates from 15 papers, mean transmission time relative to symptom onset ranged from -2.6 (95% CI -3.0 to -2.1) days before infector symptom onset to 1.4 (95% CI 1.0 to 1.8) days after symptom onset. The proportion of presymptomatic transmission ranged from 45.9% (95% CI 42.9% to 49.0%) to 69.1% (95% CI 66.2% to 71.9%).
Conclusions: There is substantial potential for presymptomatic transmission of SARS-CoV-2 across a range of different contexts. This highlights the need for rapid case detection, contact tracing and quarantine. The transmission patterns that we report reflect the combination of biological infectiousness and transmission opportunities which vary according to context.
Keywords: epidemiology; infection control; infectious diseases; public health; virology.
© Author(s) (or their employer(s)) 2021. Re-use permitted under CC BY-NC. No commercial re-use. See rights and permissions. Published by BMJ.
Conflict of interest statement
Competing interests: None declared.
Figures


References
-
- WHO . COVID-19 situation reports, 2020. Available: https://www.who.int/emergencies/diseases/novel-coronavirus-2019/situatio... [Accessed 19 Apr 2021].
-
- Roberts L. Polio, measles, other diseases set to surge as COVID-19 forces suspension of vaccination campaigns | Science | AAAS. Sci. Mag. Newsl, 2020. Available: https://www.sciencemag.org/news/2020/04/polio-measles-other-diseases-set... [Accessed 4 May 2020].
Publication types
MeSH terms
LinkOut - more resources
Full Text Sources
Medical
Miscellaneous