. 2021 Nov;11(11):2796-2811.
doi: 10.1158/2159-8290.CD-20-1647. Epub 2021 Jun 28.

Genomic and Transcriptomic Analyses of Breast Cancer Primaries and Matched Metastases in AURORA, the Breast International Group (BIG) Molecular Screening Initiative

Affiliations

Genomic and Transcriptomic Analyses of Breast Cancer Primaries and Matched Metastases in AURORA, the Breast International Group (BIG) Molecular Screening Initiative

Philippe Aftimos et al. Cancer Discov. 2021 Nov.

Abstract

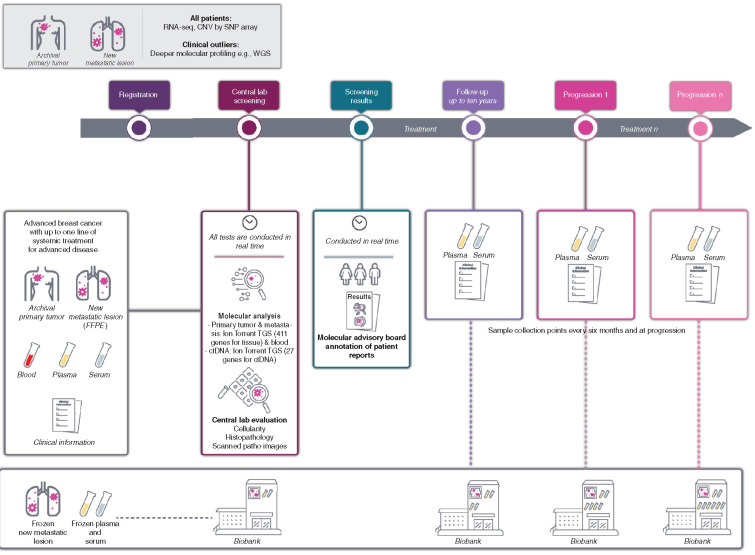
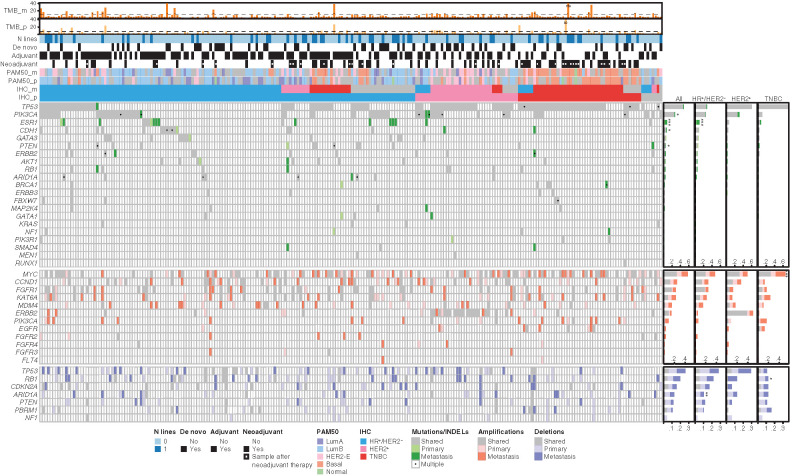
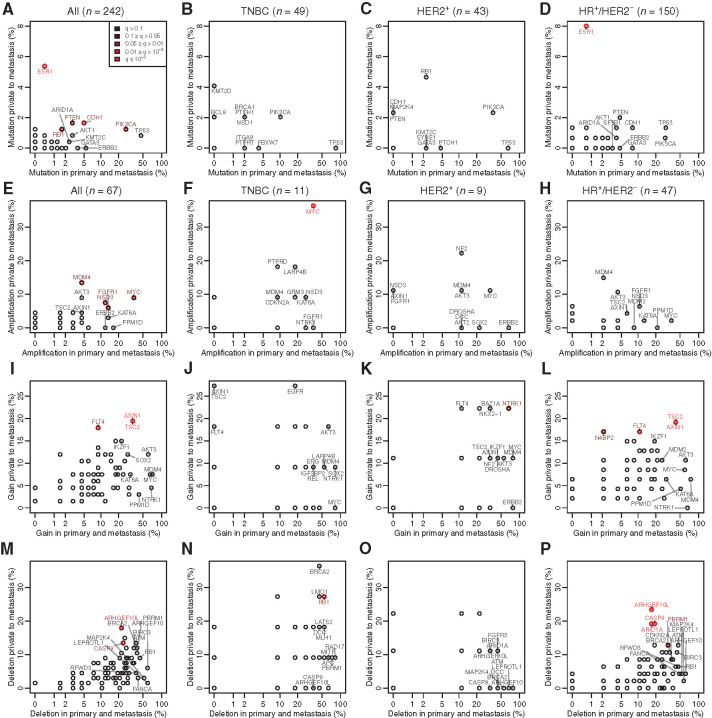
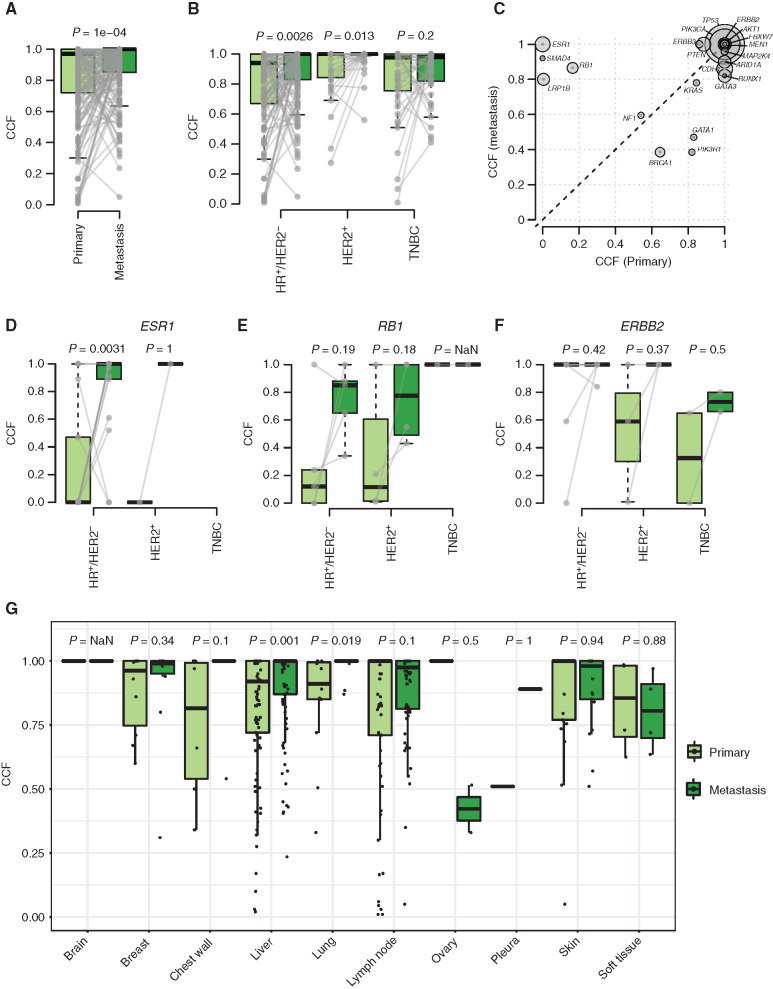
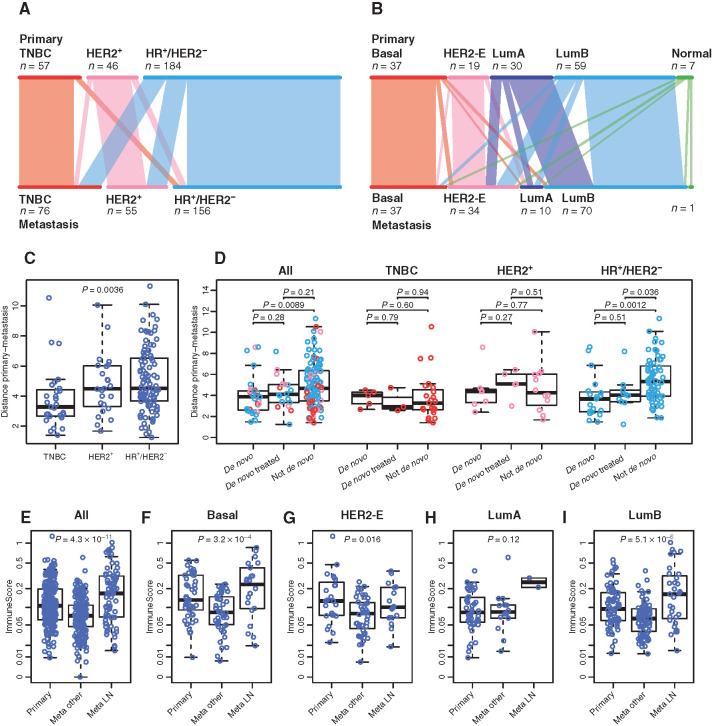
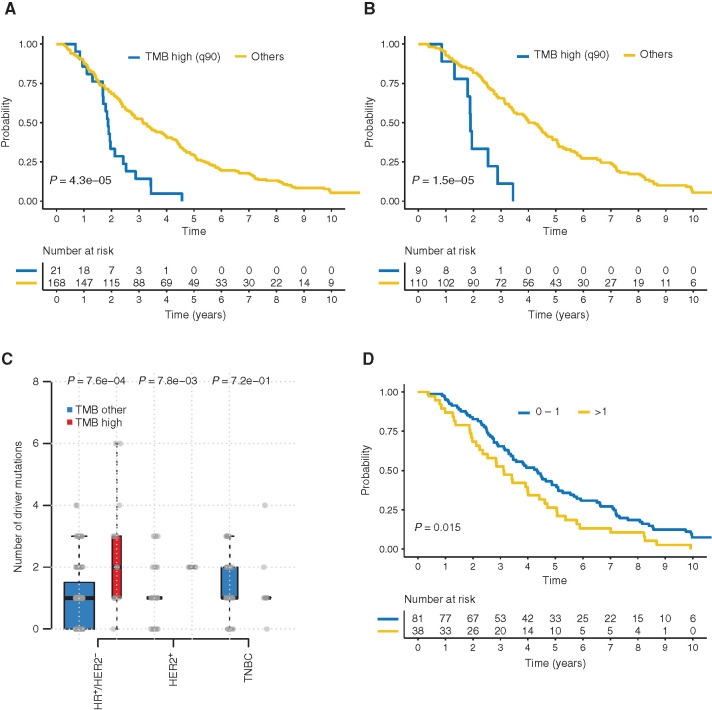
AURORA aims to study the processes of relapse in metastatic breast cancer (MBC) by performing multi-omics profiling on paired primary tumors and early-course metastases. Among 381 patients (primary tumor and metastasis pairs: 252 targeted gene sequencing, 152 RNA sequencing, 67 single nucleotide polymorphism arrays), we found a driver role for GATA1 and MEN1 somatic mutations. Metastases were enriched in ESR1, PTEN, CDH1, PIK3CA, and RB1 mutations; MDM4 and MYC amplifications; and ARID1A deletions. An increase in clonality was observed in driver genes such as ERBB2 and RB1. Intrinsic subtype switching occurred in 36% of cases. Luminal A/B to HER2-enriched switching was associated with TP53 and/or PIK3CA mutations. Metastases had lower immune score and increased immune-permissive cells. High tumor mutational burden correlated to shorter time to relapse in HR+/HER2- cancers. ESCAT tier I/II alterations were detected in 51% of patients and matched therapy was used in 7%. Integration of multi-omics analyses in clinical practice could affect treatment strategies in MBC. SIGNIFICANCE: The AURORA program, through the genomic and transcriptomic analyses of matched primary and metastatic samples from 381 patients with breast cancer, coupled with prospectively collected clinical data, identified genomic alterations enriched in metastases and prognostic biomarkers. ESCAT tier I/II alterations were detected in more than half of the patients.This article is highlighted in the In This Issue feature, p. 2659.


Figures

Figure 1. Study design. Illustration of the design of the AURORA molecular screening program including the baseline and longitudinal collections of samples as well as the clinical data. ctDNA, circulating tumor DNA.
Figure 1.
Study design. Illustration of the design of the AURORA molecular screening program including the baseline and longitudinal collections of samples as well as the clinical data. ctDNA, circulating tumor DNA.
Figure 2. Repertoire of somatic gene alterations. Oncoplot of the relevant genomic alterations in the set of 242 patients with available Target Gene Sequencing (TGS) data for primary and metastatic samples. From top to bottom, the oncoplot includes three sections: tumor mutational burden (TMB), clinical data, and genomic alterations. TMB section shows the bar plots of TMB in primary and metastatic samples. Dashed lines refer to the TMB threshold used to define high-TMB patients based on the 90th percentile of the TMB distribution (corresponding to 8 for primary and 11 for metastatic samples). Clinical data section includes information about the number of treatment lines for metastatic disease, de novo metastatic disease, adjuvant and neoadjuvant therapy, and molecular subtype information in primary and metastatic samples by PAM50 and IHC. Genomic alterations are classified as shared (if present in both primary and metastatic samples), primary (private to primary sample), and metastatic (private to metastatic samples). Genomic alterations include driver mutations (single-nucleotide variants and insertions/deletions) in driver genes, amplifications in oncogenes, and deletions in tumor suppressor genes. On the right, the bar plots summarize, for each gene, the frequency of shared, private to primary, and private to metastatic events. The asterisks refer to genes showing significant difference in terms of alteration frequency in metastatic compared to primary samples (*, P < 0.05; **, P < 0.01; ***, P < 0.001). Genes (SNVs) with significant positive selection on missense mutations and/or truncating substitutions on the dN/dS analysis are represented in the figure. We have included in the figure CNVs of genes known as breast cancer drivers.
Figure 2.
Repertoire of somatic gene alterations. Oncoplot of the relevant genomic alterations in the set of 242 patients with available Target Gene Sequencing (TGS) data for primary and metastatic samples. From top to bottom, the oncoplot includes three sections: tumor mutational burden (TMB), clinical data, and genomic alterations. TMB section shows the bar plots of TMB in primary and metastatic samples. Dashed lines refer to the TMB threshold used to define high-TMB patients based on the 90th percentile of the TMB distribution (corresponding to 8 for primary and 11 for metastatic samples). Clinical data section includes information about the number of treatment lines for metastatic disease, de novo metastatic disease, adjuvant and neoadjuvant therapy, and molecular subtype information in primary and metastatic samples by PAM50 and IHC. Genomic alterations are classified as shared (if present in both primary and metastatic samples), primary (private to primary sample), and metastatic (private to metastatic samples). Genomic alterations include driver mutations (single-nucleotide variants and insertions/deletions) in driver genes, amplifications in oncogenes, and deletions in tumor suppressor genes. On the right, the bar plots summarize, for each gene, the frequency of shared, private to primary, and private to metastatic events. The asterisks refer to genes showing significant difference in terms of alteration frequency in metastatic compared to primary samples (*, P < 0.05; **, P < 0.01; ***, P < 0.001). Genes (SNVs) with significant positive selection on missense mutations and/or truncating substitutions on the dN/dS analysis are represented in the figure. We have included in the figure CNVs of genes known as breast cancer drivers.
Figure 3. Comparison of the truncal aberrations with those private to the metastasis. All plots are on paired samples, each point representing the percentage of tumors with an aberration common between the primary tumor and the metastasis versus the percentage of tumors with an aberration found only in the metastasis. Mutations are shown (A, all subtypes; B, TNBC; C, HER2+; D, HR+/HER2−) as well as CN amplifications (normalize CN > 4; E, all subtypes; F, TNBC; G, HER2+; H, HR+/HER2−), gains (normalized CN > 1.5; I, all subtypes; J, TNBC; K, HER2+; L, HR+/HER2−) and deletions (normalized CN < 1.5; M, all subtypes; N, TNBC; O, HER2+; P, HR+/HER2−). The points are colored in function of their q-values, which assess whether a given aberration is more often private to the mutation than expected by the play of chance, corrected for multiple testing by panel.
Figure 3.
Comparison of the truncal aberrations with those private to the metastasis. All plots are on paired samples, each point representing the percentage of tumors with an aberration common between the primary tumor and the metastasis versus the percentage of tumors with an aberration found only in the metastasis. Mutations are shown (A, all subtypes; B, TNBC; C, HER2+; D, HR+/HER2) as well as CN amplifications (normalize CN > 4; E, all subtypes; F, TNBC; G, HER2+; H, HR+/HER2), gains (normalized CN > 1.5; I, all subtypes; J, TNBC; K, HER2+; L, HR+/HER2) and deletions (normalized CN < 1.5; M, all subtypes; N, TNBC; O, HER2+; P, HR+/HER2). The points are colored in function of their q-values, which assess whether a given aberration is more often private to the mutation than expected by the play of chance, corrected for multiple testing by panel.
Figure 4. CCF changes between primary and metastatic samples. Box plots showing the distribution of median CCF by patient in paired primary and metastatic samples (A) and stratified by subtype (HR+/HER2−, HER2+, TNBC; B). Gray lines refer to paired samples. C, Median CCF by driver genes in metastatic (y-axis) versus primary (x-axis) samples. The size of the circles refers to each gene alteration frequency. Box plots of the distribution of CCF for driver mutations in ESR1 (D), RB1 (E), and ERBB2 (F), stratified by subtype. G, Distribution of median CCF in paired primary and metastatic samples by biopsy site. P values are estimated by paired Wilcoxon–Mann–Whitney test.
Figure 4.
CCF changes between primary and metastatic samples. Box plots showing the distribution of median CCF by patient in paired primary and metastatic samples (A) and stratified by subtype (HR+/HER2, HER2+, TNBC; B). Gray lines refer to paired samples. C, Median CCF by driver genes in metastatic (y-axis) versus primary (x-axis) samples. The size of the circles refers to each gene alteration frequency. Box plots of the distribution of CCF for driver mutations in ESR1 (D), RB1 (E), and ERBB2 (F), stratified by subtype. G, Distribution of median CCF in paired primary and metastatic samples by biopsy site. P values are estimated by paired Wilcoxon–Mann–Whitney test.
Figure 5. RNA-seq of paired primary tumors and metastatic samples. A and B, Subtype switching, on IHC subtypes (A) or on PAM50, estimated from RNA-seq (B). C, Distribution of the distances between primaries and metastases in term of expression of the PAM50 genes, in function of the clinical subtype. D, Similar comparison as C, but between untreated de novo metastatic patients, treated de novo metastatic patients and patients with a later relapse. E–I, Difference in immune signal between primary and metastasis across PAM50 subtypes. “Meta LN” are lymph node metastases; “Meta other” are all other metastases.
Figure 5.
RNA-seq of paired primary tumors and metastatic samples. A and B, Subtype switching, on IHC subtypes (A) or on PAM50, estimated from RNA-seq (B). C, Distribution of the distances between primaries and metastases in term of expression of the PAM50 genes, in function of the clinical subtype. D, Similar comparison as C, but between untreated de novo metastatic patients, treated de novo metastatic patients and patients with a later relapse. E–I, Difference in immune signal between primary and metastasis across PAM50 subtypes. “Meta LN” are lymph node metastases; “Meta other” are all other metastases.
Figure 6. TMB and patient outcome. A, TTR by TMB in all subtypes primary samples. B, TTR by TMB in HR+/HER2− primary samples. C, TMB and number of drivers correlation HR+/HER2−. D, TTR by number of drivers HR+/HER2− primary samples.
Figure 6.
TMB and patient outcome. A, TTR by TMB in all subtypes primary samples. B, TTR by TMB in HR+/HER2 primary samples. C, TMB and number of drivers correlation HR+/HER2. D, TTR by number of drivers HR+/HER2 primary samples.

Comment in

  • doi: 10.1158/2159-8290.CD-11-11-ITI

References

    1. Caswell-Jin JL, Plevritis SK, Tian L, Cadham CJ, Xu C, Stout NKet al. . Change in survival in metastatic breast cancer with treatment advances: meta-analysis and systematic review. JNCI Cancer Spectrum 2018;2:pky062. - PMC - PubMed
    1. Cardoso F, Paluch-Shimon S, Senkus E, Curigliano G, Aapro MS, André Fet al. . 5th ESO-ESMO international consensus guidelines for advanced breast cancer (ABC 5). Ann Oncol 2020;31:1623–49. - PMC - PubMed
    1. Maetens M, Brown D, Irrthum A, Aftimos P, Viale G, Loibl Set al. . The AURORA pilot study for molecular screening of patients with advanced breast cancer-a study of the breast international group. NPJ Breast Cancer 2017;3:23. - PMC - PubMed
    1. Martincorena I, Raine KM, Gerstung M, Dawson KJ, Haase K, Van Loo Pet al. . Universal patterns of selection in cancer and somatic tissues. Cell 2017;171:1029–41. - PMC - PubMed
    1. Li Y, Ke Q, Shao Y, Zhu G, Li Y, Geng Net al. . GATA1 induces epithelial-mesenchymal transition in breast cancer cells through PAK5 oncogenic signaling. Oncotarget 2015;6:4345–56. - PMC - PubMed

Publication types