. 2021 Jun 28;10(1):133.
doi: 10.1038/s41377-021-00574-x.

Shot-noise limited, supercontinuum-based optical coherence tomography

Affiliations

Shot-noise limited, supercontinuum-based optical coherence tomography

Shreesha Rao D S et al. Light Sci Appl. .

Abstract

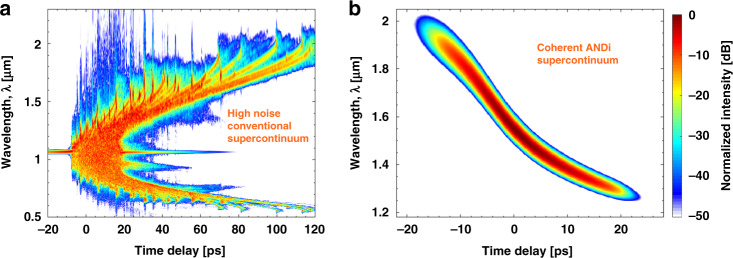
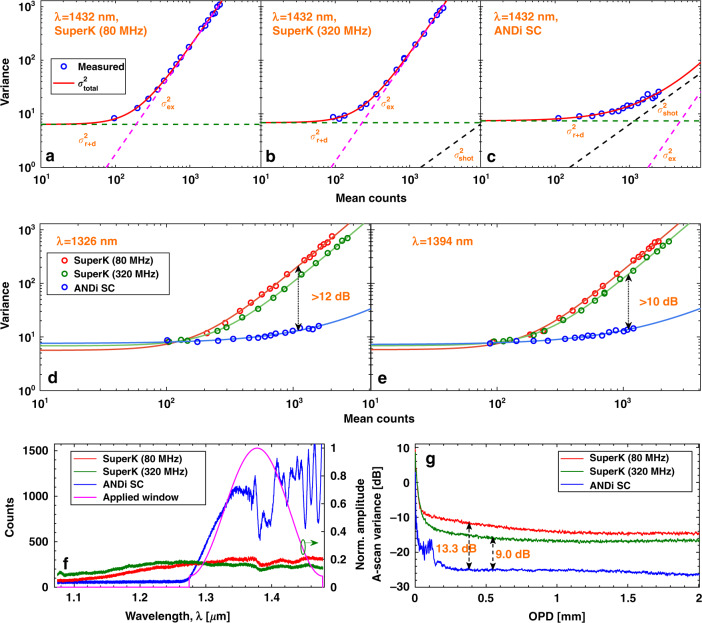
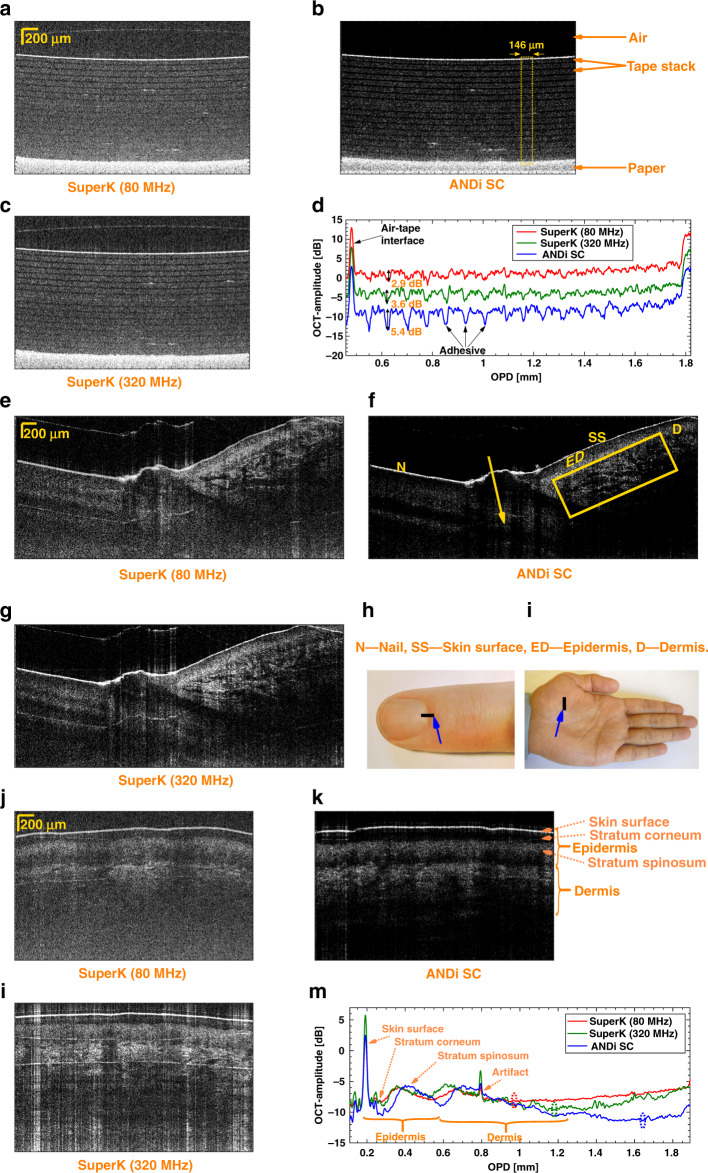
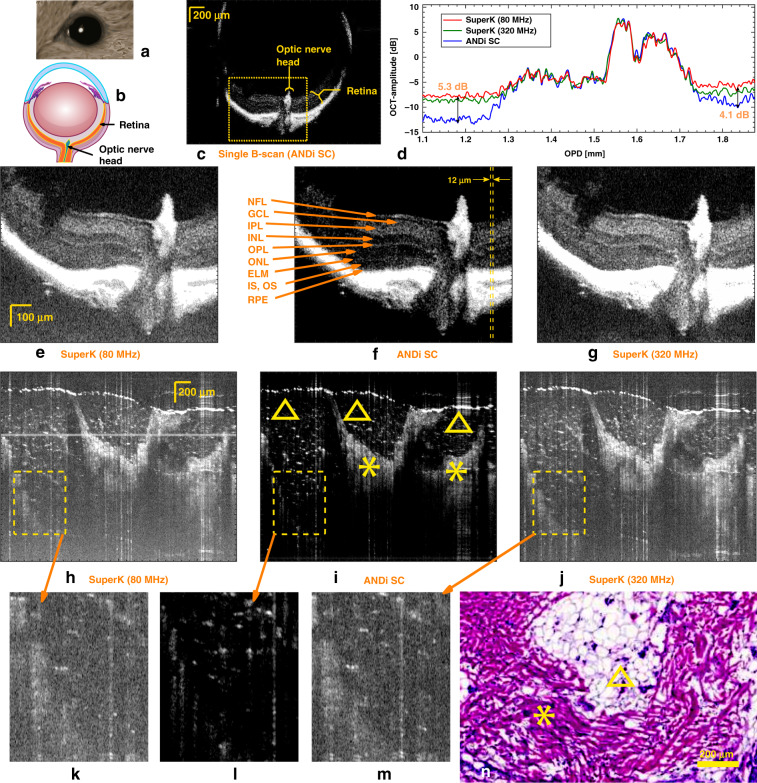
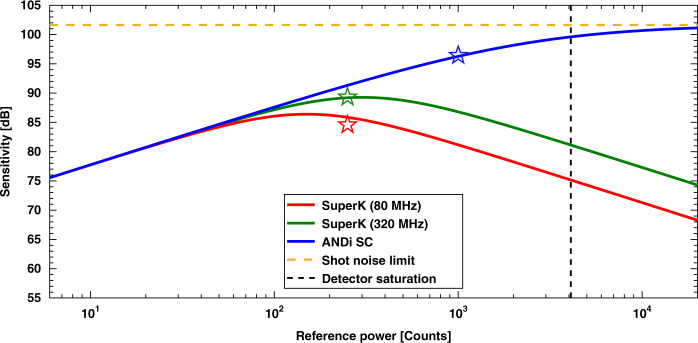
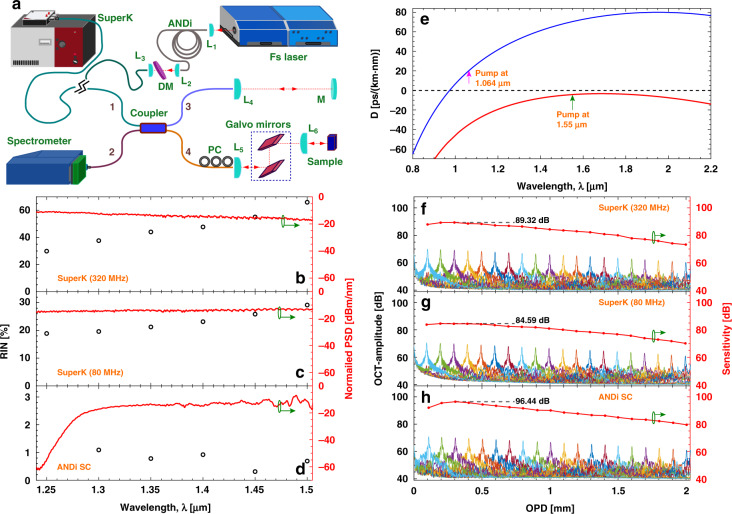
We present the first demonstration of shot-noise limited supercontinuum-based spectral domain optical coherence tomography (SD-OCT) with an axial resolution of 5.9 μm at a center wavelength of 1370 nm. Current supercontinuum-based SD-OCT systems cannot be operated in the shot-noise limited detection regime because of severe pulse-to-pulse relative intensity noise of the supercontinuum source. To overcome this disadvantage, we have developed a low-noise supercontinuum source based on an all-normal dispersion (ANDi) fiber, pumped by a femtosecond laser. The noise performance of our 90 MHz ANDi fiber-based supercontinuum source is compared to that of two commercial sources operating at 80 and 320 MHz repetition rate. We show that the low-noise of the ANDi fiber-based supercontinuum source improves the OCT images significantly in terms of both higher contrast, better sensitivity, and improved penetration. From SD-OCT imaging of skin, retina, and multilayer stacks we conclude that supercontinuum-based SD-OCT can enter the domain of shot-noise limited detection.


Conflict of interest statement

The authors declare no competing interests.

Figures

Fig. 1
Fig. 1. Output of SC sources.
Simulated single-shot output spectrograms of (a) a typical conventional long-pulse pumped SC source and (b) a typical fully coherent ANDi SC source
Fig. 2
Fig. 2. OCT system noise characterization.
The variance in counts versus the mean counts (over 1024 measurements) at 1432 nm for the 80 MHz SuperK extreme (a), 320 MHz SuperK extreme (b), and ANDi SC source with 90 MHz repetition rate (c). Comparison of the variance in counts versus the mean counts for the 80 MHz SuperK extreme, 320 MHz SuperK extreme, and ANDi SC source with 90 MHz repetition rate at 1326 nm (d), and 1394 nm (e). Spectral counts across the spectrometer bandwidth for the three sources, when the counts at 1432 nm is fixed at the optimum value for imaging (250 counts for SuperK extreme sources and 1000 counts for the ANDi SC source) (f). The magenta curve shows the window used in the signal processing. g Corresponding variance in A-scans over 1024 measurements. In (dg) the 80 MHz SuperK extreme, 320 MHz SuperK extreme, and ANDi SC source are shown as red, green, and blue curves, respectively. All measurements are taken with blocked sample arm
Fig. 3
Fig. 3. OCT imaging of tape layers and a finger.
Single B-scans of tape layers (2 × 3 mm), obtained using the 80 MHz SuperK extreme (a), ANDi SC (b), and 320 MHz SuperK extreme (c) sources. Averaged A-scans within the 146 μm wide dotted box in (b) for the three sources offset by 5 dB (d). The average is taken over 49 A-scans equally spaced within the dotted box. Single B-scans of a finger where the nail begins (2 × 4.5 mm) [see photo (h)], obtained using the 80 MHz SuperK extreme (e), ANDi SC (f), and 320 MHz SuperK extreme (g) sources. Single B-scans of the rough skin on a hand palm (2 × 3 mm) [see photo (i)] obtained using the 80 MHz SuperK extreme (j), ANDi SC (k), and 320 MHz SuperK extreme (l) sources. Averaged A-scan (averaged over entire B-scan, corresponding to 1024 A-scans) of the rough palm skin for the three sources (m). Dashed ellipses mark the penetration depth
Fig. 4
Fig. 4. OCT imaging of rat eye and human fat tissue.
Ex vivo rat-eye imaging: Artistic image of a mouse eye (a) with a cross-sectional schematic shown in (b). Single B-scan OCT image in depth of a 1.95 × 2.62 mm section of a mouse retina obtained using the ANDi SC source (c). Averaged A-scans (averaged over 4 equally spaced A-scans) from the marked region in (f) for the three sources (d). Zooms of the retina and optic nerve in the area marked by a yellow box in (c) using the 80 MHz SuperK extreme (e), ANDi SC (f), and 320 MHz SuperK extreme (g) sources (all averaged over 9 B-scans). NFL nerve fiber layer, GCL ganglion cell layer, IPL inner plexiform layer, OPL outer plexiform layer, ONL outer nuclear layer, ELM external limiting membrane, IS, OS inner segments, outer segments of the photoreceptors, and RPE retinal pigment epithelium. Ex vivo imaging of human fat tissue: 1.9 × 3 mm human skin biopsy averaged over nine single B-scans, obtained using the 80 MHz SuperK extreme (h), ANDi SC (i), and 320 MHz SuperK extreme (j) sources. Histology of fat tissue (n). Triangles and stars mark tissue types of cutaneous fat tissue and connective tissue of reticular dermis, respectively
Fig. 5
Fig. 5. OCT sensitivity.
Theoretical sensitivity as a function of reference power for the 80  MHz SuperK extreme, 320  MHz SuperK extreme, and ANDi SC sources. Stars represent the experimentally obtained sensitivities presented in the materials and methods section. Model parameters are found from experimental system characterization and are given in detail also in the materials and methods section. Calculations are based on refs. ,
Fig. 6
Fig. 6. OCT system and SC source characterization.
Schematic of the OCT setup (a) [Li lens, M mirror, DM dichroic mirror, and PC polarization controller]. Normalized power spectral density (PSD) profiles measured using an OSA (red curves, right axis) and RIN profiles (black circles, left axis) for the 320 MHz SuperK extreme (b), the 80 MHz SuperK extreme (c), and the ANDi based low-noise SC source (d). Calculated dispersion profile for the nonlinear fiber used in the SuperK extreme (blue) and the measured dispersion of the GeO2 doped silica ANDi fiber (red) (e). Mean OCT-amplitude (over 1024 measurements) of a sample mirror at 20 different axial positions on the left axis, and the sensitivity on the right, for the SuperK extreme at 320 MHz (f) and 80 MHz (g), and the ANDi based low-noise SC source (h)

References

    1. Huang D, et al. Optical coherence tomography. Science. 1991;254.5035:1178–1181. doi: 10.1126/science.1957169. - DOI - PMC - PubMed
    1. Wieser W, Biedermann BR, Klein T, Eigenwillig CM, Huber R. Multi-megahertz OCT: high quality 3D imaging at 20 million A-scans and 4.5 GVoxels per second. Opt. Express. 2010;18.14:14685–14704. doi: 10.1364/OE.18.014685. - DOI - PubMed
    1. Swanson EA, Fujimoto JG. The ecosystem that powered the translation of OCT from fundamental research to clinical and commercial impact [Invited] Biomed. Optics Express. 2017;8.3:1638–1664. doi: 10.1364/BOE.8.001638. - DOI - PMC - PubMed
    1. Dubois A, et al. Line-field confocal optical coherence tomography for high-resolution noninvasive imaging of skin tumors. J. Biomed. Opt. 2018;23.10:106007-1–106007-9. - PubMed
    1. de Boer JF, Leitgeb R, Wojtkowski M. Twenty-five years of optical coherence tomography: the paradigm shift in sensitivity and speed provided by Fourier domain OCT [Invited] Biomed. Opt. Express. 2017;8.7:3248–3280. doi: 10.1364/BOE.8.003248. - DOI - PMC - PubMed