. 2021 Jun 28;12(1):3996.
doi: 10.1038/s41467-021-24312-4.

Efficient long-range conduction in cable bacteria through nickel protein wires

Affiliations

Efficient long-range conduction in cable bacteria through nickel protein wires

Henricus T S Boschker et al. Nat Commun. .

Abstract

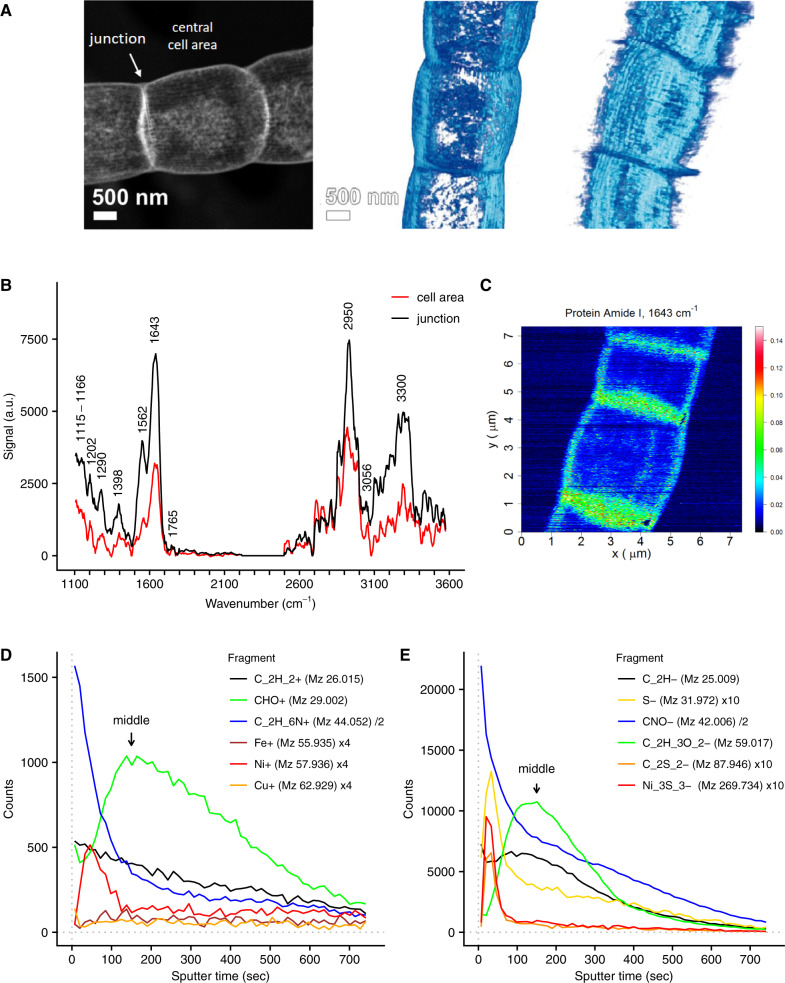
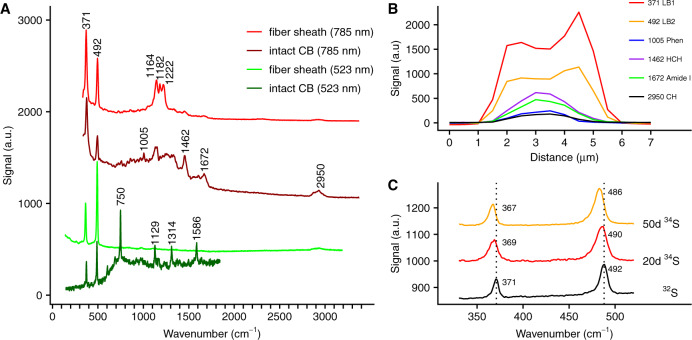
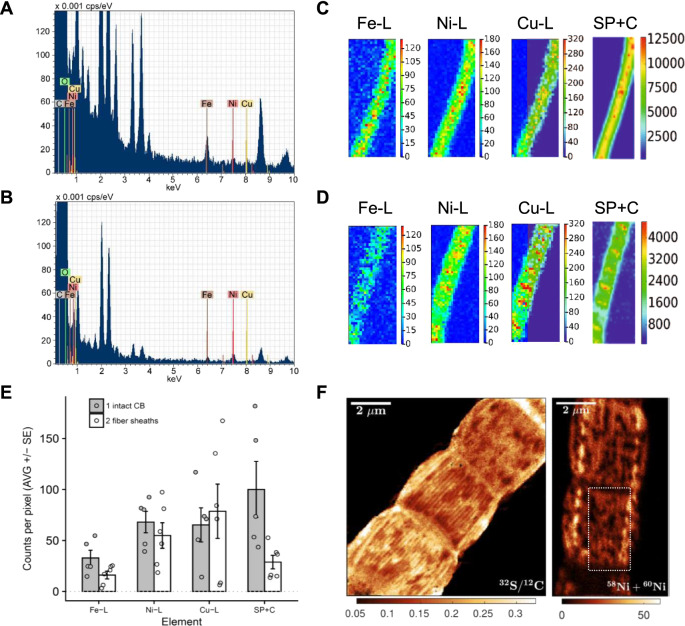
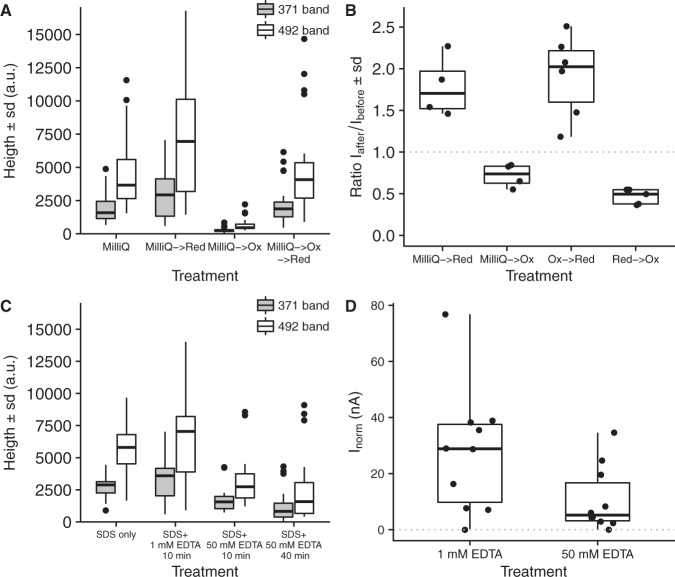
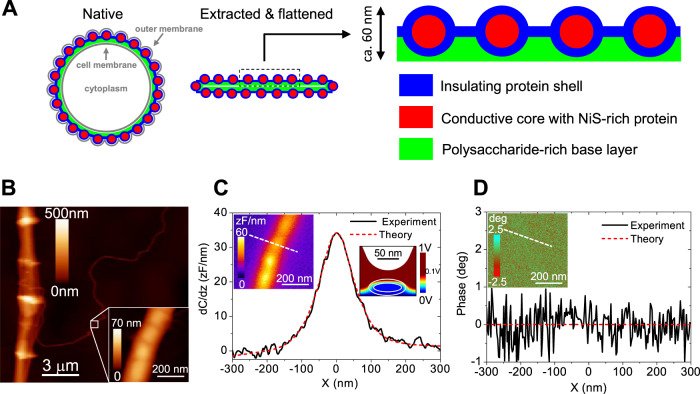
Filamentous cable bacteria display long-range electron transport, generating electrical currents over centimeter distances through a highly ordered network of fibers embedded in their cell envelope. The conductivity of these periplasmic wires is exceptionally high for a biological material, but their chemical structure and underlying electron transport mechanism remain unresolved. Here, we combine high-resolution microscopy, spectroscopy, and chemical imaging on individual cable bacterium filaments to demonstrate that the periplasmic wires consist of a conductive protein core surrounded by an insulating protein shell layer. The core proteins contain a sulfur-ligated nickel cofactor, and conductivity decreases when nickel is oxidized or selectively removed. The involvement of nickel as the active metal in biological conduction is remarkable, and suggests a hitherto unknown form of electron transport that enables efficient conduction in centimeter-long protein structures.


Conflict of interest statement

The authors declare no competing interests.

Figures

Fig. 1
Fig. 1. The conductive fiber sheath in cable bacteria is composed of a layer of protein on top of an acidic polysaccharide layer.
A STEM-HAADF imaging demonstrates that the fiber sheath is composed of parallel fibers imposed on a basal sheath. One 2D image (left panel) and two 3D tomographic reconstructions are shown. Independent replicas (N = 2) showed similar results. B AFM-IR spectra of fiber sheaths at cell areas and cell junctions (OPO laser, spectra are background corrected and averaged, cell area N = 14, junctions N = 11, a.u. is arbitrary units). C Fiber sheath AFM-IR mapping of the signal (a.u.) from the 1643 cm−1 Amide I protein band (QCL laser, arbitrary units; see Supplementary Fig. 7 for corresponding AFM height and deflection images. Independent replicas (N = 2) showed similar results.). Representative ToF-SIMS depth profiles of fiber sheaths obtained in positive (D) and negative mode (E). A selection of fragments from different compound classes is shown (general organic carbon fragments: C2H2+ and C2H, protein derived fragments: C2H6N+ and CNO, carbohydrate derived fragments: CHO+ and C2H3O2 and sulfur and transition metals). See Supplementary Fig. 1 and Supplementary Note 1 for further information. Counts of individual fragments were scaled to improve clarity as indicated in the figure legends. The counts from Ni3S3 are the sum of all 58Ni and 60Ni isotopologues. Arrows denote the middle of the fiber sheath as calibrated by in situ AFM (59 ± 6 nm, see Supplementary Fig. 2).
Fig. 2
Fig. 2. Raman spectra of intact cable bacteria and fiber sheaths indicating a sulfur-ligated metal group in the fiber sheath.
A Raman spectra collected with green (523 nm) and NIR (785 nm) lasers. The low-frequency bands at 371 and 492 cm−1 suggesting the presence of a metal group, and are present in all spectra. The dark green spectrum is from intact, living cable bacteria (CB) in a gradient slide, while the dark red spectrum is recorded on intact, dried cable bacterium filaments. The light green and light red spectra are from dried fiber sheaths. B Variation of the Raman signal (NIR laser) in a transversal section across an intact, dried cable bacterium filament, which was ca. 3 μm wide. The most prominent bands are shown: the two low-frequency bands (371 LB1, 492 LB2), phenylalanine ring-breathing (1005 Phen), CH2-bending (1462 HCH), the protein Amide I band (1672 Amide I) and CH-stretching (2950 CH). C Average Raman spectra (green laser) and peak shifts resulting from 34S labeling of intact, dried cable bacterium filaments. The two low-frequency bands are shown after 20 and 50 days of incubation and compared to the unlabeled control spectrum.
Fig. 3
Fig. 3. Elemental analysis shows that the fibers are Ni and S rich.
Representative STEM-EDX spectra from A intact cable bacteria and B fiber sheaths shows a detectable Ni signal and lower Fe and Cu levels in the fiber sheath. Elemental compositions are found in Supplementary Table 1. Representative synchrotron LEXRF maps for C intact cable bacteria (10 μm × 25 μm) and D fiber sheaths (11 μm × 27 μm). SP + C denotes Scatter Peak plus Compton and L denotes low-energy L-band. E Average counts per pixel from LEXRF maps showing that Ni is mainly found in the fiber sheath. Shown are the average of the maps ± SE (intact cable bacteria N = 5 and fiber sheaths N = 6, data are background corrected) and the data points for the individual maps. Data given for the detected transition metals and SP + C. The latter data were scaled to fit into the graph by setting the average of the intact cable bacteria (CB) counts to 100 (original counts 4290 ± 2640). F NanoSIMS images of fiber sheaths. Mapping of 32S/12C ion count ratio (first 100 planes) shows the sulfur rich fibers. The Ni (58Ni + 60Ni) ion count has a lower signal/noise ratio and its mapping (first 50 planes) only shows visible fibers in restricted regions (as indicated by the rectangle). The complete set of NanoSIMS images is given in Supplementary Fig. 5. Independent replicas (N = 2) showed similar results.
Fig. 4
Fig. 4. Redox and Ni-removal experiments suggest that the Ni/S group plays a role in electron conduction.
A The effect of oxidation and reduction on green laser Raman signals from the sulfur-ligated Ni group. The MilliQ → Red treatment (N = 30) was significantly higher than the MilliQ treatment (N = 28, p = 0.03) and the MilliQ → Ox treatment (N = 23) was significantly lower than all other treatments (p < 4 × 10−9). The MilliQ → Ox → Red treatment (N = 33) was not significantly different from the MilliQ (p = 0.7) and the MilliQ → Red (p = 0.07) treatments The ratio between the 371 and 492 cm−1 Raman bands was not affected by oxidation or reduction. B The effect of oxidation and reduction treatments on the conductance of individual fiber sheaths. The ratio of the electrical current (I) through the fiber sheath is plotted before and after treatment. The effect in all treatment pairs was significant (MilliQ → Red p = 0.01 (N = 4); MilliQ → Ox p = 0.01 (N = 4); Ox → Red p = 0.001 (N = 6); Red → Ox p = 0.004 (N = 5), all tested against no effect Ratio = 1). C The effect of EDTA with on green laser Raman signals from the sulfur-ligated Ni group. The decrease in Raman signal between the standard protocol (N = 13) and both high EDTA treatments was significant (10 min. 50 mM EDTA p = 0.04 (N = 15); 40 min. 50 mM EDTA p = 0.03 (N = 22)). The SDS only treatment (N = 15) was not different from the standard protocol (p = 0.7). D The effect of high EDTA extraction on normalized conduction of individual fiber sheaths (Inorm: electrical current normalized to filament length 0.3 mm and bias 0.1 V). Fibers sheaths were extracted with the standard protocol (1% SDS + 1 mM EDTA 10 min) and high EDTA treatment (1% SDS + 50 mM EDTA 10 min). The decrease in Inorm between the standard protocol and the high EDTA treatment was significant (p = 0.041, N = 10). All replicas are for independent cells (Raman data) or fiber sheaths filaments (conduction data). The two-sided Mann–Whitney–Wilcoxon test was used to test for significance using the R-function “wilcox.test”. The center line of the box–whisker plots represents the median. The lower and upper box limits represent the 25% and 75% quantiles, respectively. The whiskers extend to the data range. Outliers are indicated in A and C; all data point are given in B and D.
Fig. 5
Fig. 5. Fiber sheath model and electrostatic properties.
A Compositional model of the conductive fiber sheath in cable bacteria based on the present findings. Cross-sections through a filament in the middle of a cell are drawn and the number of fibers has been reduced for clarity—a 4 μm diameter cable bacterium has typically ~60 fibers. In its native state (right panel), the fiber sheath is embedded periplasm between the cell and outer membrane and adopts a circular shape. After extraction, which removes the membranes and most of the cytoplasm and after drying upon a surface for analysis, the fiber sheath flattens, leading to two mirrored sheaths on top of each other (middle panel). The enlargement shows a section of the top sheath, which is the sample section probed by ToF-SIMS depth profiles and NanoSIMS images. Fibers are made of protein with a conductive Ni/S rich core and a non-conductive outer shell, and are embedded in a basal layer enriched in polysaccharide. B Topographic AFM image of a fiber sheath with a single isolated fiber detaching. The insert shows a detailed AFM image of this single fiber. C SDM amplitude image (right insert) and cross-sectional profile. D Corresponding SDM phase image (insert) and cross-sectional profile. Constant height (z = 66 nm) cross-section profiles are measured along the dashed lines shown in the left inserts. The red dotted lines in C and D represent model fits assuming the a fiber has a conductive core and an insulating outer shell. The right insert in C shows a vertical cross-section of the electric potential distribution as predicted by the model. Model parameters: shell thickness, d = 12 nm; fiber height, h = 42 nm; fiber width w = 87 nm; relative dielectric constants of the shell and core, εs = ω εc = 3; conductivity of the shell σs = 0 S/cm (insulating); conductivity of the core σc = 20 S/cm (see Supplementary Note 2 for treatment of SDM results and models tested). SDM analysis on a single fiber is available only from one samples as this is a rare event, but results from a double fiber and fiber sheaths are in agreement (see Supplementary Note 2).

References

    1. Nielsen LP, Risgaard-Petersen N, Fossing H, Christensen PB, Sayama M. Electric currents couple spatially separated biogeochemical processes in marine sediment. Nature. 2010;463:1071–1074. doi: 10.1038/nature08790. - DOI - PubMed
    1. Pfeffer C, et al. Filamentous bacteria transport electrons over centimetre distances. Nature. 2012;491:218–221. doi: 10.1038/nature11586. - DOI - PubMed
    1. Bjerg JT, et al. Long-distance electron transport in individual, living cable bacteria. Proc. Natl Acad. Sci. USA. 2018;115:5786–5791. doi: 10.1073/pnas.1800367115. - DOI - PMC - PubMed
    1. Meysman, F. J. R. Cable bacteria take a new breath using long-distance electricity. Trends Microbiol.10.1016/j.tim.2017.10.011 (2018). - PubMed
    1. Cornelissen, R. et al. The cell envelope structure of cable bacteria. Front. Microbiol.9, 3044 (2018). - PMC - PubMed

Publication types

MeSH terms