. 2021 Jun 28;11(1):13403.
doi: 10.1038/s41598-021-92636-8.

A control framework to optimize public health policies in the course of the COVID-19 pandemic

Affiliations

A control framework to optimize public health policies in the course of the COVID-19 pandemic

Igor M L Pataro et al. Sci Rep. .

Abstract

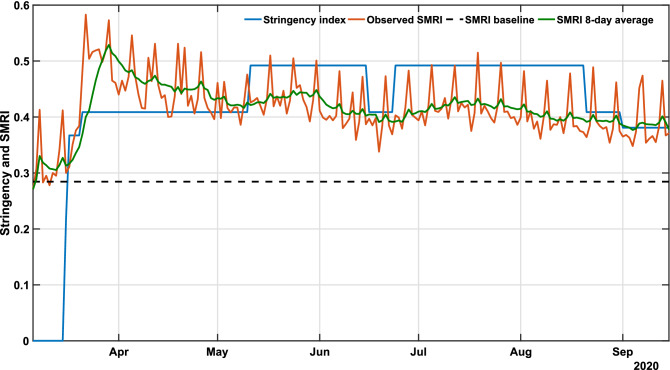
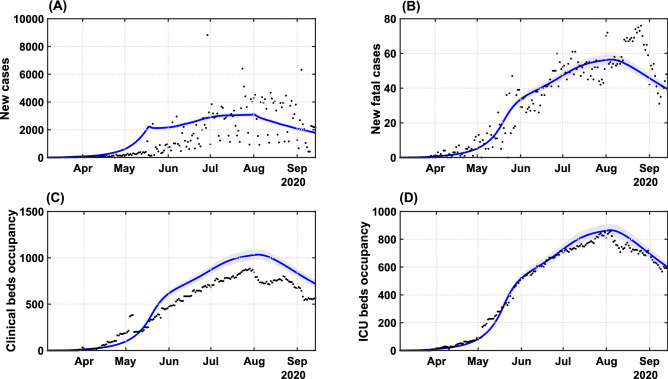
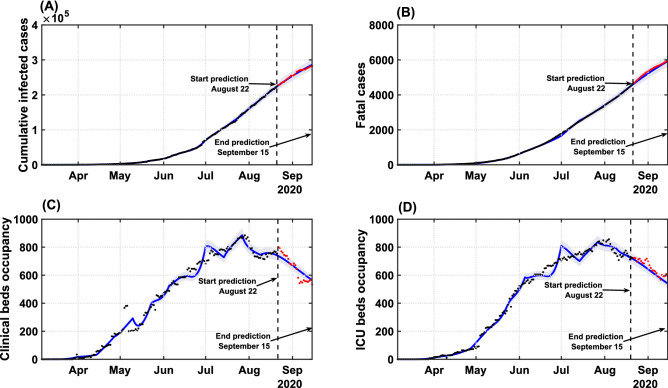
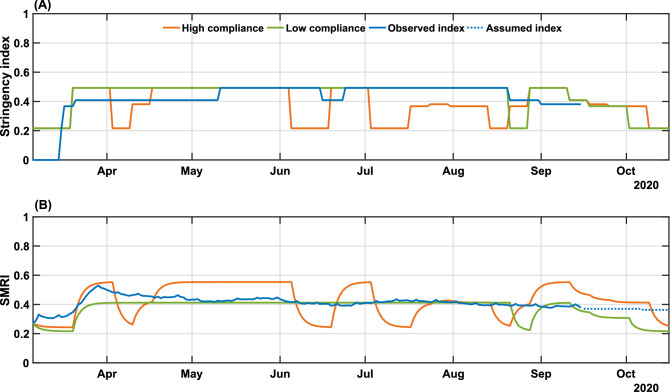
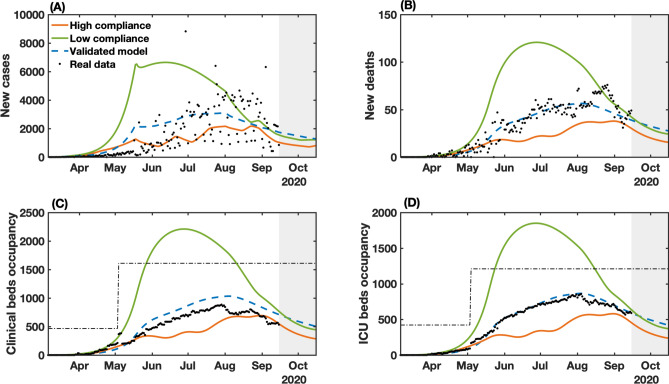
The SARS-CoV-2 pandemic triggered substantial economic and social disruptions. Mitigation policies varied across countries based on resources, political conditions, and human behavior. In the absence of widespread vaccination able to induce herd immunity, strategies to coexist with the virus while minimizing risks of surges are paramount, which should work in parallel with reopening societies. To support these strategies, we present a predictive control system coupled with a nonlinear model able to optimize the level of policies to stop epidemic growth. We applied this system to study the unfolding of COVID-19 in Bahia, Brazil, also assessing the effects of varying population compliance. We show the importance of finely tuning the levels of enforced measures to achieve SARS-CoV-2 containment, with periodic interventions emerging as an optimal control strategy in the long-term.


Conflict of interest statement

The authors declare no competing interests.

Figures

Figure 1
Figure 1
COVID-19 governmental polices and population response. The plot shows the stringency (blue), social mobility reduction (orange) indexes and its 8-day average (green) in Bahia. Raw data from March 6 to September 15, 2020 are shown in this graph. The dashed horizontal line represents the baseline SMRI average between February 1-28, 2020, indicating the level of popular circulation in a pre-COVID period.
Figure 2
Figure 2
Transmission dynamics of COVID-19 in Bahia. Effects of the implemented interventions, mobility patterns and respective coefficient of determination R2 on the dynamic of (A) cases (R2=0.4684), (B) deaths (R2=0.8871), (C) clinical hospitalization (R2=0.7953) and (D) ICU bed requirements (R2=0.9844) at the state level. The solid blue lines represent the evolution of the epidemic given by the SEIIHURD+ψ model without gains. The shaded error bands represent 5% of the curve extrapolation margin. The assumed parameter values are shown in Supplementary Table S1. Raw data (black dots) from March 6 to September 15, 2020, are shown in this graph with a daily timescale.
Figure 3
Figure 3
Model validation and forecast of the COVID-19 dynamics in Bahia. Model curves adjusted up to August 22 (blue lines), accounting for the identification procedure for gi parameters, and respective coefficient of determination R2 for: (A) cumulative cases (R2=0.9998); (B) deaths (R2=0.9994); (C) clinical hospitalization (R2=0.9872) and (D) ICU bed requirements (R2=0.9872) at the state level. Data beyond the dashed vertical line indicate the predicted values for the epidemiological parameters between August 22 and September 15. The shaded error bands represent 5% of the curve extrapolation margin. The assumed model parameter values are shown in Supplementary Table S4. Raw data (black dots) from March 6 to September 15, 2020, are shown in this graph with a daily timescale.
Figure 4
Figure 4
Real and simulated social mobility and governmental interventions in the state of Bahia. Levels of stringency (A) and social mobility reduction (B) indexes are shown for the high and low compliance scenarios, as well as the actual value of these metrics in the state-level during the period. The observed SMRI values (March 6-September 15) consist of a 8-day moving average. The dotted line in panel (B) indicates the assumed values of SMRI as described in Results. The high (Kψ=1.1247) and low (Kψ=0.8374) compliance scenarios represent the level of social mobility response related to the applied government measures.
Figure 5
Figure 5
NMPC-controlled simulated epidemic unfolding compared to real-world data in Bahia, Brazil. (A) New cases; (B) deaths; (C) clinical hospitalization and (D) ICU bed requirements at the state level. The dashed-blue lines represent the dynamics of the validated model presented in Fig. 2 considering the observed SMRI time series in Fig. 3B. The dashed-dotted lines represent the clinical and ICU bed limits, increased from May on, from 466 to 1610 for clinical beds and from 422 to 1210 for ICU beds. Raw data (black dots) from March 6 to September 15, 2020, are shown in this graph with a daily timescale. The high (Kψ=1.1247) and low (Kψ=0.8374) compliance scenarios represent the level of social mobility response related to the applied government measures.

Similar articles

Cited by

References

    1. Hsiang S, Allen D, Annan-Phan S, Bell K, Bolliger I, Chong T, Druckenmiller H, Huang LY, Hultgren A, Krasovich E, et al. The effect of large-scale anti-contagion policies on the COVID-19 pandemic. Nature. 2020;584:262. doi: 10.1038/s41586-020-2404-8. - DOI - PubMed
    1. Haug, N. et al. Ranking the effectiveness of worldwide COVID-19 government interventions. Nat. Hum. Behav. 1–10 (2020). - PubMed
    1. Valensisi G. Covid-19 and global poverty: are LDCs being left behind? Eur. J. Dev. Res. 2020;32:1535–1557. doi: 10.1057/s41287-020-00314-8. - DOI - PMC - PubMed
    1. Laborde, D., Will, M., & Vos, R. COVID-19 and global food security. J. Swinnen, J. McDermott, eds. (International Food Policy Research Institute–IFPRI, 2020), vol. 32, chap. 2, pp. 16–19. Washington, DC.
    1. Dong E, Du H, Gardner L. An interactive web-based dashboard to track COVID-19 in real time. Lancet Infect. Dis. 2020;20:533. doi: 10.1016/S1473-3099(20)30120-1. - DOI - PMC - PubMed

Publication types