

Exploring the chemical space of protein-protein interaction inhibitors through machine learning
- PMID: 34183730
- PMCID: PMC8238997
- DOI: 10.1038/s41598-021-92825-5
Exploring the chemical space of protein-protein interaction inhibitors through machine learning
Abstract
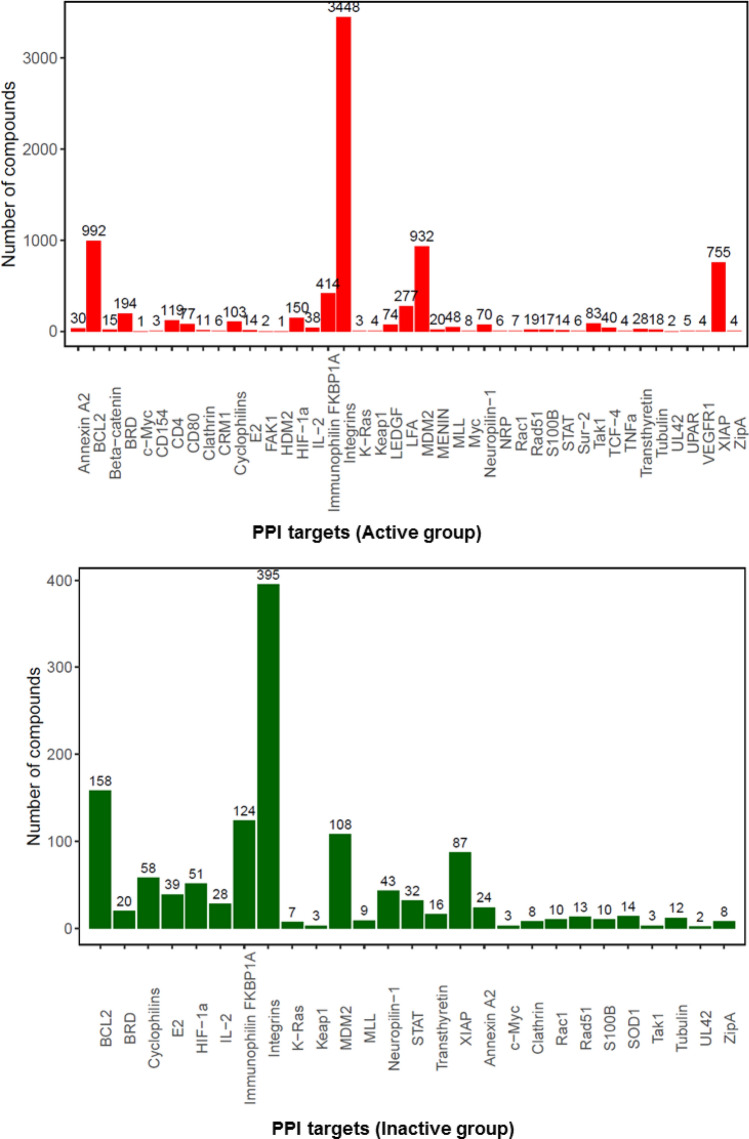
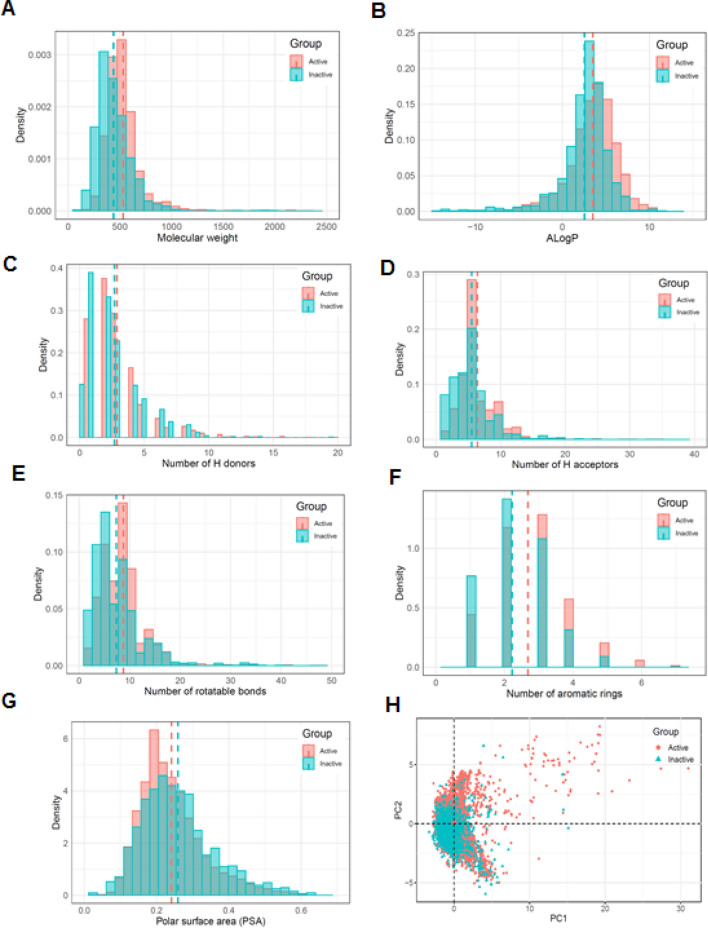
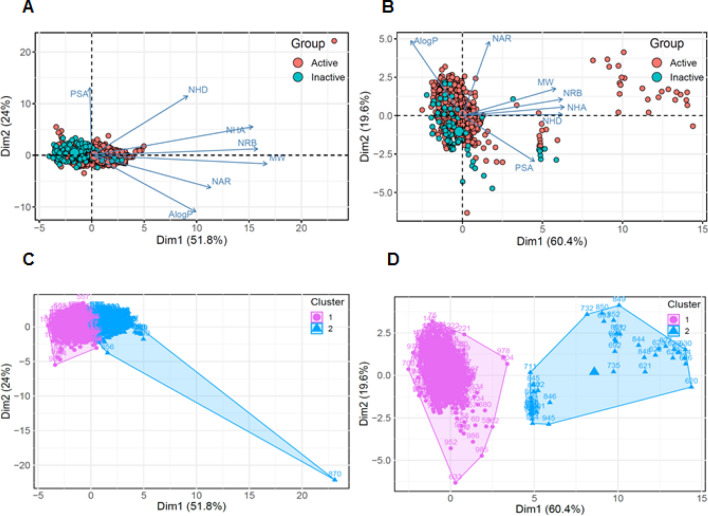
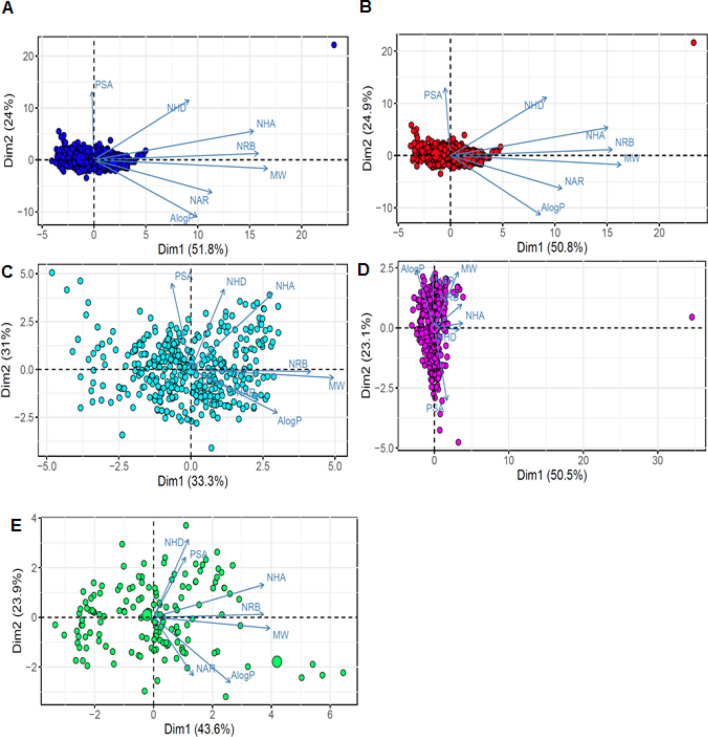
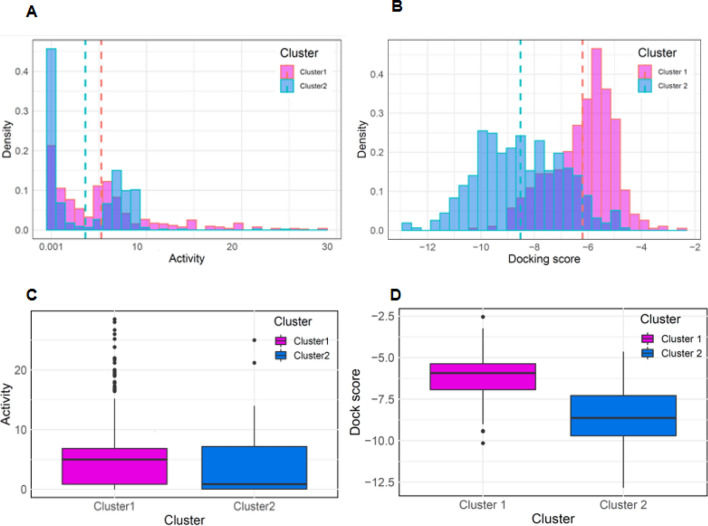
Although protein-protein interactions (PPIs) have emerged as the basis of potential new therapeutic approaches, targeting intracellular PPIs with small molecule inhibitors is conventionally considered highly challenging. Driven by increasing research efforts, success rates have increased significantly in recent years. In this study, we analyze the physicochemical properties of 9351 non-redundant inhibitors present in the iPPI-DB and TIMBAL databases to define a computational model for active compounds acting against PPI targets. Principle component analysis (PCA) and k-means clustering were used to identify plausible PPI targets in regions of interest in the active group in the chemical space between active and inactive iPPI compounds. Notably, the uniquely defined active group exhibited distinct differences in activity compared with other active compounds. These results demonstrate that active compounds with regions of interest in the chemical space may be expected to provide insights into potential PPI inhibitors for particular protein targets.
Conflict of interest statement
The authors declare no competing interests.
Figures
Similar articles
-
A leap into the chemical space of protein-protein interaction inhibitors.Curr Pharm Des. 2012;18(30):4648-67. doi: 10.2174/138161212802651571. Curr Pharm Des. 2012. PMID: 22650260 Free PMC article. Review.
-
iPPI-DB: a manually curated and interactive database of small non-peptide inhibitors of protein-protein interactions.Drug Discov Today. 2013 Oct;18(19-20):958-68. doi: 10.1016/j.drudis.2013.05.003. Epub 2013 May 17. Drug Discov Today. 2013. PMID: 23688585 Review.
-
Imbalance in chemical space: How to facilitate the identification of protein-protein interaction inhibitors.Sci Rep. 2016 Apr 1;6:23815. doi: 10.1038/srep23815. Sci Rep. 2016. PMID: 27034268 Free PMC article.
-
Benchmark Study Based on 2P2IDB to Gain Insights into the Discovery of Small-Molecule PPI Inhibitors.J Phys Chem B. 2018 Mar 8;122(9):2544-2555. doi: 10.1021/acs.jpcb.7b12658. Epub 2018 Feb 22. J Phys Chem B. 2018. PMID: 29420886
-
[Chemical libraries dedicated to protein-protein interactions].Med Sci (Paris). 2015 Mar;31(3):312-9. doi: 10.1051/medsci/20153103017. Epub 2015 Apr 8. Med Sci (Paris). 2015. PMID: 25855285 Review. French.
Cited by
-
IFI44 is an immune evasion biomarker for SARS-CoV-2 and Staphylococcus aureus infection in patients with RA.Front Immunol. 2022 Sep 15;13:1013322. doi: 10.3389/fimmu.2022.1013322. eCollection 2022. Front Immunol. 2022. PMID: 36189314 Free PMC article.
-
Machine Learning Models to Predict Protein-Protein Interaction Inhibitors.Molecules. 2022 Nov 17;27(22):7986. doi: 10.3390/molecules27227986. Molecules. 2022. PMID: 36432086 Free PMC article.
-
A Selective Inhibitor of Cardiac Troponin I Phosphorylation by Delta Protein Kinase C (δPKC) as a Treatment for Ischemia-Reperfusion Injury.Pharmaceuticals (Basel). 2022 Feb 22;15(3):271. doi: 10.3390/ph15030271. Pharmaceuticals (Basel). 2022. PMID: 35337069 Free PMC article.
-
Aurora A and AKT Kinase Signaling Associated with Primary Cilia.Cells. 2021 Dec 20;10(12):3602. doi: 10.3390/cells10123602. Cells. 2021. PMID: 34944109 Free PMC article. Review.
-
In Silico Prediction of Plasmodium falciparum Cytoadherence Inhibitors That Disrupt Interaction between gC1qR-DBLβ12 Complex.Pharmaceuticals (Basel). 2022 May 31;15(6):691. doi: 10.3390/ph15060691. Pharmaceuticals (Basel). 2022. PMID: 35745611 Free PMC article.
References
Publication types
MeSH terms
Substances
LinkOut - more resources
Full Text Sources
Miscellaneous
